Newport, RI Map & Demographics
Newport Map
Newport Overview
$55,691
PER CAPITA INCOME
$111,275
AVG FAMILY INCOME
$81,330
AVG HOUSEHOLD INCOME
22.0%
WAGE / INCOME GAP [ % ]
78.0¢/ $1
WAGE / INCOME GAP [ $ ]
$11,545
FAMILY INCOME DEFICIT
0.53
INEQUALITY / GINI INDEX
25,087
TOTAL POPULATION
12,177
MALE POPULATION
12,910
FEMALE POPULATION
94.32
MALES / 100 FEMALES
106.02
FEMALES / 100 MALES
37.4
MEDIAN AGE
2.8
AVG FAMILY SIZE
2.1
AVG HOUSEHOLD SIZE
14,271
LABOR FORCE [ PEOPLE ]
64.6%
PERCENT IN LABOR FORCE
10.0%
UNEMPLOYMENT RATE
Newport Area Codes
Income in Newport
Income Overview in Newport
Per Capita Income in Newport is $55,691, while median incomes of families and households are $111,275 and $81,330 respectively.
| Characteristic | Number | Measure |
| Per Capita Income | 25,087 | $55,691 |
| Median Family Income | 5,228 | $111,275 |
| Mean Family Income | 5,228 | $159,122 |
| Median Household Income | 10,645 | $81,330 |
| Mean Household Income | 10,645 | $123,261 |
| Income Deficit | 5,228 | $11,545 |
| Wage / Income Gap (%) | 25,087 | 21.96% |
| Wage / Income Gap ($) | 25,087 | 78.04¢ per $1 |
| Gini / Inequality Index | 25,087 | 0.53 |
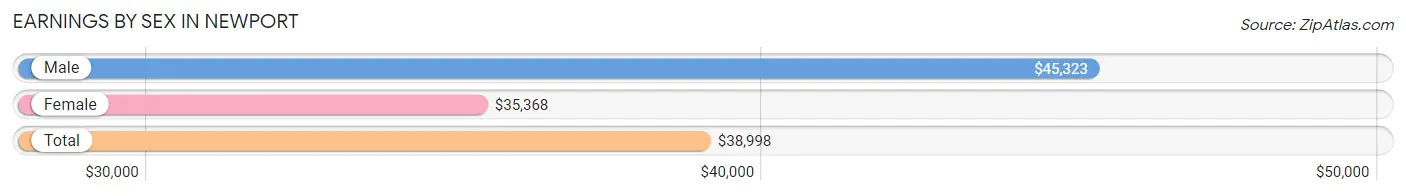
Earnings by Sex in Newport
Average Earnings in Newport are $38,998, $45,323 for men and $35,368 for women, a difference of 22.0%.
| Sex | Number | Average Earnings |
| Male | 7,963 (51.5%) | $45,323 |
| Female | 7,503 (48.5%) | $35,368 |
| Total | 15,466 (100.0%) | $38,998 |
Earnings by Sex by Income Bracket in Newport
The most common earnings brackets in Newport are $100,000+ for men (1,625 | 20.4%) and $100,000+ for women (864 | 11.5%).
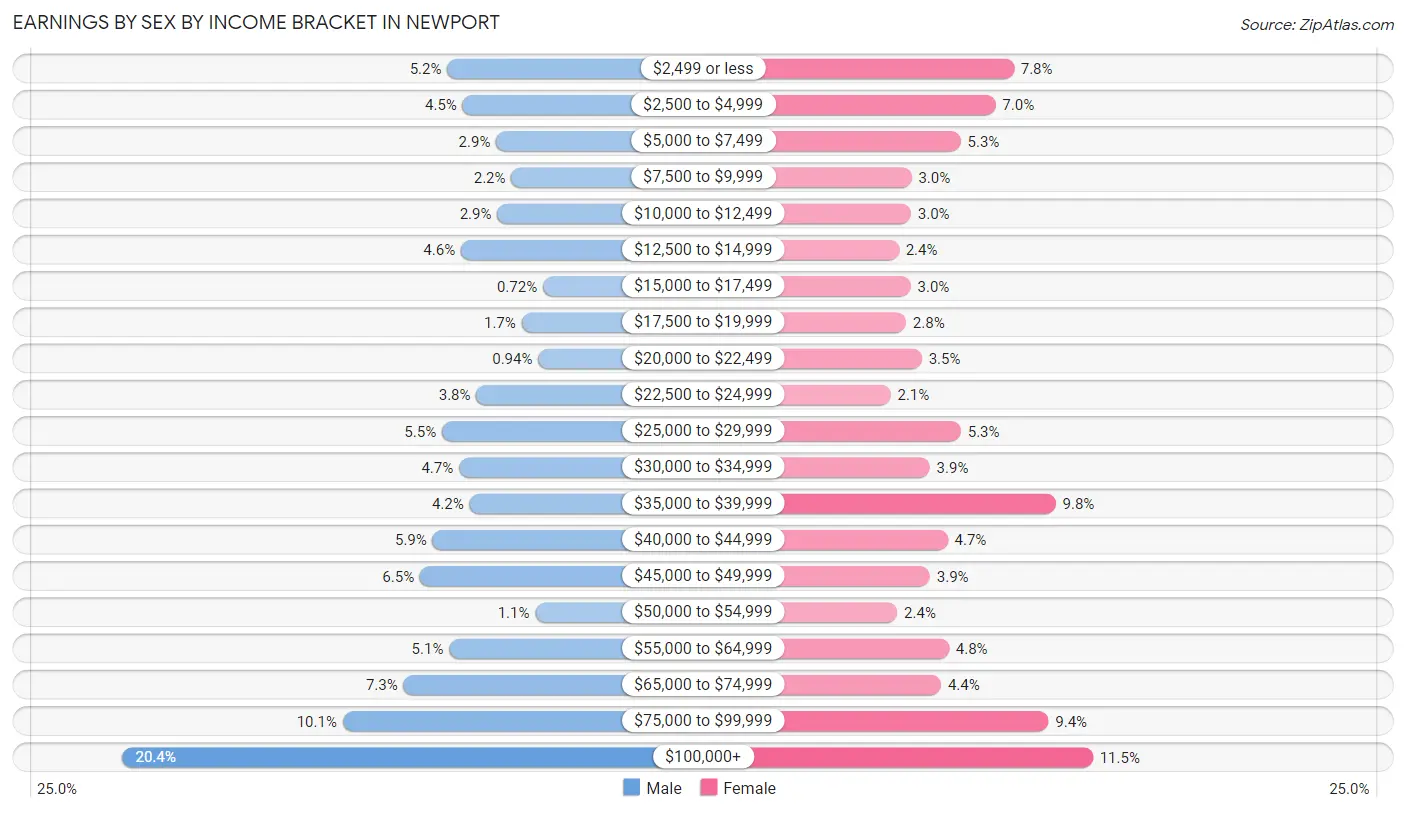
| Income | Male | Female |
| $2,499 or less | 414 (5.2%) | 587 (7.8%) |
| $2,500 to $4,999 | 357 (4.5%) | 522 (7.0%) |
| $5,000 to $7,499 | 232 (2.9%) | 400 (5.3%) |
| $7,500 to $9,999 | 175 (2.2%) | 227 (3.0%) |
| $10,000 to $12,499 | 228 (2.9%) | 225 (3.0%) |
| $12,500 to $14,999 | 363 (4.6%) | 182 (2.4%) |
| $15,000 to $17,499 | 57 (0.7%) | 224 (3.0%) |
| $17,500 to $19,999 | 137 (1.7%) | 208 (2.8%) |
| $20,000 to $22,499 | 75 (0.9%) | 263 (3.5%) |
| $22,500 to $24,999 | 306 (3.8%) | 154 (2.1%) |
| $25,000 to $29,999 | 434 (5.4%) | 401 (5.3%) |
| $30,000 to $34,999 | 370 (4.6%) | 291 (3.9%) |
| $35,000 to $39,999 | 331 (4.2%) | 734 (9.8%) |
| $40,000 to $44,999 | 469 (5.9%) | 354 (4.7%) |
| $45,000 to $49,999 | 516 (6.5%) | 292 (3.9%) |
| $50,000 to $54,999 | 86 (1.1%) | 177 (2.4%) |
| $55,000 to $64,999 | 407 (5.1%) | 359 (4.8%) |
| $65,000 to $74,999 | 577 (7.2%) | 331 (4.4%) |
| $75,000 to $99,999 | 804 (10.1%) | 708 (9.4%) |
| $100,000+ | 1,625 (20.4%) | 864 (11.5%) |
| Total | 7,963 (100.0%) | 7,503 (100.0%) |
Earnings by Sex by Educational Attainment in Newport
Average earnings in Newport are $60,522 for men and $40,616 for women, a difference of 32.9%. Men with an educational attainment of graduate degree enjoy the highest average annual earnings of $107,692, while those with less than high school education earn the least with $28,882. Women with an educational attainment of graduate degree earn the most with the average annual earnings of $83,352, while those with less than high school education have the smallest earnings of $26,455.
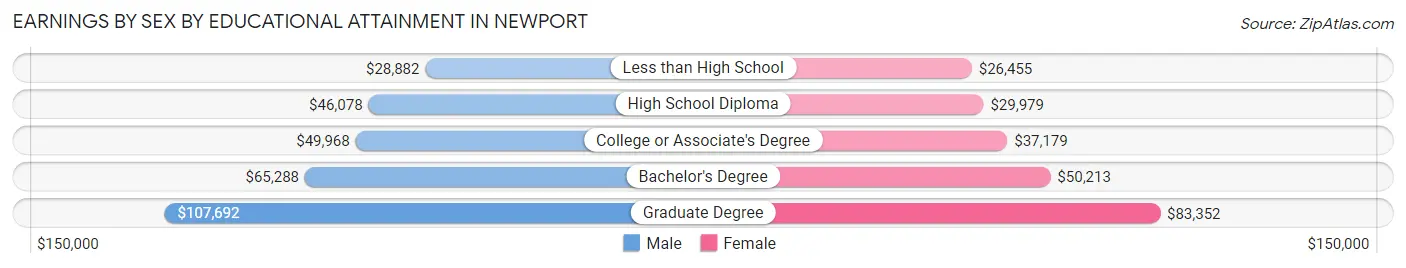
| Educational Attainment | Male Income | Female Income |
| Less than High School | $28,882 | $26,455 |
| High School Diploma | $46,078 | $29,979 |
| College or Associate's Degree | $49,968 | $37,179 |
| Bachelor's Degree | $65,288 | $50,213 |
| Graduate Degree | $107,692 | $83,352 |
| Total | $60,522 | $40,616 |
Family Income in Newport
Family Income Brackets in Newport
According to the Newport family income data, there are 1,093 families falling into the $100,000 to $149,999 income range, which is the most common income bracket and makes up 20.9% of all families. Conversely, the $15,000 to $24,999 income bracket is the least frequent group with only 89 families (1.7%) belonging to this category.
| Income Bracket | # Families | % Families |
| Less than $10,000 | 199 | 3.8% |
| $10,000 to $14,999 | 115 | 2.2% |
| $15,000 to $24,999 | 89 | 1.7% |
| $25,000 to $34,999 | 173 | 3.3% |
| $35,000 to $49,999 | 674 | 12.9% |
| $50,000 to $74,999 | 471 | 9.0% |
| $75,000 to $99,999 | 570 | 10.9% |
| $100,000 to $149,999 | 1,093 | 20.9% |
| $150,000 to $199,999 | 758 | 14.5% |
| $200,000+ | 1,087 | 20.8% |
Family Income by Famaliy Size in Newport
4-person families (751 | 14.4%) account for the highest median family income in Newport with $136,719 per family, while 2-person families (3,193 | 61.1%) have the highest median income of $59,764 per family member.
| Income Bracket | # Families | Median Income |
| 2-Person Families | 3,193 (61.1%) | $119,529 |
| 3-Person Families | 1,012 (19.4%) | $83,041 |
| 4-Person Families | 751 (14.4%) | $136,719 |
| 5-Person Families | 215 (4.1%) | $114,750 |
| 6-Person Families | 57 (1.1%) | $47,863 |
| 7+ Person Families | 0 (0.0%) | $0 |
| Total | 5,228 (100.0%) | $111,275 |
Family Income by Number of Earners in Newport
The median family income in Newport is $111,275, with families comprising 3+ earners (475) having the highest median family income of $167,734, while families with 1 earner (1,627) have the lowest median family income of $65,642, accounting for 9.1% and 31.1% of families, respectively.
| Number of Earners | # Families | Median Income |
| No Earners | 1,014 (19.4%) | $109,643 |
| 1 Earner | 1,627 (31.1%) | $65,642 |
| 2 Earners | 2,112 (40.4%) | $125,341 |
| 3+ Earners | 475 (9.1%) | $167,734 |
| Total | 5,228 (100.0%) | $111,275 |
Household Income in Newport
Household Income Brackets in Newport
With 1,842 households falling in the category, the $100,000 to $149,999 income range is the most frequent in Newport, accounting for 17.3% of all households. In contrast, only 415 households (3.9%) fall into the $10,000 to $14,999 income bracket, making it the least populous group.
| Income Bracket | # Households | % Households |
| Less than $10,000 | 639 | 6.0% |
| $10,000 to $14,999 | 415 | 3.9% |
| $15,000 to $24,999 | 628 | 5.9% |
| $25,000 to $34,999 | 703 | 6.6% |
| $35,000 to $49,999 | 1,341 | 12.6% |
| $50,000 to $74,999 | 1,171 | 11.0% |
| $75,000 to $99,999 | 1,331 | 12.5% |
| $100,000 to $149,999 | 1,842 | 17.3% |
| $150,000 to $199,999 | 1,139 | 10.7% |
| $200,000+ | 1,426 | 13.4% |
Household Income by Householder Age in Newport
The median household income in Newport is $81,330, with the highest median household income of $102,895 found in the 45 to 64 years age bracket for the primary householder. A total of 3,192 households (30.0%) fall into this category. Meanwhile, the 15 to 24 years age bracket for the primary householder has the lowest median household income of $63,125, with 463 households (4.3%) in this group.
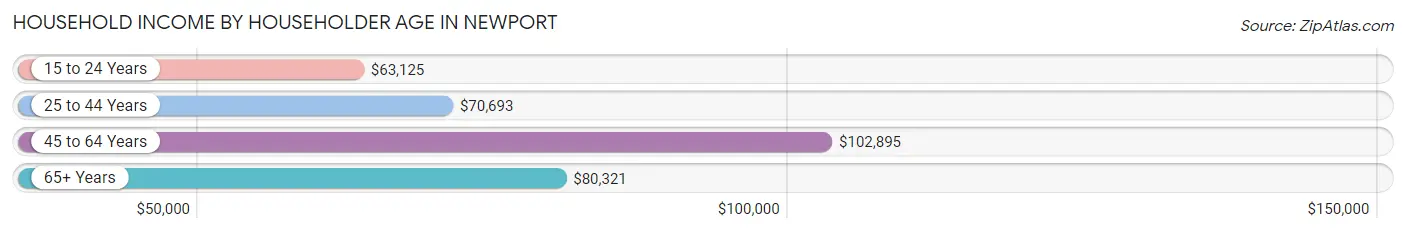
| Income Bracket | # Households | Median Income |
| 15 to 24 Years | 463 (4.3%) | $63,125 |
| 25 to 44 Years | 3,569 (33.5%) | $70,693 |
| 45 to 64 Years | 3,192 (30.0%) | $102,895 |
| 65+ Years | 3,421 (32.1%) | $80,321 |
| Total | 10,645 (100.0%) | $81,330 |
Poverty in Newport
Income Below Poverty by Sex and Age in Newport
With 11.3% poverty level for males and 15.4% for females among the residents of Newport, 12 to 14 year old males and under 5 year old females are the most vulnerable to poverty, with 82 males (40.8%) and 216 females (44.4%) in their respective age groups living below the poverty level.
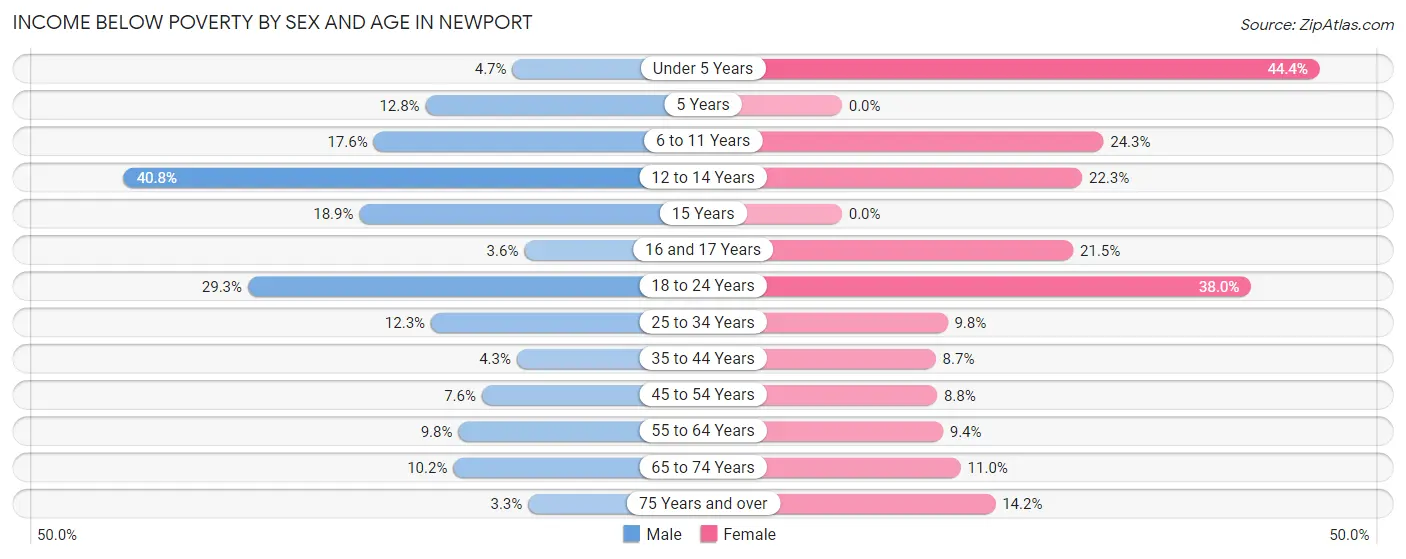
| Age Bracket | Male | Female |
| Under 5 Years | 16 (4.7%) | 216 (44.4%) |
| 5 Years | 16 (12.8%) | 0 (0.0%) |
| 6 to 11 Years | 133 (17.6%) | 100 (24.3%) |
| 12 to 14 Years | 82 (40.8%) | 91 (22.3%) |
| 15 Years | 25 (18.9%) | 0 (0.0%) |
| 16 and 17 Years | 11 (3.6%) | 41 (21.5%) |
| 18 to 24 Years | 231 (29.3%) | 424 (38.0%) |
| 25 to 34 Years | 244 (12.3%) | 171 (9.8%) |
| 35 to 44 Years | 51 (4.3%) | 124 (8.7%) |
| 45 to 54 Years | 109 (7.6%) | 117 (8.8%) |
| 55 to 64 Years | 124 (9.8%) | 149 (9.4%) |
| 65 to 74 Years | 152 (10.2%) | 150 (11.0%) |
| 75 Years and over | 26 (3.3%) | 176 (14.2%) |
| Total | 1,220 (11.3%) | 1,759 (15.4%) |
Income Above Poverty by Sex and Age in Newport
According to the poverty statistics in Newport, males aged 75 years and over and females aged 5 years are the age groups that are most secure financially, with 96.7% of males and 100.0% of females in these age groups living above the poverty line.
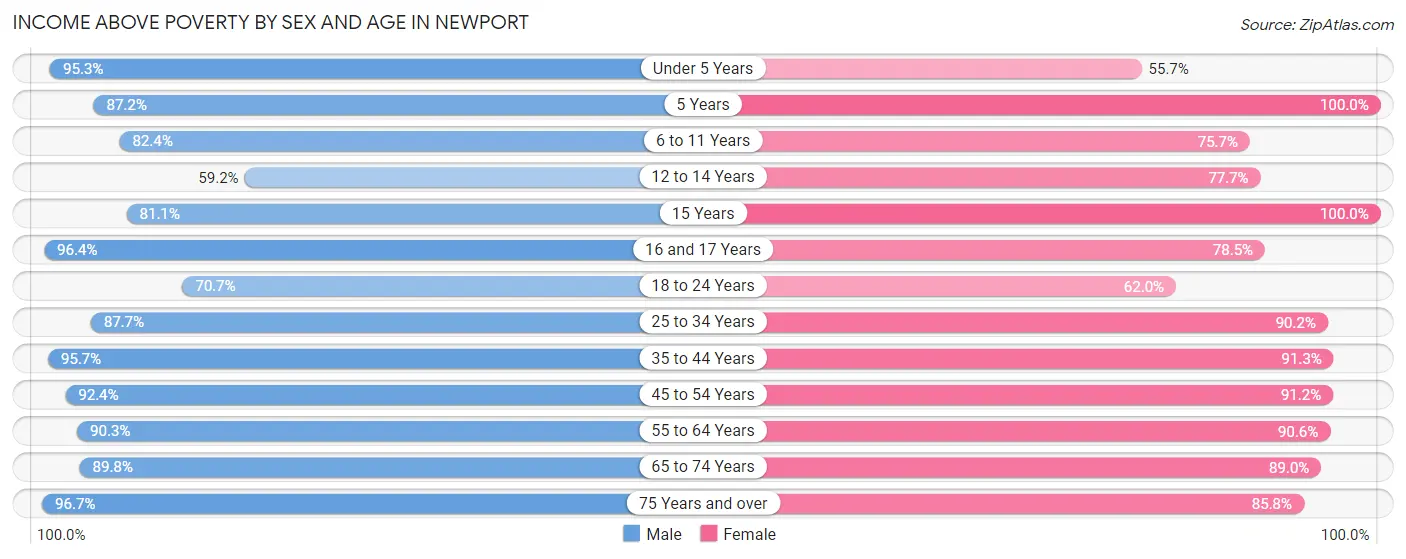
| Age Bracket | Male | Female |
| Under 5 Years | 322 (95.3%) | 271 (55.6%) |
| 5 Years | 109 (87.2%) | 23 (100.0%) |
| 6 to 11 Years | 622 (82.4%) | 312 (75.7%) |
| 12 to 14 Years | 119 (59.2%) | 317 (77.7%) |
| 15 Years | 107 (81.1%) | 105 (100.0%) |
| 16 and 17 Years | 292 (96.4%) | 150 (78.5%) |
| 18 to 24 Years | 558 (70.7%) | 692 (62.0%) |
| 25 to 34 Years | 1,742 (87.7%) | 1,572 (90.2%) |
| 35 to 44 Years | 1,129 (95.7%) | 1,299 (91.3%) |
| 45 to 54 Years | 1,330 (92.4%) | 1,208 (91.2%) |
| 55 to 64 Years | 1,148 (90.2%) | 1,441 (90.6%) |
| 65 to 74 Years | 1,335 (89.8%) | 1,210 (89.0%) |
| 75 Years and over | 769 (96.7%) | 1,060 (85.8%) |
| Total | 9,582 (88.7%) | 9,660 (84.6%) |
Income Below Poverty Among Married-Couple Families in Newport
The poverty statistics for married-couple families in Newport show that 2.3% or 83 of the total 3,664 families live below the poverty line. Families with 3 or 4 children have the highest poverty rate of 17.9%, comprising of 28 families. On the other hand, families with no children have the lowest poverty rate of 1.4%, which includes 37 families.
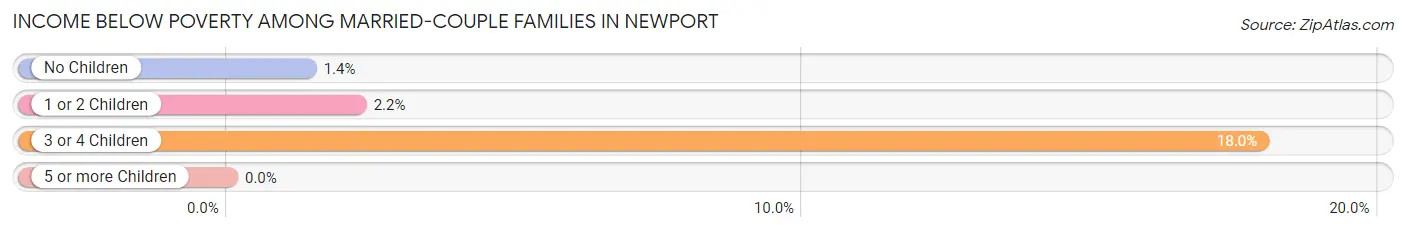
| Children | Above Poverty | Below Poverty |
| No Children | 2,666 (98.6%) | 37 (1.4%) |
| 1 or 2 Children | 787 (97.8%) | 18 (2.2%) |
| 3 or 4 Children | 128 (82.1%) | 28 (17.9%) |
| 5 or more Children | 0 (0.0%) | 0 (0.0%) |
| Total | 3,581 (97.7%) | 83 (2.3%) |
Income Below Poverty Among Single-Parent Households in Newport
According to the poverty data in Newport, 26.2% or 95 single-father households and 19.7% or 236 single-mother households are living below the poverty line. Among single-father households, those with 3 or 4 children have the highest poverty rate, with 24 households (100.0%) experiencing poverty. Likewise, among single-mother households, those with 3 or 4 children have the highest poverty rate, with 14 households (33.3%) falling below the poverty line.
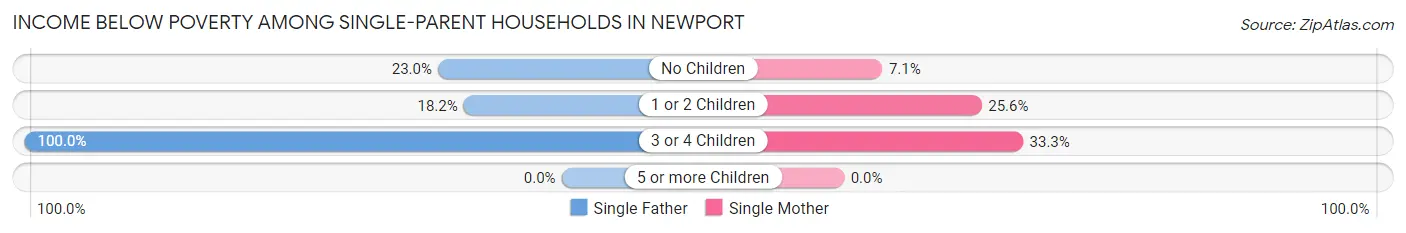
| Children | Single Father | Single Mother |
| No Children | 44 (23.0%) | 29 (7.1%) |
| 1 or 2 Children | 27 (18.2%) | 193 (25.6%) |
| 3 or 4 Children | 24 (100.0%) | 14 (33.3%) |
| 5 or more Children | 0 (0.0%) | 0 (0.0%) |
| Total | 95 (26.2%) | 236 (19.7%) |
Income Below Poverty Among Married-Couple vs Single-Parent Households in Newport
The poverty data for Newport shows that 83 of the married-couple family households (2.3%) and 331 of the single-parent households (21.2%) are living below the poverty level. Within the married-couple family households, those with 3 or 4 children have the highest poverty rate, with 28 households (17.9%) falling below the poverty line. Among the single-parent households, those with 3 or 4 children have the highest poverty rate, with 38 household (57.6%) living below poverty.
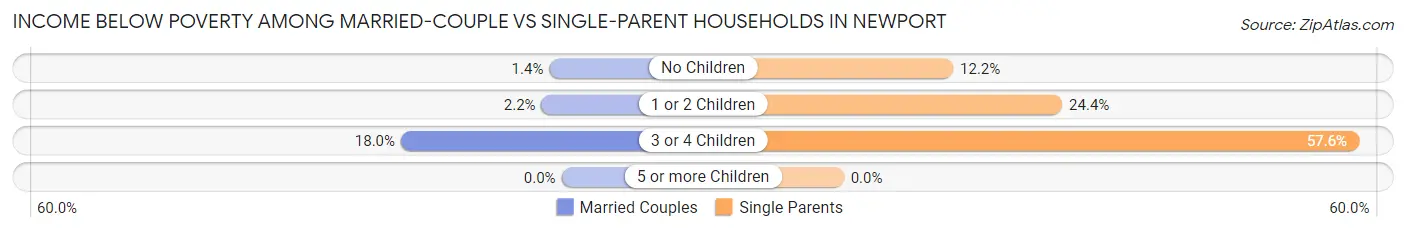
| Children | Married-Couple Families | Single-Parent Households |
| No Children | 37 (1.4%) | 73 (12.2%) |
| 1 or 2 Children | 18 (2.2%) | 220 (24.4%) |
| 3 or 4 Children | 28 (17.9%) | 38 (57.6%) |
| 5 or more Children | 0 (0.0%) | 0 (0.0%) |
| Total | 83 (2.3%) | 331 (21.2%) |
Race in Newport
The most populous races in Newport are White / Caucasian (19,580 | 78.0%), Hispanic or Latino (2,413 | 9.6%), and Two or more Races (1,986 | 7.9%).
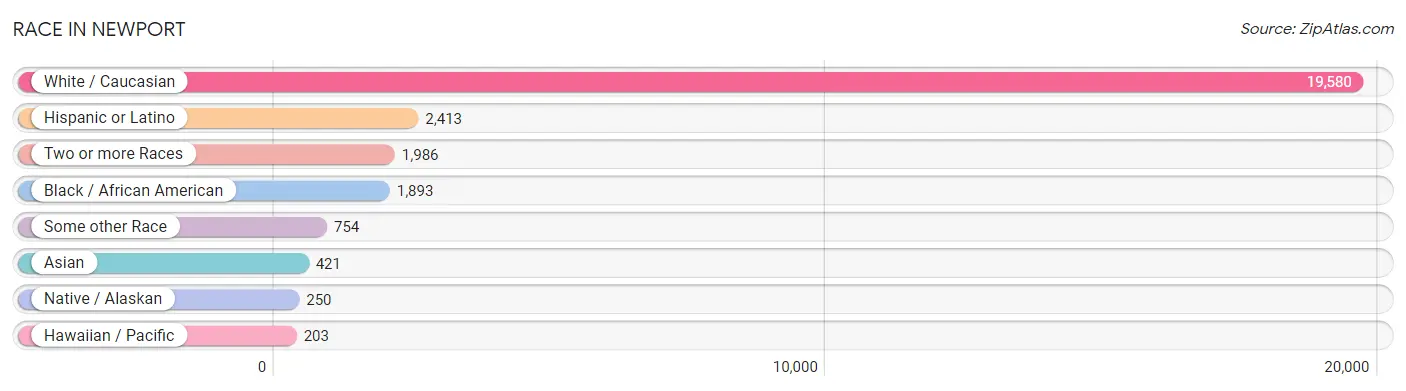
| Race | # Population | % Population |
| Asian | 421 | 1.7% |
| Black / African American | 1,893 | 7.5% |
| Hawaiian / Pacific | 203 | 0.8% |
| Hispanic or Latino | 2,413 | 9.6% |
| Native / Alaskan | 250 | 1.0% |
| White / Caucasian | 19,580 | 78.0% |
| Two or more Races | 1,986 | 7.9% |
| Some other Race | 754 | 3.0% |
| Total | 25,087 | 100.0% |
Ancestry in Newport
The most populous ancestries reported in Newport are Irish (6,209 | 24.7%), English (3,384 | 13.5%), Italian (2,667 | 10.6%), German (1,821 | 7.3%), and Puerto Rican (1,410 | 5.6%), together accounting for 61.7% of all Newport residents.
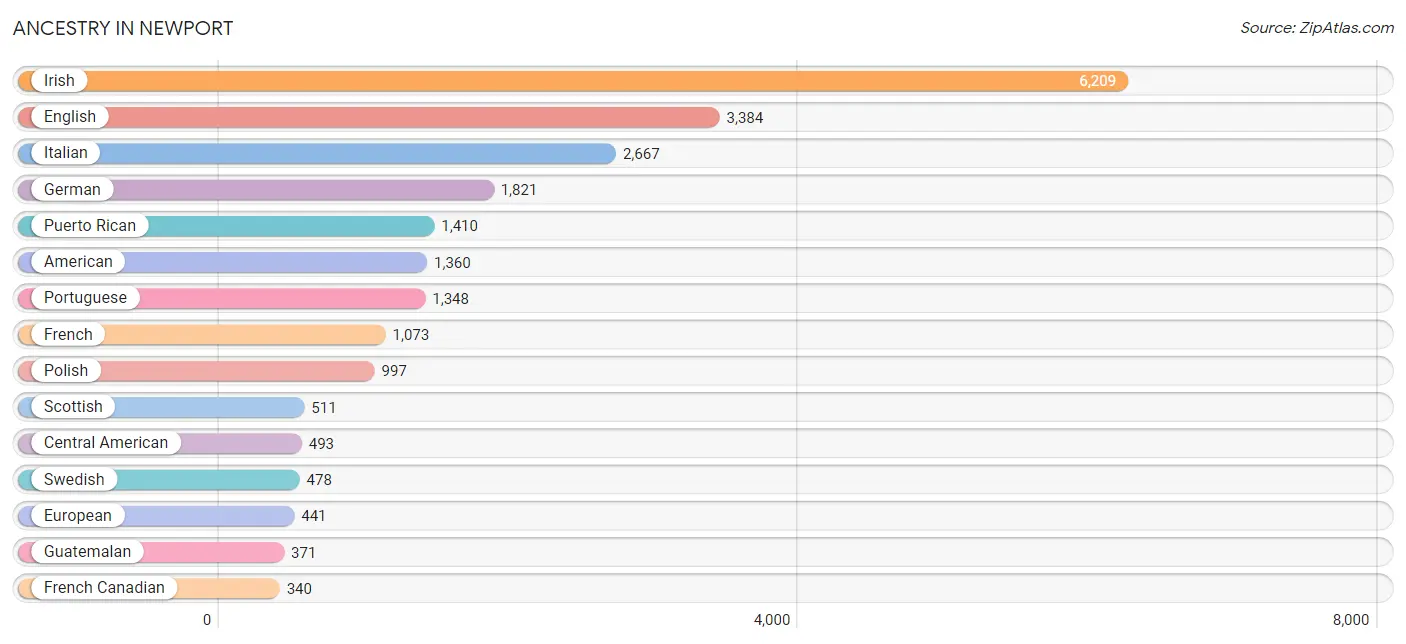
| Ancestry | # Population | % Population |
| African | 38 | 0.2% |
| Albanian | 6 | 0.0% |
| American | 1,360 | 5.4% |
| Arab | 119 | 0.5% |
| Argentinean | 67 | 0.3% |
| Armenian | 63 | 0.3% |
| Australian | 28 | 0.1% |
| Austrian | 63 | 0.3% |
| Barbadian | 2 | 0.0% |
| Bermudan | 17 | 0.1% |
| Bhutanese | 145 | 0.6% |
| Brazilian | 22 | 0.1% |
| British | 244 | 1.0% |
| British West Indian | 3 | 0.0% |
| Bulgarian | 66 | 0.3% |
| Burmese | 145 | 0.6% |
| Cambodian | 15 | 0.1% |
| Canadian | 37 | 0.2% |
| Cape Verdean | 127 | 0.5% |
| Central American | 493 | 2.0% |
| Central American Indian | 52 | 0.2% |
| Cherokee | 35 | 0.1% |
| Cheyenne | 13 | 0.1% |
| Costa Rican | 3 | 0.0% |
| Croatian | 20 | 0.1% |
| Cuban | 4 | 0.0% |
| Czech | 28 | 0.1% |
| Czechoslovakian | 13 | 0.1% |
| Danish | 76 | 0.3% |
| Dominican | 130 | 0.5% |
| Dutch | 212 | 0.9% |
| Eastern European | 83 | 0.3% |
| Ecuadorian | 37 | 0.2% |
| Egyptian | 21 | 0.1% |
| English | 3,384 | 13.5% |
| Estonian | 15 | 0.1% |
| European | 441 | 1.8% |
| Finnish | 47 | 0.2% |
| French | 1,073 | 4.3% |
| French Canadian | 340 | 1.4% |
| German | 1,821 | 7.3% |
| Greek | 245 | 1.0% |
| Guatemalan | 371 | 1.5% |
| Haitian | 8 | 0.0% |
| Honduran | 82 | 0.3% |
| Hungarian | 50 | 0.2% |
| Indian (Asian) | 83 | 0.3% |
| Iranian | 18 | 0.1% |
| Irish | 6,209 | 24.7% |
| Iroquois | 10 | 0.0% |
| Italian | 2,667 | 10.6% |
| Jamaican | 12 | 0.1% |
| Korean | 171 | 0.7% |
| Lebanese | 85 | 0.3% |
| Lithuanian | 125 | 0.5% |
| Malaysian | 7 | 0.0% |
| Maltese | 33 | 0.1% |
| Mexican | 174 | 0.7% |
| Mexican American Indian | 3 | 0.0% |
| Native Hawaiian | 211 | 0.8% |
| Navajo | 46 | 0.2% |
| Northern European | 44 | 0.2% |
| Norwegian | 195 | 0.8% |
| Pakistani | 19 | 0.1% |
| Polish | 997 | 4.0% |
| Portuguese | 1,348 | 5.4% |
| Puerto Rican | 1,410 | 5.6% |
| Romanian | 105 | 0.4% |
| Russian | 244 | 1.0% |
| Salvadoran | 37 | 0.2% |
| Samoan | 12 | 0.1% |
| Scandinavian | 46 | 0.2% |
| Scotch-Irish | 266 | 1.1% |
| Scottish | 511 | 2.0% |
| Seminole | 53 | 0.2% |
| Shoshone | 11 | 0.0% |
| Slavic | 5 | 0.0% |
| Slovak | 12 | 0.1% |
| South American | 104 | 0.4% |
| Spaniard | 48 | 0.2% |
| Spanish | 29 | 0.1% |
| Sri Lankan | 47 | 0.2% |
| Subsaharan African | 165 | 0.7% |
| Swedish | 478 | 1.9% |
| Swiss | 28 | 0.1% |
| Syrian | 13 | 0.1% |
| Thai | 6 | 0.0% |
| Trinidadian and Tobagonian | 50 | 0.2% |
| Ukrainian | 83 | 0.3% |
| Welsh | 192 | 0.8% | View All 90 Rows |
Immigrants in Newport
The most numerous immigrant groups reported in Newport came from Latin America (804 | 3.2%), Europe (721 | 2.9%), Central America (505 | 2.0%), Guatemala (449 | 1.8%), and Northern Europe (285 | 1.1%), together accounting for 11.0% of all Newport residents.
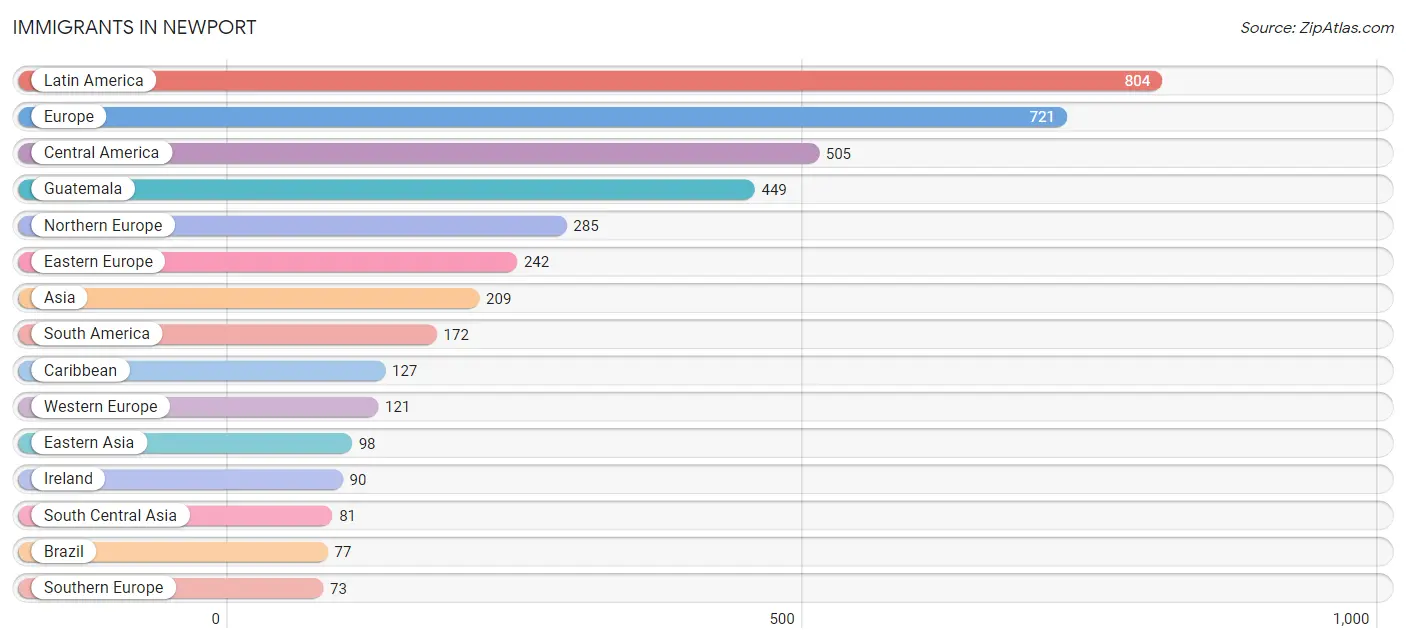
| Immigration Origin | # Population | % Population |
| Africa | 48 | 0.2% |
| Argentina | 58 | 0.2% |
| Asia | 209 | 0.8% |
| Australia | 6 | 0.0% |
| Austria | 10 | 0.0% |
| Azores | 1 | 0.0% |
| Barbados | 2 | 0.0% |
| Bosnia and Herzegovina | 12 | 0.1% |
| Brazil | 77 | 0.3% |
| Bulgaria | 66 | 0.3% |
| Cabo Verde | 18 | 0.1% |
| Canada | 28 | 0.1% |
| Caribbean | 127 | 0.5% |
| Central America | 505 | 2.0% |
| China | 71 | 0.3% |
| Denmark | 11 | 0.0% |
| Dominica | 39 | 0.2% |
| Dominican Republic | 21 | 0.1% |
| Eastern Asia | 98 | 0.4% |
| Eastern Europe | 242 | 1.0% |
| Ecuador | 37 | 0.2% |
| El Salvador | 22 | 0.1% |
| England | 52 | 0.2% |
| Europe | 721 | 2.9% |
| France | 27 | 0.1% |
| Germany | 23 | 0.1% |
| Greece | 32 | 0.1% |
| Guatemala | 449 | 1.8% |
| India | 6 | 0.0% |
| Ireland | 90 | 0.4% |
| Italy | 22 | 0.1% |
| Jamaica | 37 | 0.2% |
| Japan | 22 | 0.1% |
| Kazakhstan | 24 | 0.1% |
| Korea | 5 | 0.0% |
| Laos | 7 | 0.0% |
| Latin America | 804 | 3.2% |
| Mexico | 34 | 0.1% |
| Netherlands | 61 | 0.2% |
| Northern Africa | 10 | 0.0% |
| Northern Europe | 285 | 1.1% |
| Oceania | 6 | 0.0% |
| Pakistan | 51 | 0.2% |
| Poland | 27 | 0.1% |
| Portugal | 19 | 0.1% |
| Romania | 46 | 0.2% |
| Russia | 63 | 0.3% |
| Scotland | 20 | 0.1% |
| Singapore | 4 | 0.0% |
| South Africa | 5 | 0.0% |
| South America | 172 | 0.7% |
| South Central Asia | 81 | 0.3% |
| South Eastern Asia | 30 | 0.1% |
| Southern Europe | 73 | 0.3% |
| Sweden | 9 | 0.0% |
| Taiwan | 48 | 0.2% |
| Thailand | 19 | 0.1% |
| Trinidad and Tobago | 28 | 0.1% |
| Ukraine | 28 | 0.1% |
| Western Africa | 18 | 0.1% |
| Western Europe | 121 | 0.5% | View All 61 Rows |
Sex and Age in Newport
Sex and Age in Newport
The most populous age groups in Newport are 20 to 24 Years (1,326 | 10.9%) for men and 20 to 24 Years (1,314 | 10.2%) for women.
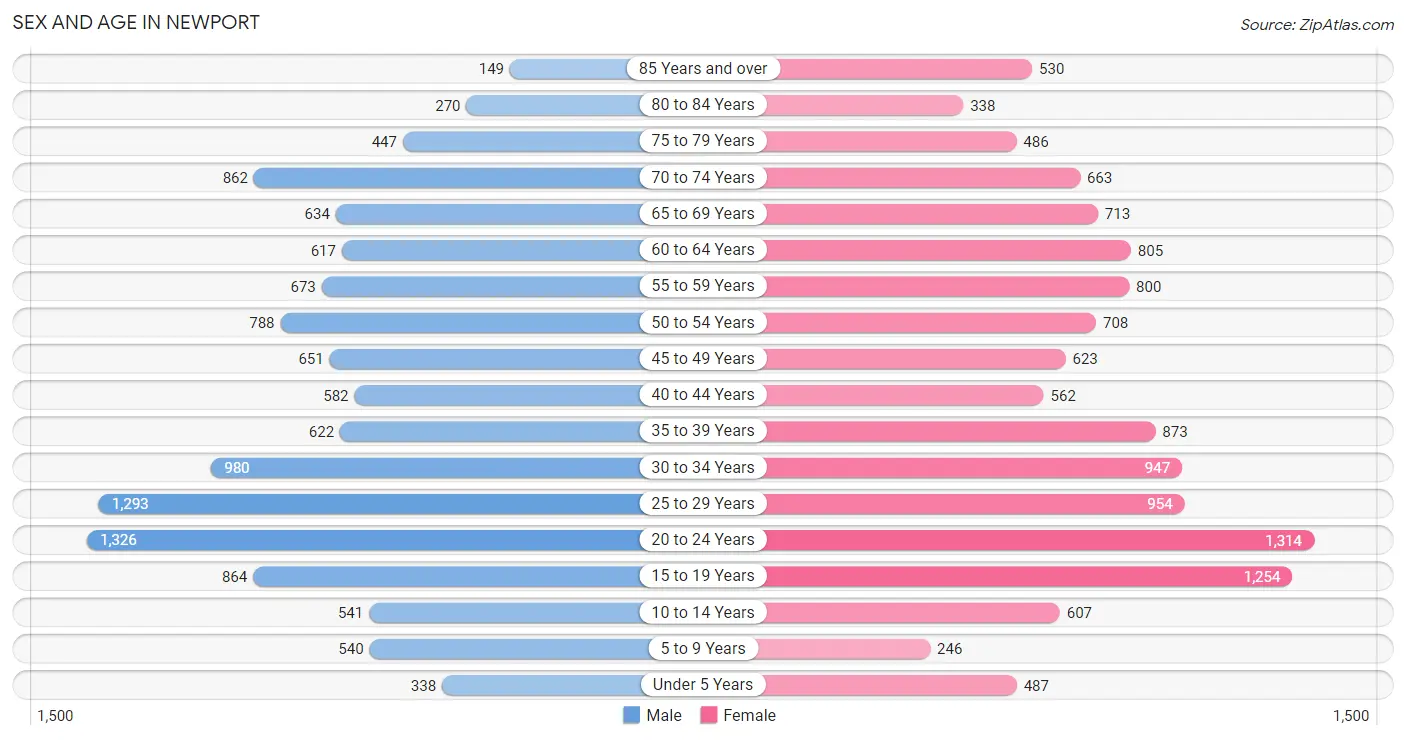
| Age Bracket | Male | Female |
| Under 5 Years | 338 (2.8%) | 487 (3.8%) |
| 5 to 9 Years | 540 (4.4%) | 246 (1.9%) |
| 10 to 14 Years | 541 (4.4%) | 607 (4.7%) |
| 15 to 19 Years | 864 (7.1%) | 1,254 (9.7%) |
| 20 to 24 Years | 1,326 (10.9%) | 1,314 (10.2%) |
| 25 to 29 Years | 1,293 (10.6%) | 954 (7.4%) |
| 30 to 34 Years | 980 (8.1%) | 947 (7.3%) |
| 35 to 39 Years | 622 (5.1%) | 873 (6.8%) |
| 40 to 44 Years | 582 (4.8%) | 562 (4.3%) |
| 45 to 49 Years | 651 (5.3%) | 623 (4.8%) |
| 50 to 54 Years | 788 (6.5%) | 708 (5.5%) |
| 55 to 59 Years | 673 (5.5%) | 800 (6.2%) |
| 60 to 64 Years | 617 (5.1%) | 805 (6.2%) |
| 65 to 69 Years | 634 (5.2%) | 713 (5.5%) |
| 70 to 74 Years | 862 (7.1%) | 663 (5.1%) |
| 75 to 79 Years | 447 (3.7%) | 486 (3.8%) |
| 80 to 84 Years | 270 (2.2%) | 338 (2.6%) |
| 85 Years and over | 149 (1.2%) | 530 (4.1%) |
| Total | 12,177 (100.0%) | 12,910 (100.0%) |
Families and Households in Newport
Median Family Size in Newport
The median family size in Newport is 2.76 persons per family, with single male/father families (363 | 6.9%) accounting for the largest median family size of 2.98 persons per family. On the other hand, single female/mother families (1,201 | 23.0%) represent the smallest median family size with 2.72 persons per family.
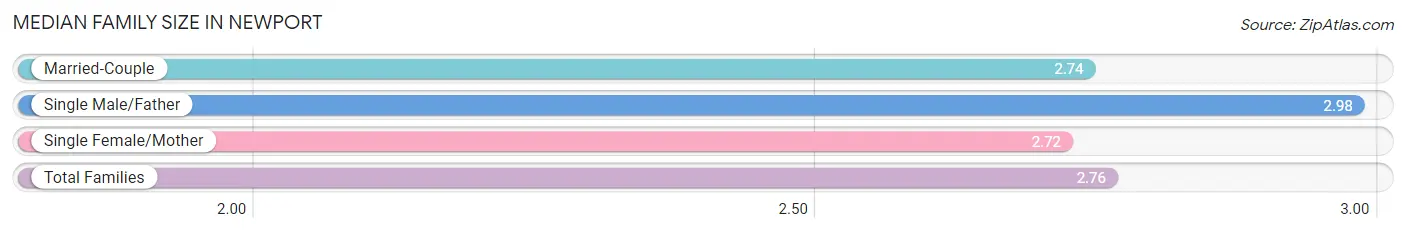
| Family Type | # Families | Family Size |
| Married-Couple | 3,664 (70.1%) | 2.74 |
| Single Male/Father | 363 (6.9%) | 2.98 |
| Single Female/Mother | 1,201 (23.0%) | 2.72 |
| Total Families | 5,228 (100.0%) | 2.76 |
Median Household Size in Newport
The median household size in Newport is 2.08 persons per household, with single male/father households (363 | 3.4%) accounting for the largest median household size of 3.64 persons per household. non-family households (5,417 | 50.9%) represent the smallest median household size with 1.34 persons per household.
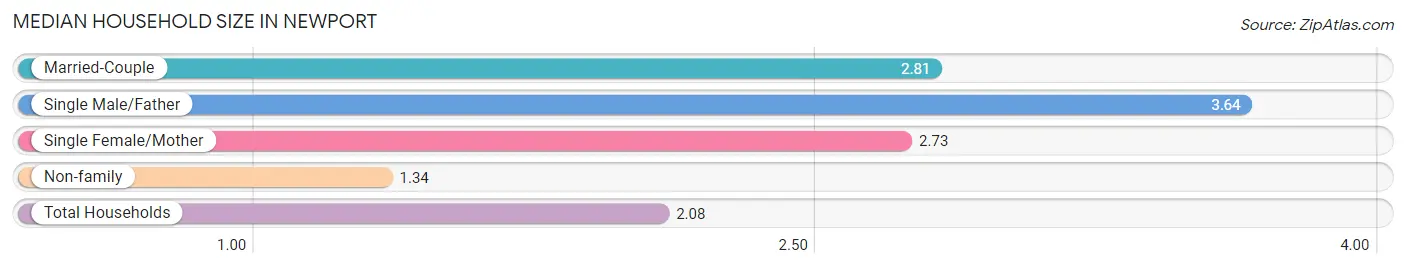
| Household Type | # Households | Household Size |
| Married-Couple | 3,664 (34.4%) | 2.81 |
| Single Male/Father | 363 (3.4%) | 3.64 |
| Single Female/Mother | 1,201 (11.3%) | 2.73 |
| Non-family | 5,417 (50.9%) | 1.34 |
| Total Households | 10,645 (100.0%) | 2.08 |
Household Size by Marriage Status in Newport
Out of a total of 10,645 households in Newport, 5,228 (49.1%) are family households, while 5,417 (50.9%) are nonfamily households. The most numerous type of family households are 2-person households, comprising 3,052, and the most common type of nonfamily households are 1-person households, comprising 4,246.
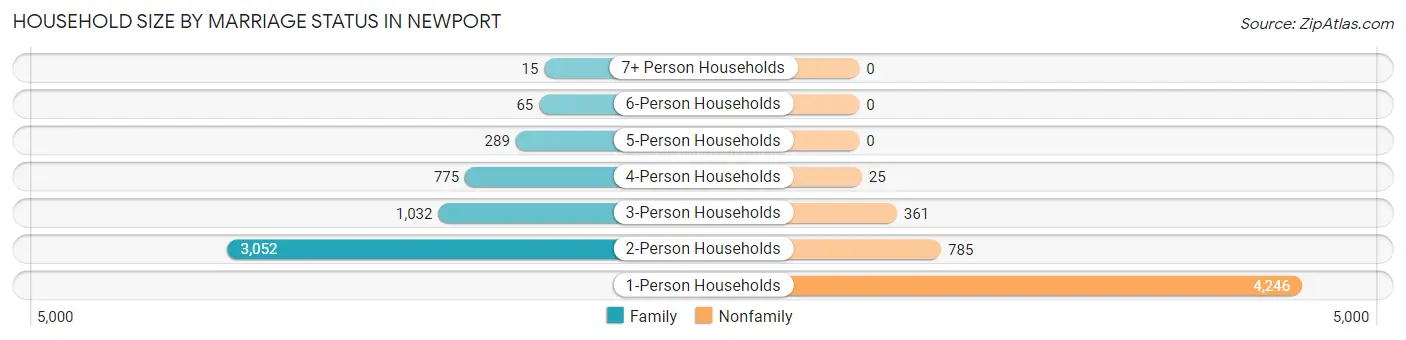
| Household Size | Family Households | Nonfamily Households |
| 1-Person Households | - | 4,246 (39.9%) |
| 2-Person Households | 3,052 (28.7%) | 785 (7.4%) |
| 3-Person Households | 1,032 (9.7%) | 361 (3.4%) |
| 4-Person Households | 775 (7.3%) | 25 (0.2%) |
| 5-Person Households | 289 (2.7%) | 0 (0.0%) |
| 6-Person Households | 65 (0.6%) | 0 (0.0%) |
| 7+ Person Households | 15 (0.1%) | 0 (0.0%) |
| Total | 5,228 (49.1%) | 5,417 (50.9%) |
Female Fertility in Newport
Fertility by Age in Newport
Average fertility rate in Newport is 35.0 births per 1,000 women. Women in the age bracket of 20 to 34 years have the highest fertility rate with 58.0 births per 1,000 women. Women in the age bracket of 20 to 34 years acount for 78.7% of all women with births.
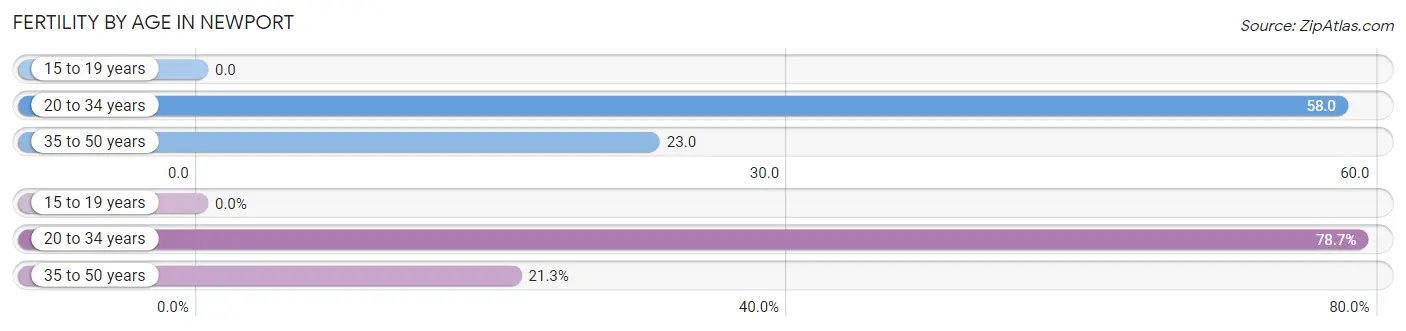
| Age Bracket | Women with Births | Births / 1,000 Women |
| 15 to 19 years | 0 (0.0%) | 0.0 |
| 20 to 34 years | 185 (78.7%) | 58.0 |
| 35 to 50 years | 50 (21.3%) | 23.0 |
| Total | 235 (100.0%) | 35.0 |
Fertility by Age by Marriage Status in Newport
24.3% of women with births (235) in Newport are married. The highest percentage of unmarried women with births falls into 20 to 34 years age bracket with 81.6% of them unmarried at the time of birth, while the lowest percentage of unmarried women with births belong to 35 to 50 years age bracket with 54.0% of them unmarried.
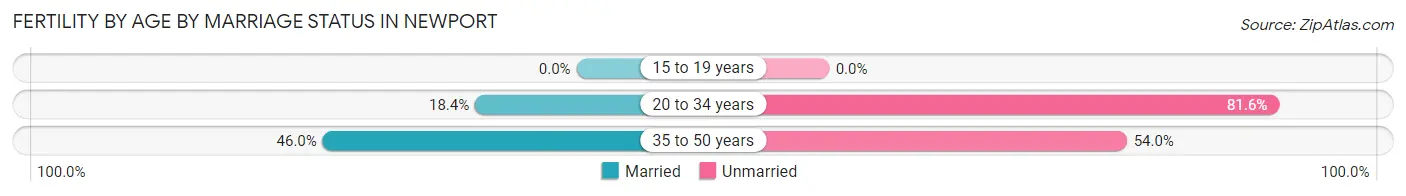
| Age Bracket | Married | Unmarried |
| 15 to 19 years | 0 (0.0%) | 0 (0.0%) |
| 20 to 34 years | 34 (18.4%) | 151 (81.6%) |
| 35 to 50 years | 23 (46.0%) | 27 (54.0%) |
| Total | 57 (24.3%) | 178 (75.7%) |
Fertility by Education in Newport
Average fertility rate in Newport is 35.0 births per 1,000 women. Women with the education attainment of high school diploma have the highest fertility rate of 87.0 births per 1,000 women, while women with the education attainment of bachelor's degree have the lowest fertility at 4.0 births per 1,000 women. Women with the education attainment of high school diploma represent 66.8% of all women with births.
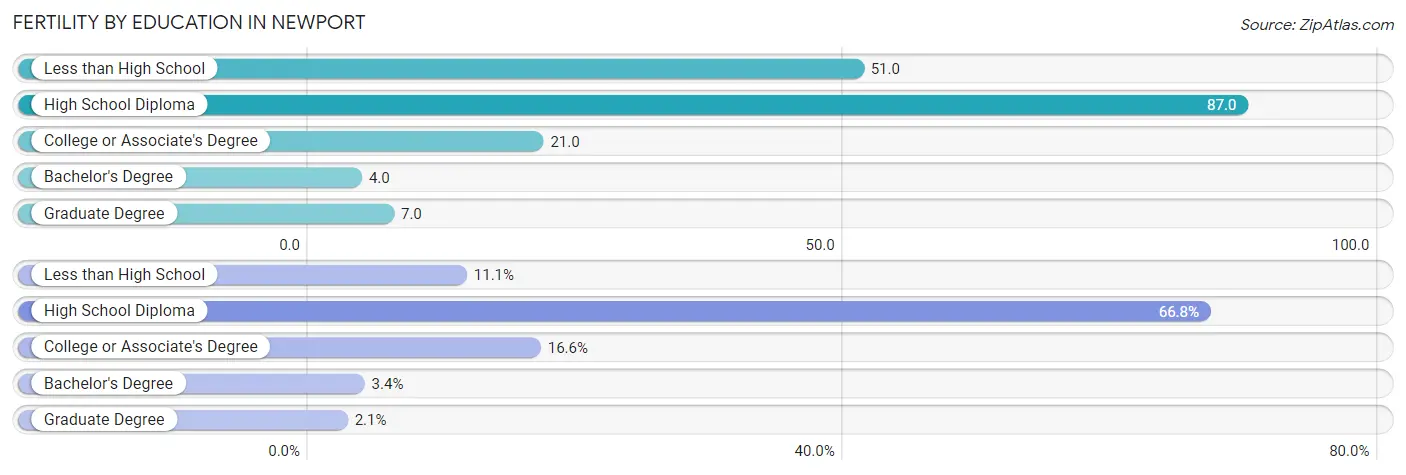
| Educational Attainment | Women with Births | Births / 1,000 Women |
| Less than High School | 26 (11.1%) | 51.0 |
| High School Diploma | 157 (66.8%) | 87.0 |
| College or Associate's Degree | 39 (16.6%) | 21.0 |
| Bachelor's Degree | 8 (3.4%) | 4.0 |
| Graduate Degree | 5 (2.1%) | 7.0 |
| Total | 235 (100.0%) | 35.0 |
Fertility by Education by Marriage Status in Newport
75.7% of women with births in Newport are unmarried. Women with the educational attainment of bachelor's degree are most likely to be married with 100.0% of them married at childbirth, while women with the educational attainment of high school diploma are least likely to be married with 100.0% of them unmarried at childbirth.
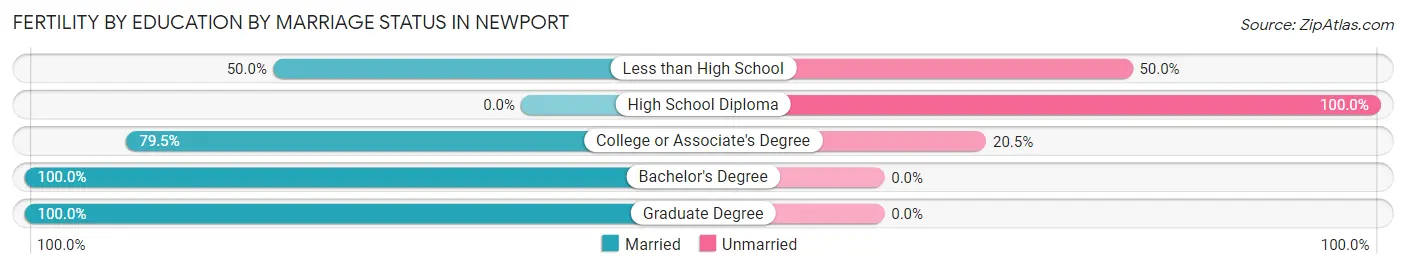
| Educational Attainment | Married | Unmarried |
| Less than High School | 13 (50.0%) | 13 (50.0%) |
| High School Diploma | 0 (0.0%) | 157 (100.0%) |
| College or Associate's Degree | 31 (79.5%) | 8 (20.5%) |
| Bachelor's Degree | 8 (100.0%) | 0 (0.0%) |
| Graduate Degree | 5 (100.0%) | 0 (0.0%) |
| Total | 57 (24.3%) | 178 (75.7%) |
Employment Characteristics in Newport
Employment by Class of Employer in Newport
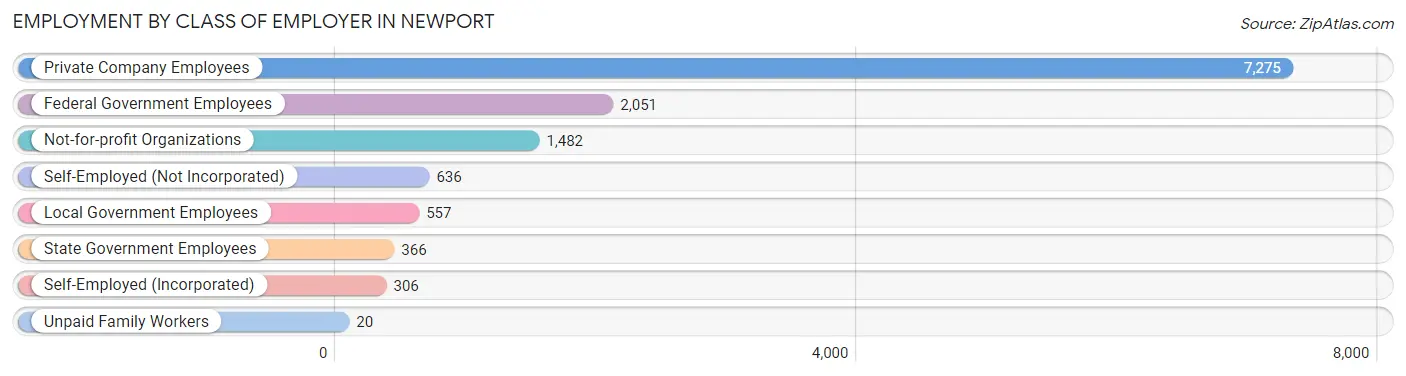
Among the 12,693 employed individuals in Newport, private company employees (7,275 | 57.3%), federal government employees (2,051 | 16.2%), and not-for-profit organizations (1,482 | 11.7%) make up the most common classes of employment.
| Employer Class | # Employees | % Employees |
| Private Company Employees | 7,275 | 57.3% |
| Self-Employed (Incorporated) | 306 | 2.4% |
| Self-Employed (Not Incorporated) | 636 | 5.0% |
| Not-for-profit Organizations | 1,482 | 11.7% |
| Local Government Employees | 557 | 4.4% |
| State Government Employees | 366 | 2.9% |
| Federal Government Employees | 2,051 | 16.2% |
| Unpaid Family Workers | 20 | 0.2% |
| Total | 12,693 | 100.0% |
Employment Status by Age in Newport
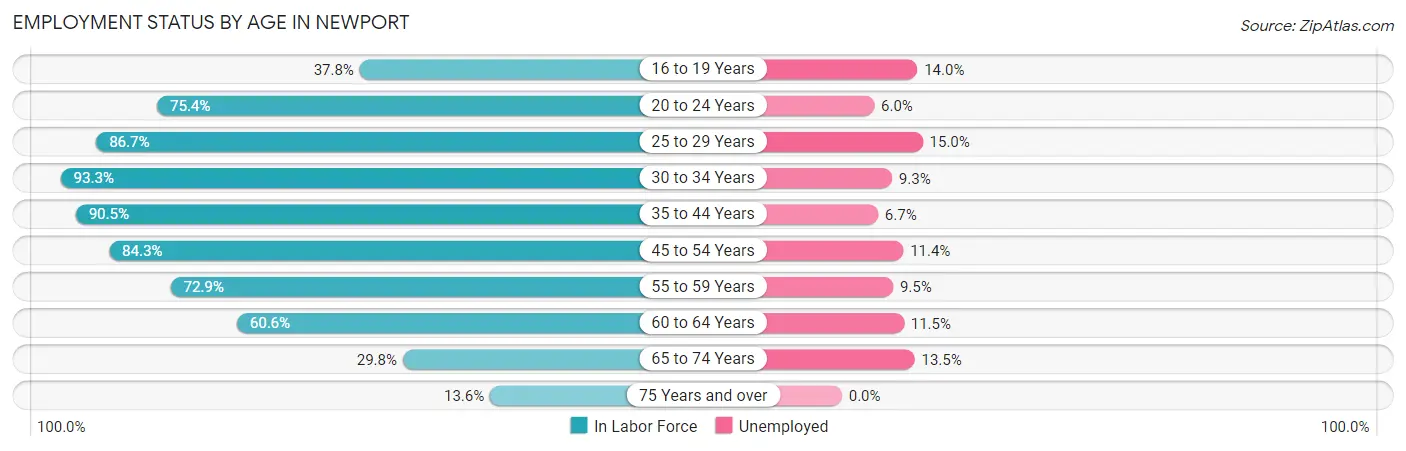
According to the labor force statistics for Newport, out of the total population over 16 years of age (22,091), 64.6% or 14,271 individuals are in the labor force, with 10.0% or 1,427 of them unemployed. The age group with the highest labor force participation rate is 30 to 34 years, with 93.3% or 1,798 individuals in the labor force. Within the labor force, the 25 to 29 years age range has the highest percentage of unemployed individuals, with 15.0% or 292 of them being unemployed.
| Age Bracket | In Labor Force | Unemployed |
| 16 to 19 Years | 711 (37.8%) | 100 (14.0%) |
| 20 to 24 Years | 1,991 (75.4%) | 119 (6.0%) |
| 25 to 29 Years | 1,948 (86.7%) | 292 (15.0%) |
| 30 to 34 Years | 1,798 (93.3%) | 167 (9.3%) |
| 35 to 44 Years | 2,388 (90.5%) | 160 (6.7%) |
| 45 to 54 Years | 2,335 (84.3%) | 266 (11.4%) |
| 55 to 59 Years | 1,074 (72.9%) | 102 (9.5%) |
| 60 to 64 Years | 862 (60.6%) | 99 (11.5%) |
| 65 to 74 Years | 856 (29.8%) | 116 (13.5%) |
| 75 Years and over | 302 (13.6%) | 0 (0.0%) |
| Total | 14,271 (64.6%) | 1,427 (10.0%) |
Employment Status by Educational Attainment in Newport
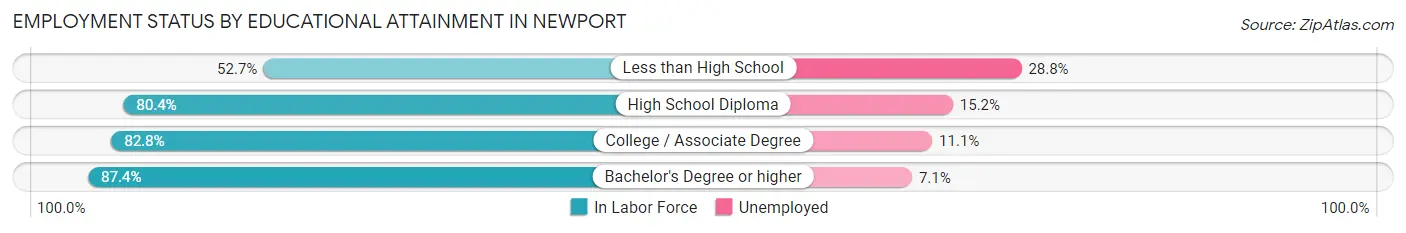
According to labor force statistics for Newport, 83.4% of individuals (10,407) out of the total population between 25 and 64 years of age (12,478) are in the labor force, with 10.4% or 1,082 of them being unemployed. The group with the highest labor force participation rate are those with the educational attainment of bachelor's degree or higher, with 87.4% or 5,696 individuals in the labor force. Within the labor force, individuals with less than high school education have the highest percentage of unemployment, with 28.8% or 82 of them being unemployed.
| Educational Attainment | In Labor Force | Unemployed |
| Less than High School | 285 (52.7%) | 156 (28.8%) |
| High School Diploma | 2,152 (80.4%) | 407 (15.2%) |
| College / Associate Degree | 2,271 (82.8%) | 304 (11.1%) |
| Bachelor's Degree or higher | 5,696 (87.4%) | 463 (7.1%) |
| Total | 10,407 (83.4%) | 1,298 (10.4%) |
Employment Occupations by Sex in Newport
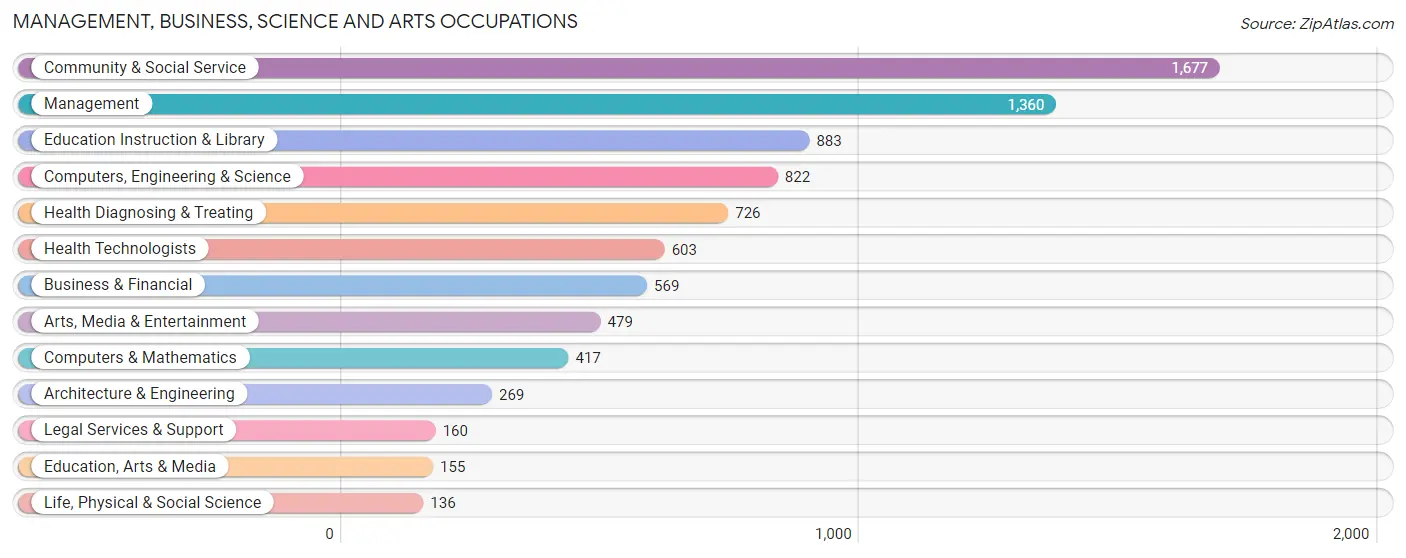
Management, Business, Science and Arts Occupations
The most common Management, Business, Science and Arts occupations in Newport are Community & Social Service (1,677 | 14.6%), Management (1,360 | 11.9%), Education Instruction & Library (883 | 7.7%), Computers, Engineering & Science (822 | 7.2%), and Health Diagnosing & Treating (726 | 6.3%).
Management, Business, Science and Arts Occupations by Sex
Within the Management, Business, Science and Arts occupations in Newport, the most male-oriented occupations are Architecture & Engineering (74.0%), Computers & Mathematics (69.1%), and Computers, Engineering & Science (67.5%), while the most female-oriented occupations are Education, Arts & Media (86.5%), Health Diagnosing & Treating (83.6%), and Health Technologists (81.8%).
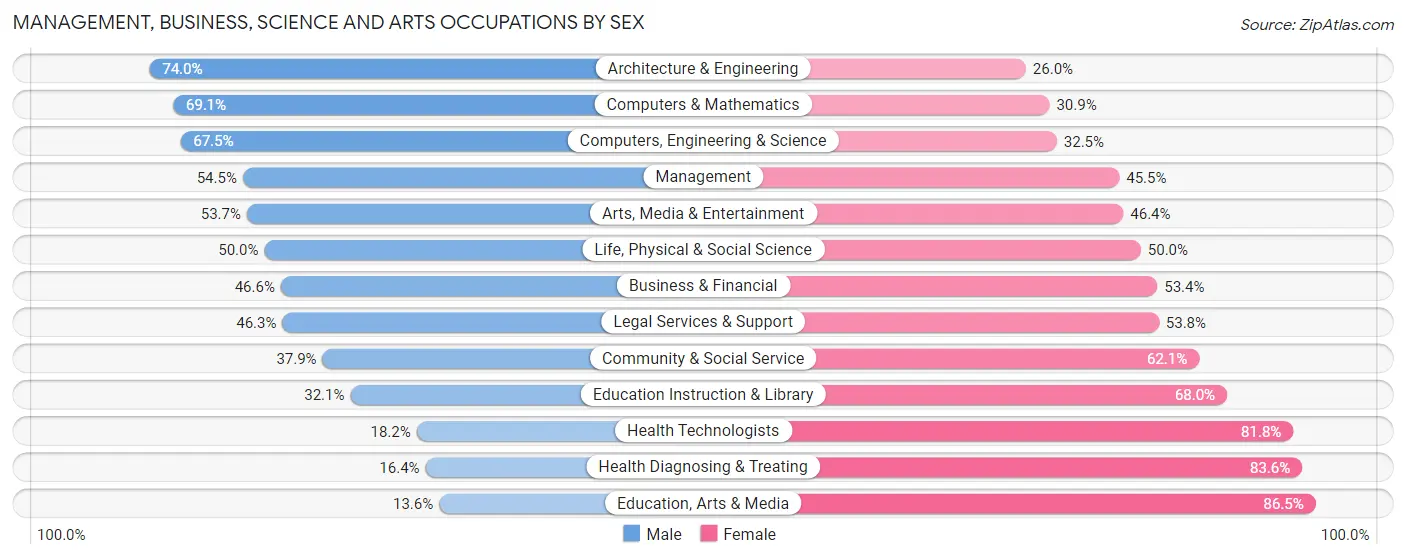
| Occupation | Male | Female |
| Management | 741 (54.5%) | 619 (45.5%) |
| Business & Financial | 265 (46.6%) | 304 (53.4%) |
| Computers, Engineering & Science | 555 (67.5%) | 267 (32.5%) |
| Computers & Mathematics | 288 (69.1%) | 129 (30.9%) |
| Architecture & Engineering | 199 (74.0%) | 70 (26.0%) |
| Life, Physical & Social Science | 68 (50.0%) | 68 (50.0%) |
| Community & Social Service | 635 (37.9%) | 1,042 (62.1%) |
| Education, Arts & Media | 21 (13.6%) | 134 (86.5%) |
| Legal Services & Support | 74 (46.3%) | 86 (53.7%) |
| Education Instruction & Library | 283 (32.1%) | 600 (67.9%) |
| Arts, Media & Entertainment | 257 (53.6%) | 222 (46.4%) |
| Health Diagnosing & Treating | 119 (16.4%) | 607 (83.6%) |
| Health Technologists | 110 (18.2%) | 493 (81.8%) |
| Total (Category) | 2,315 (44.9%) | 2,839 (55.1%) |
| Total (Overall) | 5,492 (48.0%) | 5,960 (52.0%) |
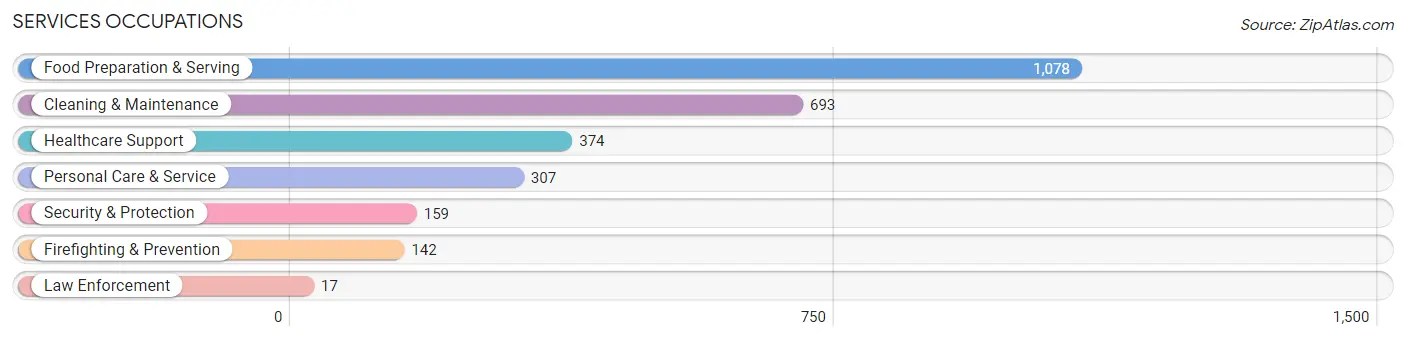
Services Occupations
The most common Services occupations in Newport are Food Preparation & Serving (1,078 | 9.4%), Cleaning & Maintenance (693 | 6.0%), Healthcare Support (374 | 3.3%), Personal Care & Service (307 | 2.7%), and Security & Protection (159 | 1.4%).
Services Occupations by Sex
Within the Services occupations in Newport, the most male-oriented occupations are Security & Protection (100.0%), Firefighting & Prevention (100.0%), and Law Enforcement (100.0%), while the most female-oriented occupations are Healthcare Support (89.3%), Personal Care & Service (56.0%), and Food Preparation & Serving (48.0%).
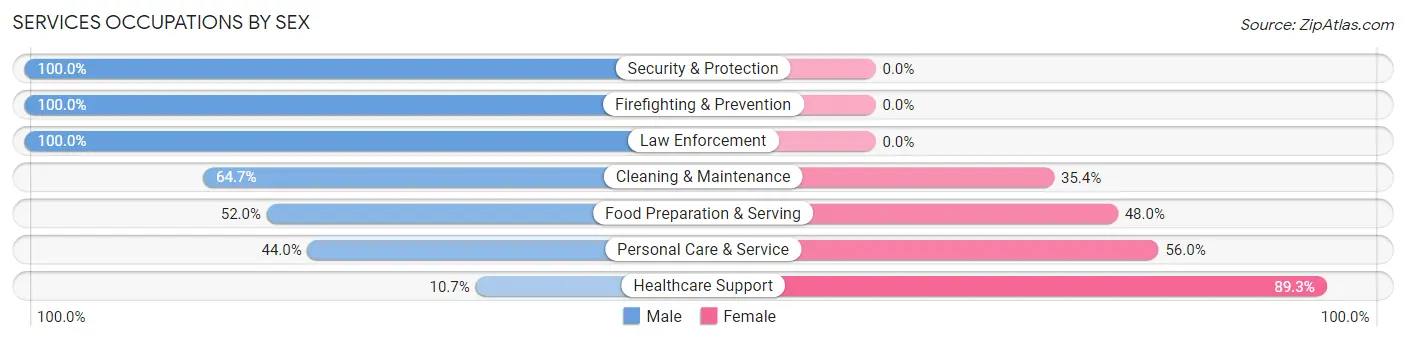
| Occupation | Male | Female |
| Healthcare Support | 40 (10.7%) | 334 (89.3%) |
| Security & Protection | 159 (100.0%) | 0 (0.0%) |
| Firefighting & Prevention | 142 (100.0%) | 0 (0.0%) |
| Law Enforcement | 17 (100.0%) | 0 (0.0%) |
| Food Preparation & Serving | 561 (52.0%) | 517 (48.0%) |
| Cleaning & Maintenance | 448 (64.6%) | 245 (35.3%) |
| Personal Care & Service | 135 (44.0%) | 172 (56.0%) |
| Total (Category) | 1,343 (51.4%) | 1,268 (48.6%) |
| Total (Overall) | 5,492 (48.0%) | 5,960 (52.0%) |
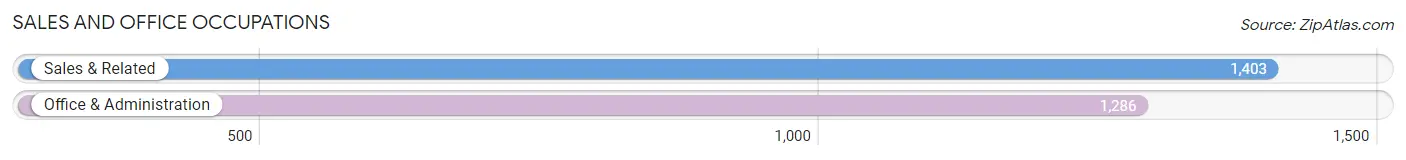
Sales and Office Occupations
The most common Sales and Office occupations in Newport are Sales & Related (1,403 | 12.2%), and Office & Administration (1,286 | 11.2%).
Sales and Office Occupations by Sex
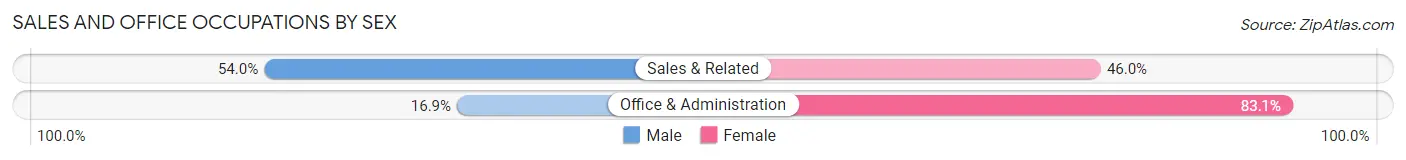
| Occupation | Male | Female |
| Sales & Related | 757 (54.0%) | 646 (46.0%) |
| Office & Administration | 217 (16.9%) | 1,069 (83.1%) |
| Total (Category) | 974 (36.2%) | 1,715 (63.8%) |
| Total (Overall) | 5,492 (48.0%) | 5,960 (52.0%) |
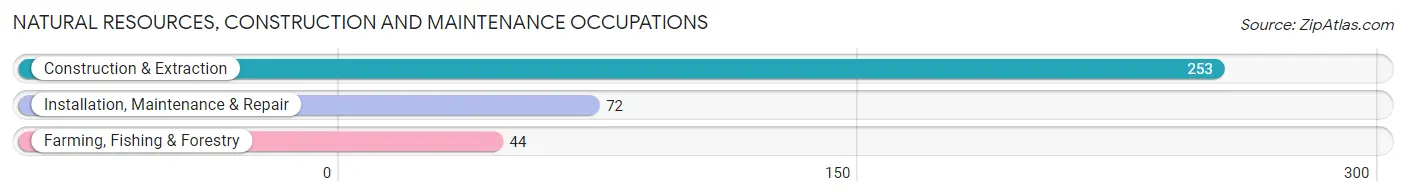
Natural Resources, Construction and Maintenance Occupations
The most common Natural Resources, Construction and Maintenance occupations in Newport are Construction & Extraction (253 | 2.2%), Installation, Maintenance & Repair (72 | 0.6%), and Farming, Fishing & Forestry (44 | 0.4%).
Natural Resources, Construction and Maintenance Occupations by Sex
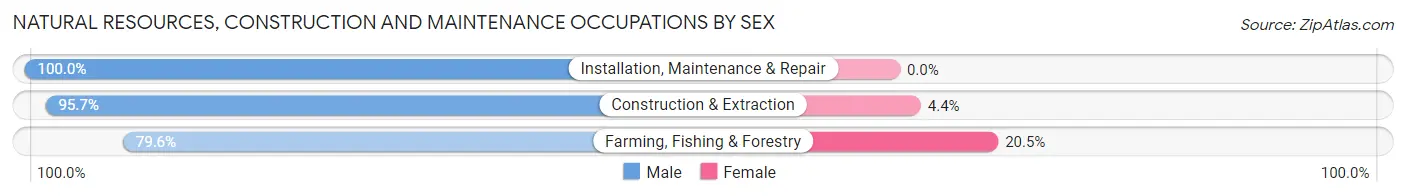
| Occupation | Male | Female |
| Farming, Fishing & Forestry | 35 (79.5%) | 9 (20.4%) |
| Construction & Extraction | 242 (95.7%) | 11 (4.3%) |
| Installation, Maintenance & Repair | 72 (100.0%) | 0 (0.0%) |
| Total (Category) | 349 (94.6%) | 20 (5.4%) |
| Total (Overall) | 5,492 (48.0%) | 5,960 (52.0%) |
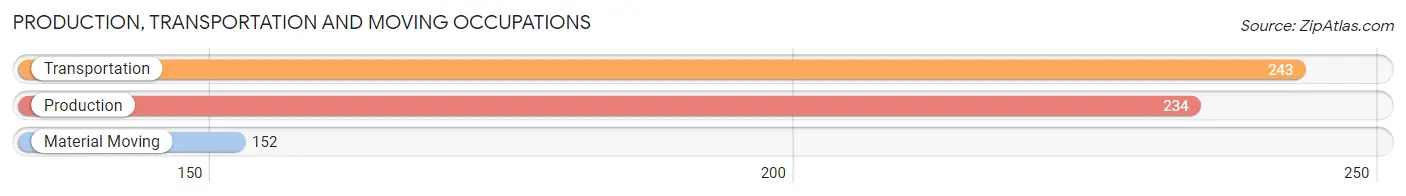
Production, Transportation and Moving Occupations
The most common Production, Transportation and Moving occupations in Newport are Transportation (243 | 2.1%), Production (234 | 2.0%), and Material Moving (152 | 1.3%).
Production, Transportation and Moving Occupations by Sex
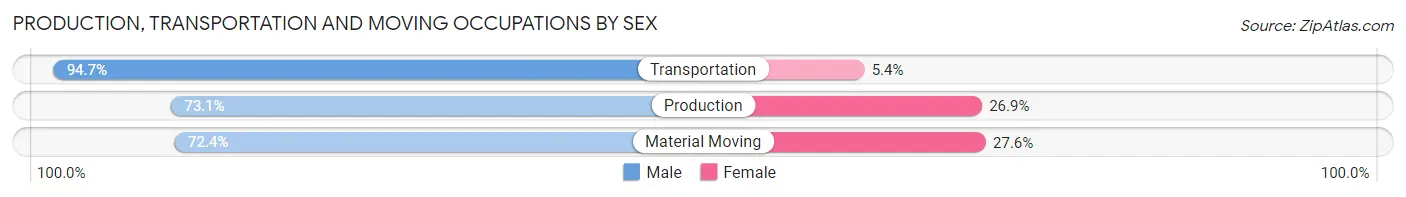
| Occupation | Male | Female |
| Production | 171 (73.1%) | 63 (26.9%) |
| Transportation | 230 (94.7%) | 13 (5.3%) |
| Material Moving | 110 (72.4%) | 42 (27.6%) |
| Total (Category) | 511 (81.2%) | 118 (18.8%) |
| Total (Overall) | 5,492 (48.0%) | 5,960 (52.0%) |
Employment Industries by Sex in Newport
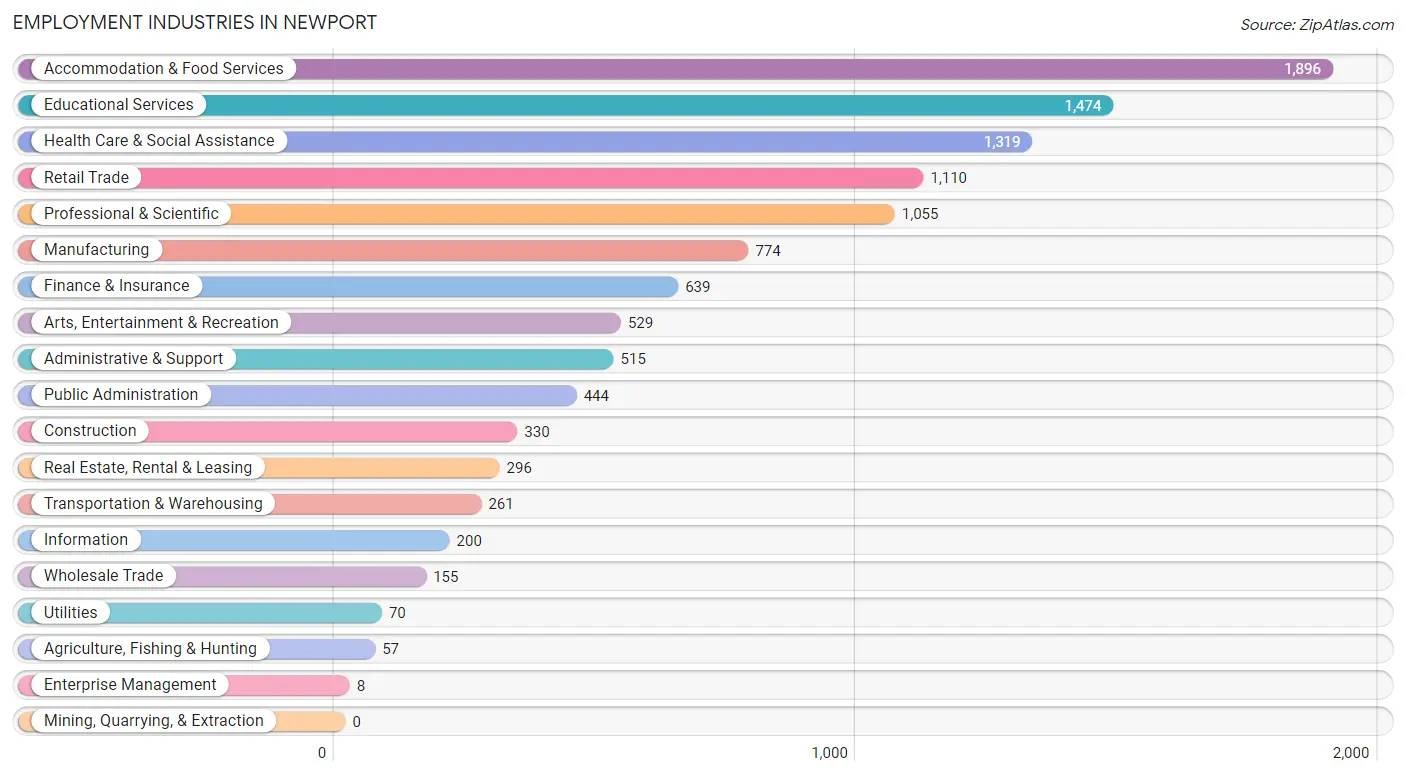
Employment Industries in Newport
The major employment industries in Newport include Accommodation & Food Services (1,896 | 16.6%), Educational Services (1,474 | 12.9%), Health Care & Social Assistance (1,319 | 11.5%), Retail Trade (1,110 | 9.7%), and Professional & Scientific (1,055 | 9.2%).
Employment Industries by Sex in Newport
The Newport industries that see more men than women are Utilities (100.0%), Construction (84.6%), and Wholesale Trade (79.3%), whereas the industries that tend to have a higher number of women are Enterprise Management (100.0%), Health Care & Social Assistance (82.0%), and Educational Services (64.0%).
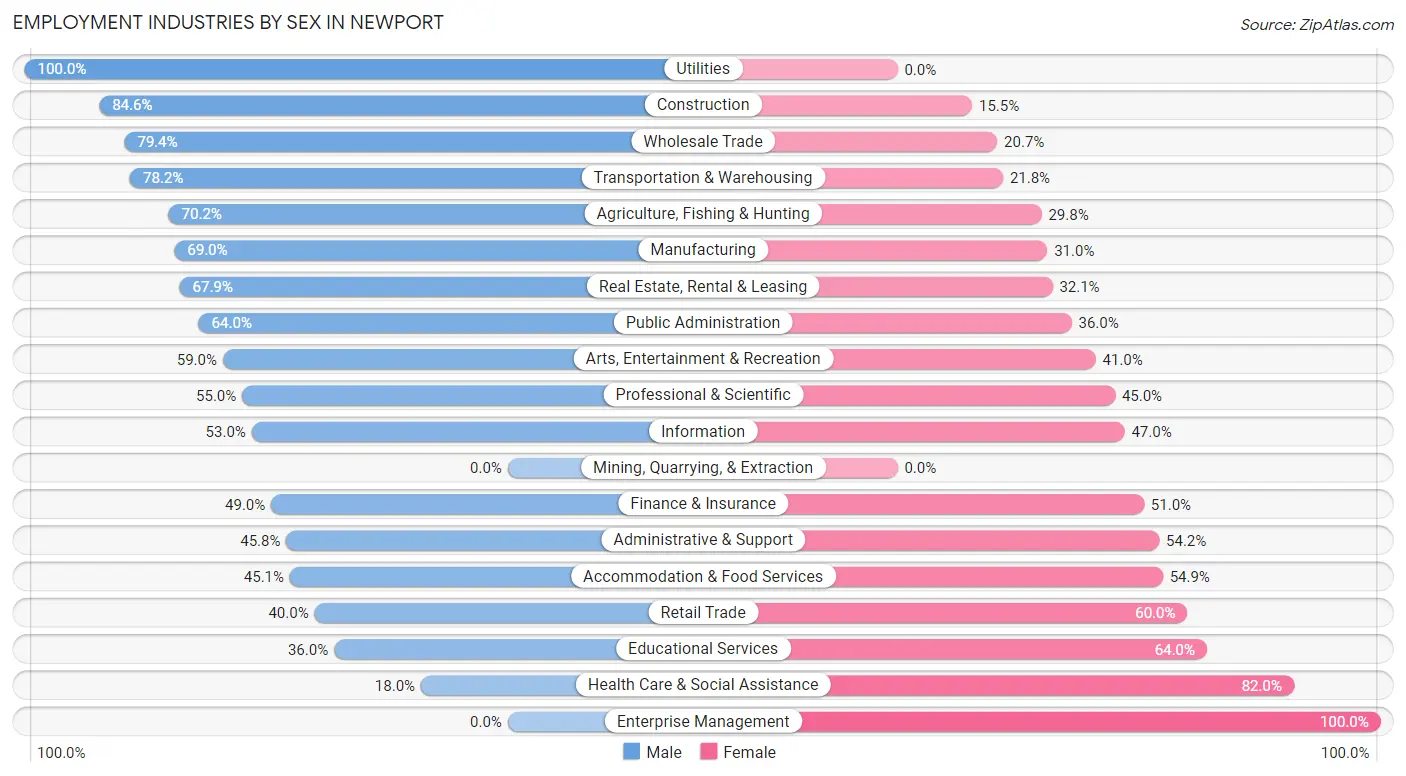
| Industry | Male | Female |
| Agriculture, Fishing & Hunting | 40 (70.2%) | 17 (29.8%) |
| Mining, Quarrying, & Extraction | 0 (0.0%) | 0 (0.0%) |
| Construction | 279 (84.6%) | 51 (15.4%) |
| Manufacturing | 534 (69.0%) | 240 (31.0%) |
| Wholesale Trade | 123 (79.3%) | 32 (20.6%) |
| Retail Trade | 444 (40.0%) | 666 (60.0%) |
| Transportation & Warehousing | 204 (78.2%) | 57 (21.8%) |
| Utilities | 70 (100.0%) | 0 (0.0%) |
| Information | 106 (53.0%) | 94 (47.0%) |
| Finance & Insurance | 313 (49.0%) | 326 (51.0%) |
| Real Estate, Rental & Leasing | 201 (67.9%) | 95 (32.1%) |
| Professional & Scientific | 580 (55.0%) | 475 (45.0%) |
| Enterprise Management | 0 (0.0%) | 8 (100.0%) |
| Administrative & Support | 236 (45.8%) | 279 (54.2%) |
| Educational Services | 530 (36.0%) | 944 (64.0%) |
| Health Care & Social Assistance | 237 (18.0%) | 1,082 (82.0%) |
| Arts, Entertainment & Recreation | 312 (59.0%) | 217 (41.0%) |
| Accommodation & Food Services | 855 (45.1%) | 1,041 (54.9%) |
| Public Administration | 284 (64.0%) | 160 (36.0%) |
| Total | 5,492 (48.0%) | 5,960 (52.0%) |
Education in Newport
School Enrollment in Newport
The most common levels of schooling among the 6,402 students in Newport are college / undergraduate (2,915 | 45.5%), middle school (1,009 | 15.8%), and high school (829 | 13.0%).
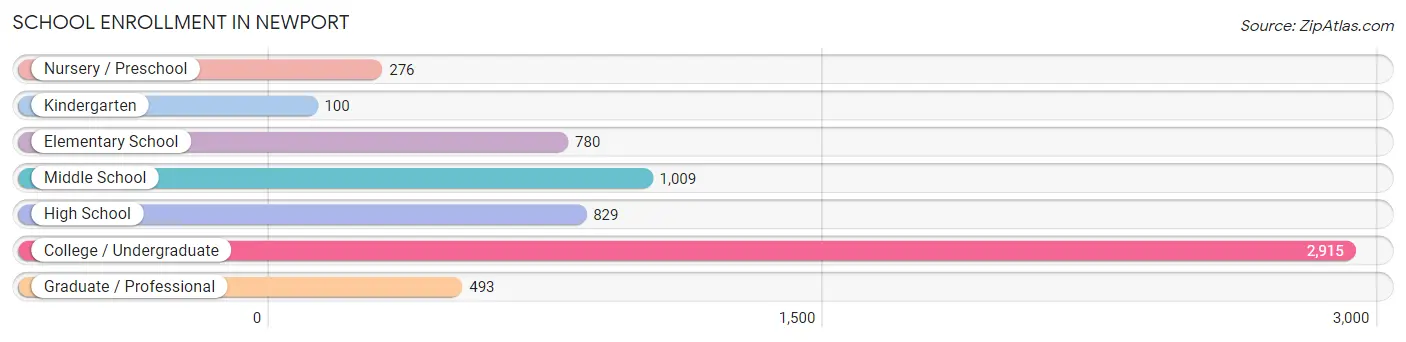
| School Level | # Students | % Students |
| Nursery / Preschool | 276 | 4.3% |
| Kindergarten | 100 | 1.6% |
| Elementary School | 780 | 12.2% |
| Middle School | 1,009 | 15.8% |
| High School | 829 | 13.0% |
| College / Undergraduate | 2,915 | 45.5% |
| Graduate / Professional | 493 | 7.7% |
| Total | 6,402 | 100.0% |
School Enrollment by Age by Funding Source in Newport
Out of a total of 6,402 students who are enrolled in schools in Newport, 2,785 (43.5%) attend a private institution, while the remaining 3,617 (56.5%) are enrolled in public schools. The age group of 18 to 19 year olds has the highest likelihood of being enrolled in private schools, with 1,007 (78.1% in the age bracket) enrolled. Conversely, the age group of 15 to 17 year olds has the lowest likelihood of being enrolled in a private school, with 570 (82.0% in the age bracket) attending a public institution.
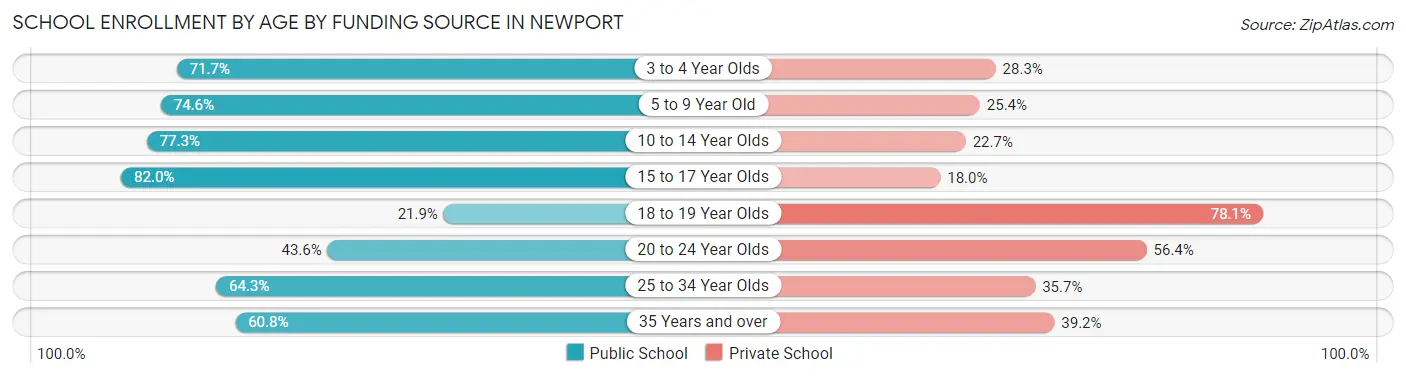
| Age Bracket | Public School | Private School |
| 3 to 4 Year Olds | 157 (71.7%) | 62 (28.3%) |
| 5 to 9 Year Old | 553 (74.6%) | 188 (25.4%) |
| 10 to 14 Year Olds | 887 (77.3%) | 261 (22.7%) |
| 15 to 17 Year Olds | 570 (82.0%) | 125 (18.0%) |
| 18 to 19 Year Olds | 283 (21.9%) | 1,007 (78.1%) |
| 20 to 24 Year Olds | 630 (43.6%) | 816 (56.4%) |
| 25 to 34 Year Olds | 283 (64.3%) | 157 (35.7%) |
| 35 Years and over | 257 (60.8%) | 166 (39.2%) |
| Total | 3,617 (56.5%) | 2,785 (43.5%) |
Educational Attainment by Field of Study in Newport
Business (1,621 | 16.2%), social sciences (1,140 | 11.4%), literature & languages (931 | 9.3%), science & technology (896 | 8.9%), and engineering (850 | 8.5%) are the most common fields of study among 10,029 individuals in Newport who have obtained a bachelor's degree or higher.
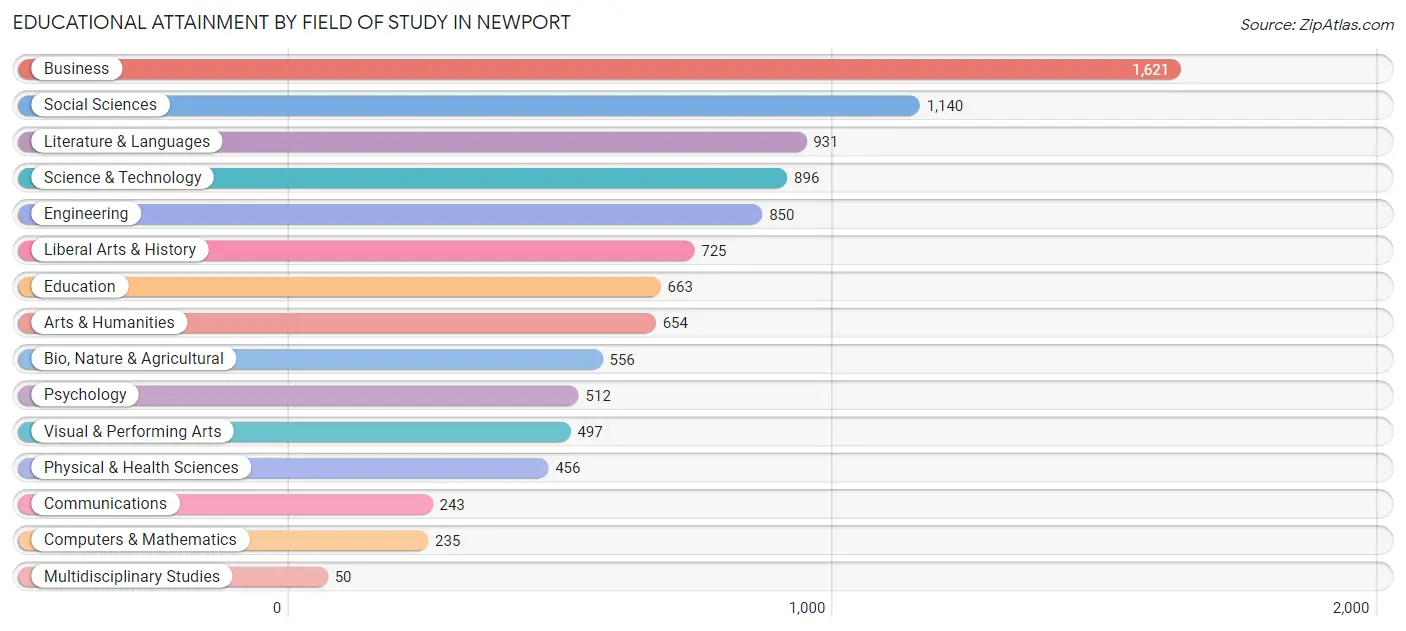
| Field of Study | # Graduates | % Graduates |
| Computers & Mathematics | 235 | 2.3% |
| Bio, Nature & Agricultural | 556 | 5.5% |
| Physical & Health Sciences | 456 | 4.5% |
| Psychology | 512 | 5.1% |
| Social Sciences | 1,140 | 11.4% |
| Engineering | 850 | 8.5% |
| Multidisciplinary Studies | 50 | 0.5% |
| Science & Technology | 896 | 8.9% |
| Business | 1,621 | 16.2% |
| Education | 663 | 6.6% |
| Literature & Languages | 931 | 9.3% |
| Liberal Arts & History | 725 | 7.2% |
| Visual & Performing Arts | 497 | 5.0% |
| Communications | 243 | 2.4% |
| Arts & Humanities | 654 | 6.5% |
| Total | 10,029 | 100.0% |
Transportation & Commute in Newport
Vehicle Availability by Sex in Newport
The most prevalent vehicle ownership categories in Newport are males with 2 vehicles (2,556, accounting for 45.3%) and females with 2 vehicles (2,044, making up 46.3%).
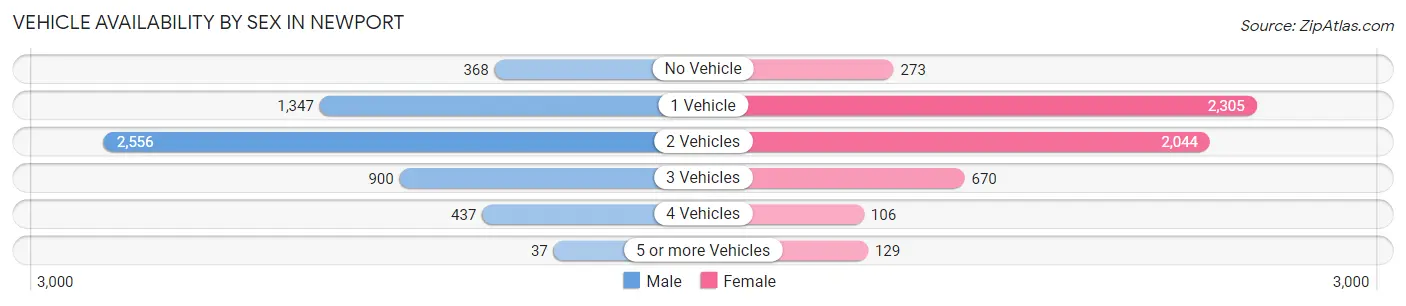
| Vehicles Available | Male | Female |
| No Vehicle | 368 (6.5%) | 273 (4.9%) |
| 1 Vehicle | 1,347 (23.9%) | 2,305 (41.7%) |
| 2 Vehicles | 2,556 (45.3%) | 2,044 (37.0%) |
| 3 Vehicles | 900 (15.9%) | 670 (12.1%) |
| 4 Vehicles | 437 (7.7%) | 106 (1.9%) |
| 5 or more Vehicles | 37 (0.7%) | 129 (2.3%) |
| Total | 5,645 (100.0%) | 5,527 (100.0%) |
Commute Time in Newport
The most frequently occuring commute durations in Newport are 10 to 14 minutes (2,622 commuters, 24.5%), 5 to 9 minutes (2,086 commuters, 19.5%), and 15 to 19 minutes (1,572 commuters, 14.7%).
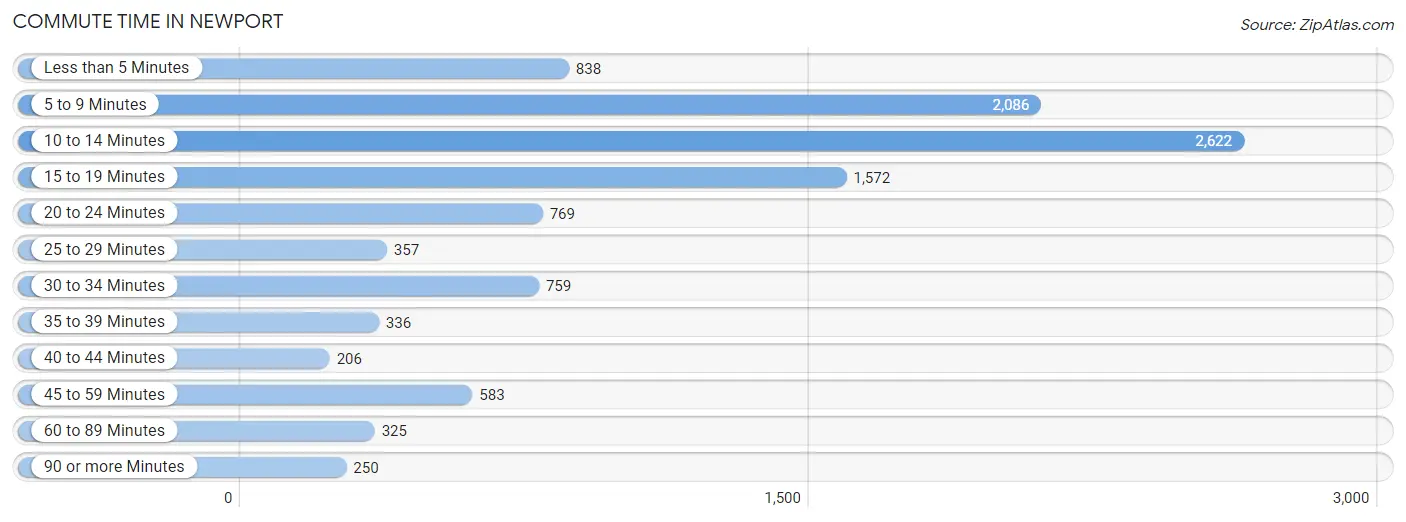
| Commute Time | # Commuters | % Commuters |
| Less than 5 Minutes | 838 | 7.8% |
| 5 to 9 Minutes | 2,086 | 19.5% |
| 10 to 14 Minutes | 2,622 | 24.5% |
| 15 to 19 Minutes | 1,572 | 14.7% |
| 20 to 24 Minutes | 769 | 7.2% |
| 25 to 29 Minutes | 357 | 3.3% |
| 30 to 34 Minutes | 759 | 7.1% |
| 35 to 39 Minutes | 336 | 3.1% |
| 40 to 44 Minutes | 206 | 1.9% |
| 45 to 59 Minutes | 583 | 5.4% |
| 60 to 89 Minutes | 325 | 3.0% |
| 90 or more Minutes | 250 | 2.3% |
Commute Time by Sex in Newport
The most common commute times in Newport are 10 to 14 minutes (1,362 commuters, 24.5%) for males and 10 to 14 minutes (1,260 commuters, 24.5%) for females.
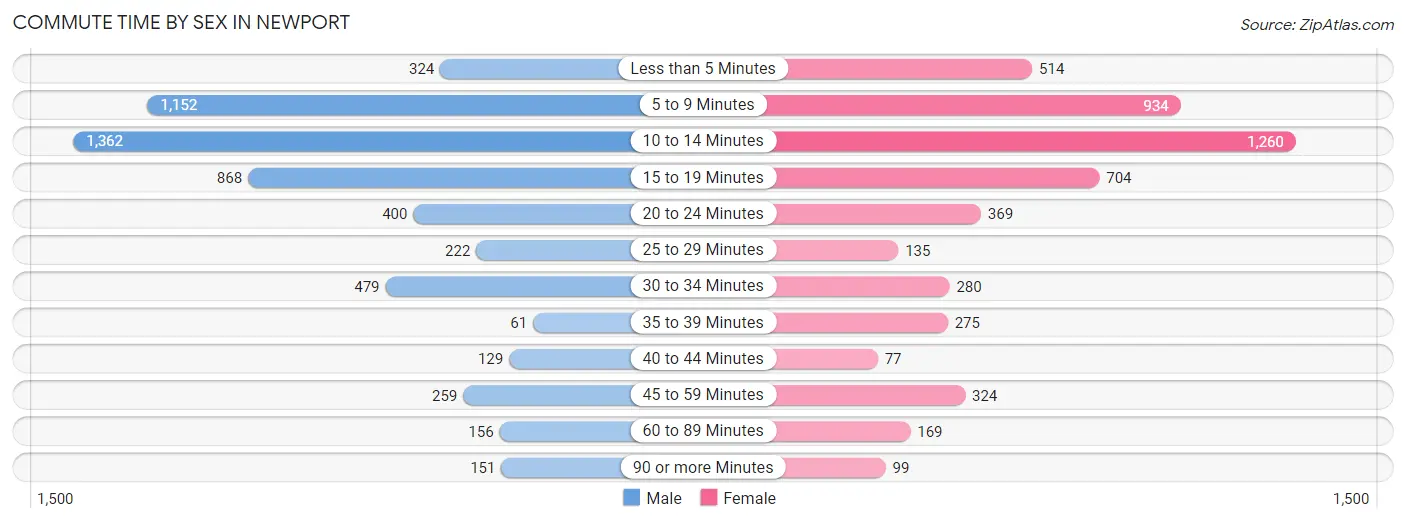
| Commute Time | Male | Female |
| Less than 5 Minutes | 324 (5.8%) | 514 (10.0%) |
| 5 to 9 Minutes | 1,152 (20.7%) | 934 (18.2%) |
| 10 to 14 Minutes | 1,362 (24.5%) | 1,260 (24.5%) |
| 15 to 19 Minutes | 868 (15.6%) | 704 (13.7%) |
| 20 to 24 Minutes | 400 (7.2%) | 369 (7.2%) |
| 25 to 29 Minutes | 222 (4.0%) | 135 (2.6%) |
| 30 to 34 Minutes | 479 (8.6%) | 280 (5.4%) |
| 35 to 39 Minutes | 61 (1.1%) | 275 (5.3%) |
| 40 to 44 Minutes | 129 (2.3%) | 77 (1.5%) |
| 45 to 59 Minutes | 259 (4.7%) | 324 (6.3%) |
| 60 to 89 Minutes | 156 (2.8%) | 169 (3.3%) |
| 90 or more Minutes | 151 (2.7%) | 99 (1.9%) |
Time of Departure to Work by Sex in Newport
The most frequent times of departure to work in Newport are 7:30 AM to 7:59 AM (947, 17.0%) for males and 8:00 AM to 8:29 AM (916, 17.8%) for females.
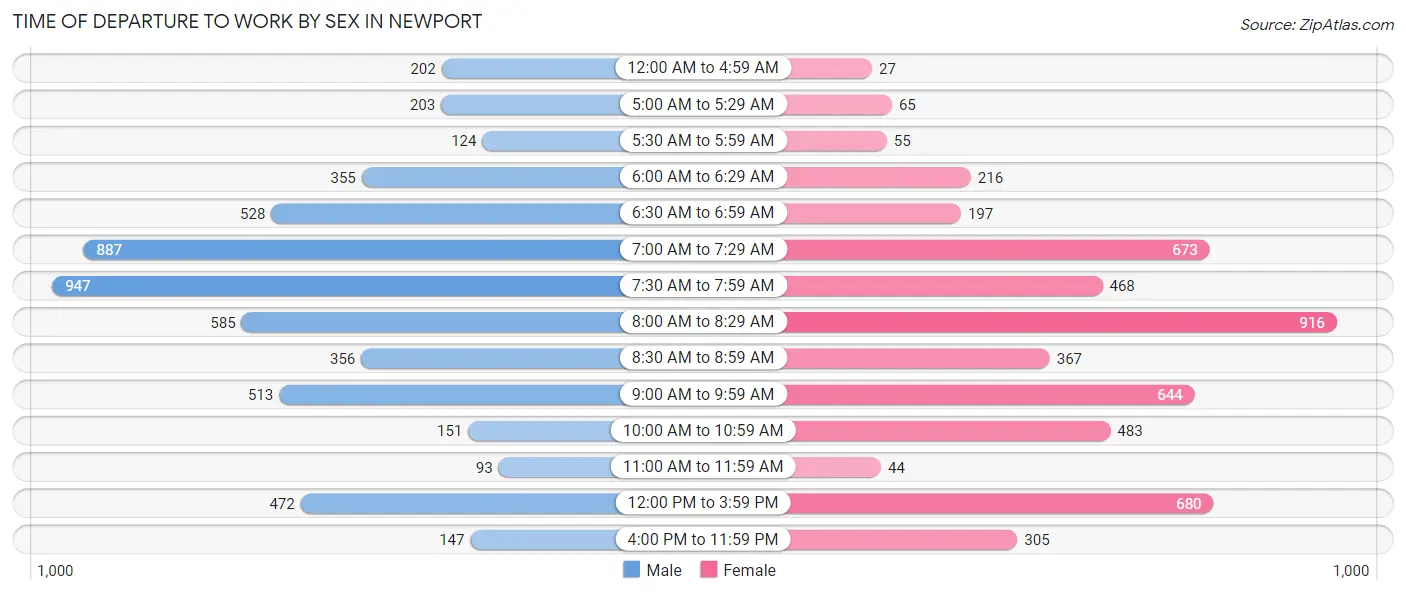
| Time of Departure | Male | Female |
| 12:00 AM to 4:59 AM | 202 (3.6%) | 27 (0.5%) |
| 5:00 AM to 5:29 AM | 203 (3.6%) | 65 (1.3%) |
| 5:30 AM to 5:59 AM | 124 (2.2%) | 55 (1.1%) |
| 6:00 AM to 6:29 AM | 355 (6.4%) | 216 (4.2%) |
| 6:30 AM to 6:59 AM | 528 (9.5%) | 197 (3.8%) |
| 7:00 AM to 7:29 AM | 887 (15.9%) | 673 (13.1%) |
| 7:30 AM to 7:59 AM | 947 (17.0%) | 468 (9.1%) |
| 8:00 AM to 8:29 AM | 585 (10.5%) | 916 (17.8%) |
| 8:30 AM to 8:59 AM | 356 (6.4%) | 367 (7.1%) |
| 9:00 AM to 9:59 AM | 513 (9.2%) | 644 (12.5%) |
| 10:00 AM to 10:59 AM | 151 (2.7%) | 483 (9.4%) |
| 11:00 AM to 11:59 AM | 93 (1.7%) | 44 (0.9%) |
| 12:00 PM to 3:59 PM | 472 (8.5%) | 680 (13.2%) |
| 4:00 PM to 11:59 PM | 147 (2.6%) | 305 (5.9%) |
| Total | 5,563 (100.0%) | 5,140 (100.0%) |
Housing Occupancy in Newport
Occupancy by Ownership in Newport
Of the total 10,645 dwellings in Newport, owner-occupied units account for 5,050 (47.4%), while renter-occupied units make up 5,595 (52.6%).
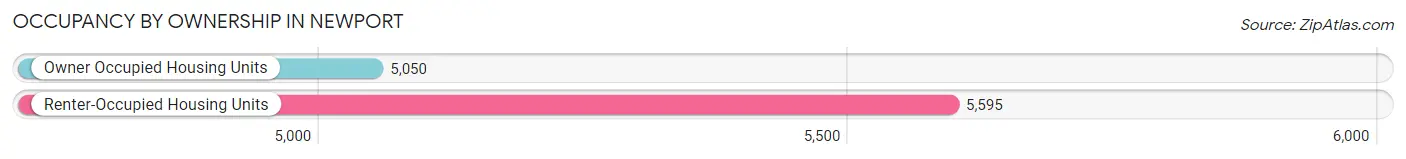
| Occupancy | # Housing Units | % Housing Units |
| Owner Occupied Housing Units | 5,050 | 47.4% |
| Renter-Occupied Housing Units | 5,595 | 52.6% |
| Total Occupied Housing Units | 10,645 | 100.0% |
Occupancy by Household Size in Newport
| Household Size | # Housing Units | % Housing Units |
| 1-Person Household | 4,246 | 39.9% |
| 2-Person Household | 3,837 | 36.0% |
| 3-Person Household | 1,393 | 13.1% |
| 4+ Person Household | 1,169 | 11.0% |
| Total Housing Units | 10,645 | 100.0% |
Occupancy by Ownership by Household Size in Newport
| Household Size | Owner-occupied | Renter-occupied |
| 1-Person Household | 1,640 (38.6%) | 2,606 (61.4%) |
| 2-Person Household | 2,206 (57.5%) | 1,631 (42.5%) |
| 3-Person Household | 517 (37.1%) | 876 (62.9%) |
| 4+ Person Household | 687 (58.8%) | 482 (41.2%) |
| Total Housing Units | 5,050 (47.4%) | 5,595 (52.6%) |
Occupancy by Educational Attainment in Newport
| Household Size | Owner-occupied | Renter-occupied |
| Less than High School | 114 (19.2%) | 481 (80.8%) |
| High School Diploma | 610 (30.1%) | 1,414 (69.9%) |
| College/Associate Degree | 875 (37.1%) | 1,481 (62.9%) |
| Bachelor's Degree or higher | 3,451 (60.9%) | 2,219 (39.1%) |
Occupancy by Age of Householder in Newport
| Age Bracket | # Households | % Households |
| Under 35 Years | 2,421 | 22.7% |
| 35 to 44 Years | 1,611 | 15.1% |
| 45 to 54 Years | 1,573 | 14.8% |
| 55 to 64 Years | 1,619 | 15.2% |
| 65 to 74 Years | 1,760 | 16.5% |
| 75 to 84 Years | 1,153 | 10.8% |
| 85 Years and Over | 508 | 4.8% |
| Total | 10,645 | 100.0% |
Housing Finances in Newport
Median Income by Occupancy in Newport
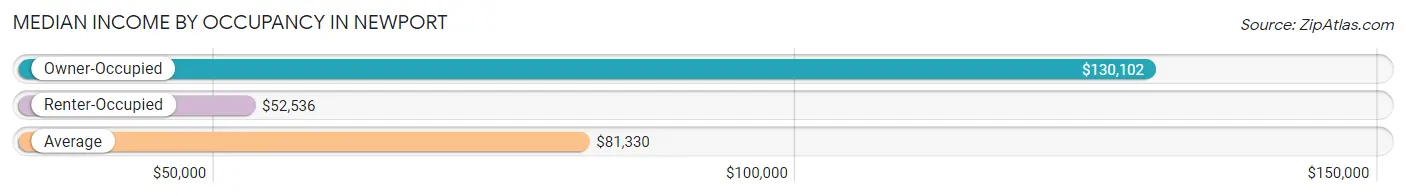
| Occupancy Type | # Households | Median Income |
| Owner-Occupied | 5,050 (47.4%) | $130,102 |
| Renter-Occupied | 5,595 (52.6%) | $52,536 |
| Average | 10,645 (100.0%) | $81,330 |
Occupancy by Householder Income Bracket in Newport
| Income Bracket | Owner-occupied | Renter-occupied |
| Less than $5,000 | 71 (1.4%) | 286 (5.1%) |
| $5,000 to $9,999 | 17 (0.3%) | 262 (4.7%) |
| $10,000 to $14,999 | 42 (0.8%) | 378 (6.8%) |
| $15,000 to $19,999 | 46 (0.9%) | 251 (4.5%) |
| $20,000 to $24,999 | 65 (1.3%) | 270 (4.8%) |
| $25,000 to $34,999 | 281 (5.6%) | 419 (7.5%) |
| $35,000 to $49,999 | 430 (8.5%) | 915 (16.4%) |
| $50,000 to $74,999 | 483 (9.6%) | 686 (12.3%) |
| $75,000 to $99,999 | 503 (10.0%) | 832 (14.9%) |
| $100,000 to $149,999 | 1,046 (20.7%) | 795 (14.2%) |
| $150,000 or more | 2,066 (40.9%) | 501 (8.9%) |
| Total | 5,050 (100.0%) | 5,595 (100.0%) |
Monthly Housing Cost Tiers in Newport
| Monthly Cost | Owner-occupied | Renter-occupied |
| Less than $300 | 69 (1.4%) | 626 (11.2%) |
| $300 to $499 | 89 (1.8%) | 308 (5.5%) |
| $500 to $799 | 393 (7.8%) | 391 (7.0%) |
| $800 to $999 | 418 (8.3%) | 432 (7.7%) |
| $1,000 to $1,499 | 969 (19.2%) | 902 (16.1%) |
| $1,500 to $1,999 | 546 (10.8%) | 1,321 (23.6%) |
| $2,000 to $2,499 | 613 (12.1%) | 901 (16.1%) |
| $2,500 to $2,999 | 630 (12.5%) | 315 (5.6%) |
| $3,000 or more | 1,323 (26.2%) | 263 (4.7%) |
| Total | 5,050 (100.0%) | 5,595 (100.0%) |
Physical Housing Characteristics in Newport
Housing Structures in Newport
| Structure Type | # Housing Units | % Housing Units |
| Single Unit, Detached | 4,099 | 38.5% |
| Single Unit, Attached | 567 | 5.3% |
| 2 Unit Apartments | 1,722 | 16.2% |
| 3 or 4 Unit Apartments | 2,227 | 20.9% |
| 5 to 9 Unit Apartments | 673 | 6.3% |
| 10 or more Apartments | 1,344 | 12.6% |
| Mobile Home / Other | 13 | 0.1% |
| Total | 10,645 | 100.0% |
Housing Structures by Occupancy in Newport
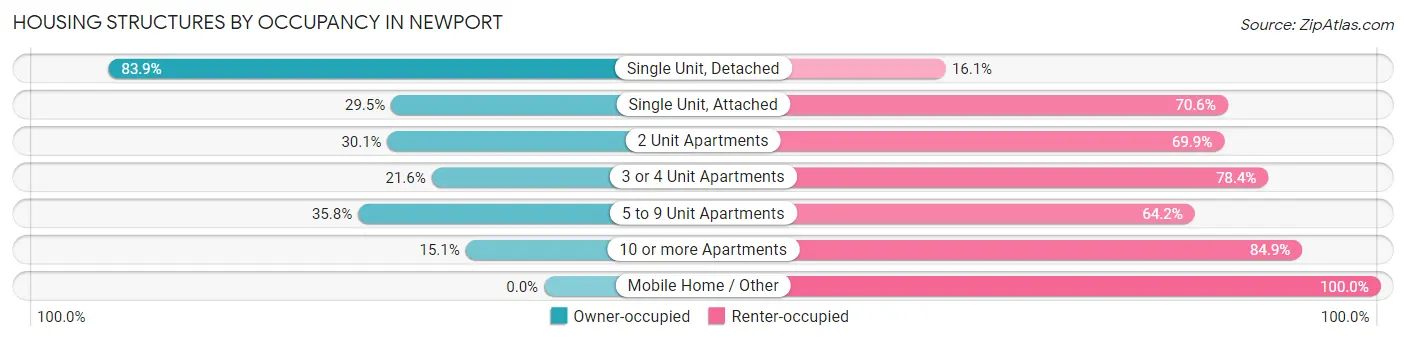
| Structure Type | Owner-occupied | Renter-occupied |
| Single Unit, Detached | 3,438 (83.9%) | 661 (16.1%) |
| Single Unit, Attached | 167 (29.4%) | 400 (70.6%) |
| 2 Unit Apartments | 519 (30.1%) | 1,203 (69.9%) |
| 3 or 4 Unit Apartments | 482 (21.6%) | 1,745 (78.4%) |
| 5 to 9 Unit Apartments | 241 (35.8%) | 432 (64.2%) |
| 10 or more Apartments | 203 (15.1%) | 1,141 (84.9%) |
| Mobile Home / Other | 0 (0.0%) | 13 (100.0%) |
| Total | 5,050 (47.4%) | 5,595 (52.6%) |
Housing Structures by Number of Rooms in Newport
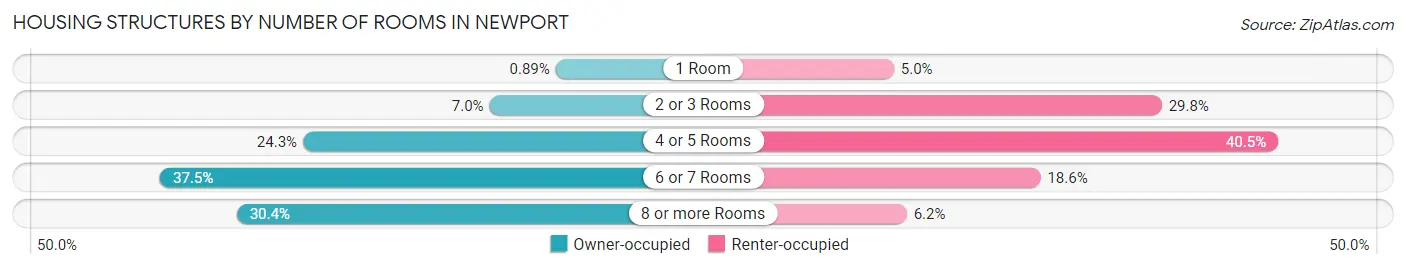
| Number of Rooms | Owner-occupied | Renter-occupied |
| 1 Room | 45 (0.9%) | 279 (5.0%) |
| 2 or 3 Rooms | 354 (7.0%) | 1,665 (29.8%) |
| 4 or 5 Rooms | 1,225 (24.3%) | 2,267 (40.5%) |
| 6 or 7 Rooms | 1,892 (37.5%) | 1,038 (18.5%) |
| 8 or more Rooms | 1,534 (30.4%) | 346 (6.2%) |
| Total | 5,050 (100.0%) | 5,595 (100.0%) |
Housing Structure by Heating Type in Newport
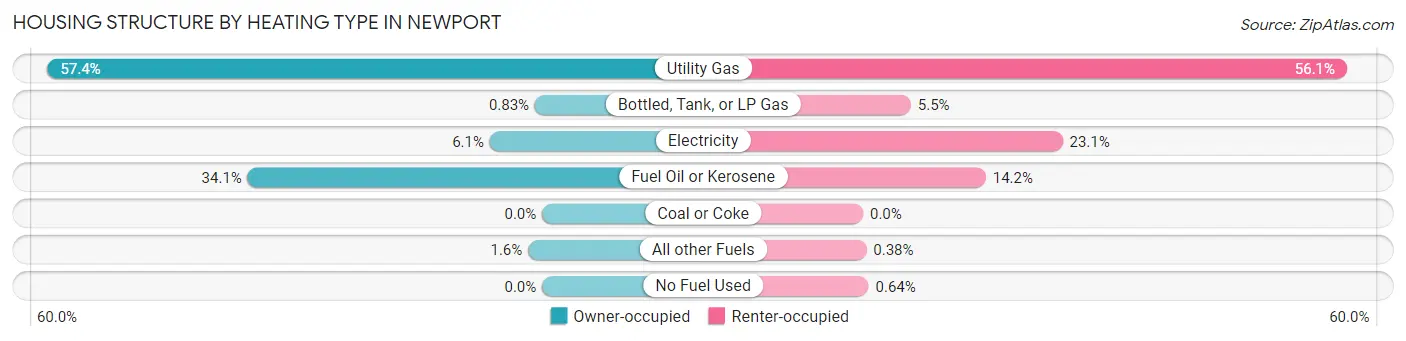
| Heating Type | Owner-occupied | Renter-occupied |
| Utility Gas | 2,896 (57.4%) | 3,138 (56.1%) |
| Bottled, Tank, or LP Gas | 42 (0.8%) | 310 (5.5%) |
| Electricity | 306 (6.1%) | 1,294 (23.1%) |
| Fuel Oil or Kerosene | 1,724 (34.1%) | 796 (14.2%) |
| Coal or Coke | 0 (0.0%) | 0 (0.0%) |
| All other Fuels | 82 (1.6%) | 21 (0.4%) |
| No Fuel Used | 0 (0.0%) | 36 (0.6%) |
| Total | 5,050 (100.0%) | 5,595 (100.0%) |
Household Vehicle Usage in Newport
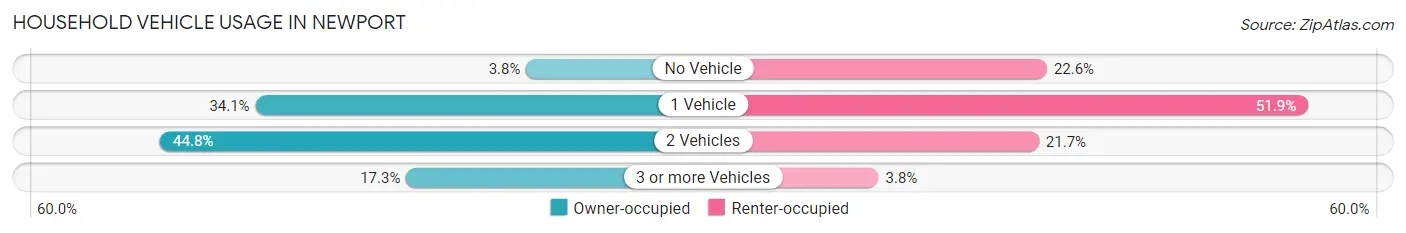
| Vehicles per Household | Owner-occupied | Renter-occupied |
| No Vehicle | 192 (3.8%) | 1,266 (22.6%) |
| 1 Vehicle | 1,724 (34.1%) | 2,902 (51.9%) |
| 2 Vehicles | 2,263 (44.8%) | 1,216 (21.7%) |
| 3 or more Vehicles | 871 (17.2%) | 211 (3.8%) |
| Total | 5,050 (100.0%) | 5,595 (100.0%) |
Real Estate & Mortgages in Newport
Real Estate and Mortgage Overview in Newport
| Characteristic | Without Mortgage | With Mortgage |
| Housing Units | 1,870 | 3,180 |
| Median Property Value | $626,300 | $621,400 |
| Median Household Income | $109,271 | $1,506 |
| Monthly Housing Costs | $1,045 | $1,227 |
| Real Estate Taxes | $5,293 | $21 |
Property Value by Mortgage Status in Newport
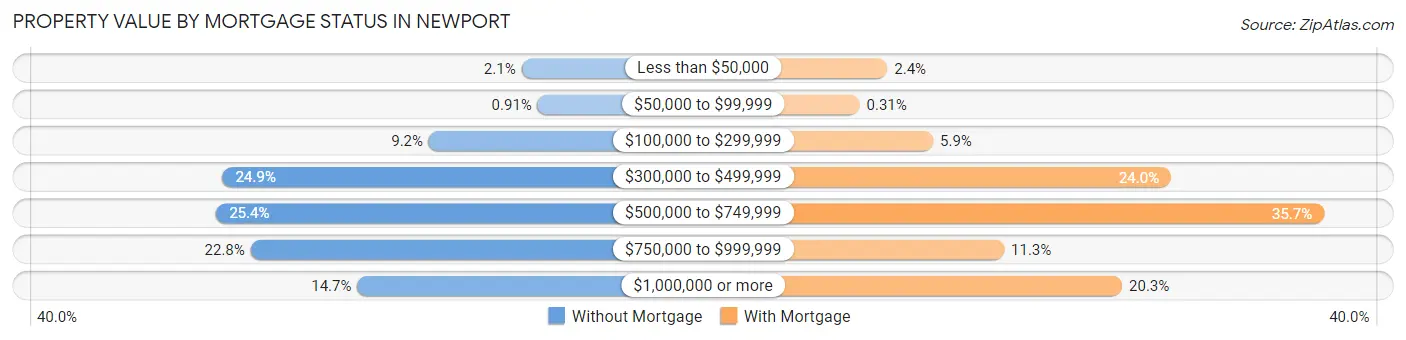
| Property Value | Without Mortgage | With Mortgage |
| Less than $50,000 | 40 (2.1%) | 77 (2.4%) |
| $50,000 to $99,999 | 17 (0.9%) | 10 (0.3%) |
| $100,000 to $299,999 | 172 (9.2%) | 188 (5.9%) |
| $300,000 to $499,999 | 466 (24.9%) | 764 (24.0%) |
| $500,000 to $749,999 | 475 (25.4%) | 1,135 (35.7%) |
| $750,000 to $999,999 | 426 (22.8%) | 360 (11.3%) |
| $1,000,000 or more | 274 (14.6%) | 646 (20.3%) |
| Total | 1,870 (100.0%) | 3,180 (100.0%) |
Household Income by Mortgage Status in Newport
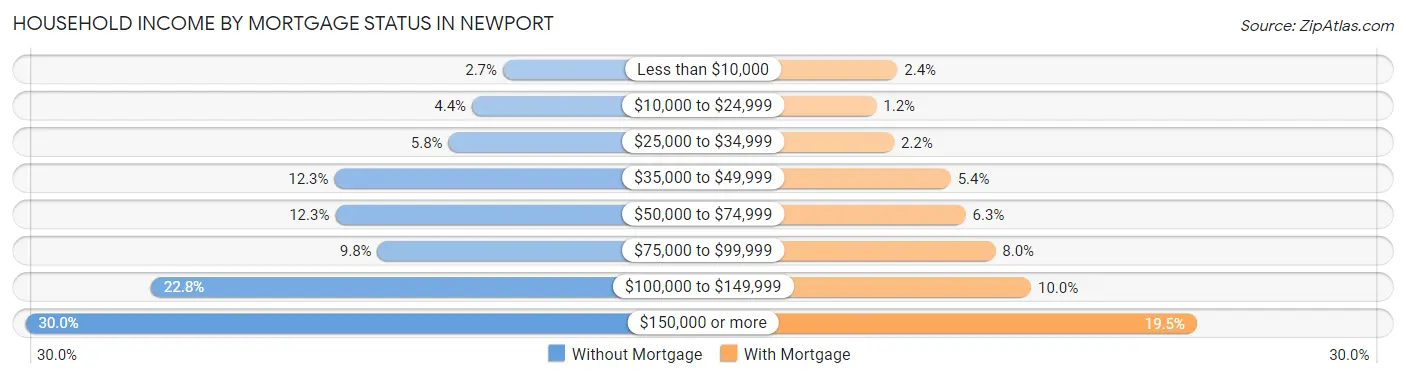
| Household Income | Without Mortgage | With Mortgage |
| Less than $10,000 | 50 (2.7%) | 76 (2.4%) |
| $10,000 to $24,999 | 83 (4.4%) | 38 (1.2%) |
| $25,000 to $34,999 | 108 (5.8%) | 70 (2.2%) |
| $35,000 to $49,999 | 230 (12.3%) | 173 (5.4%) |
| $50,000 to $74,999 | 229 (12.2%) | 200 (6.3%) |
| $75,000 to $99,999 | 184 (9.8%) | 254 (8.0%) |
| $100,000 to $149,999 | 426 (22.8%) | 319 (10.0%) |
| $150,000 or more | 560 (29.9%) | 620 (19.5%) |
| Total | 1,870 (100.0%) | 3,180 (100.0%) |
Property Value to Household Income Ratio in Newport
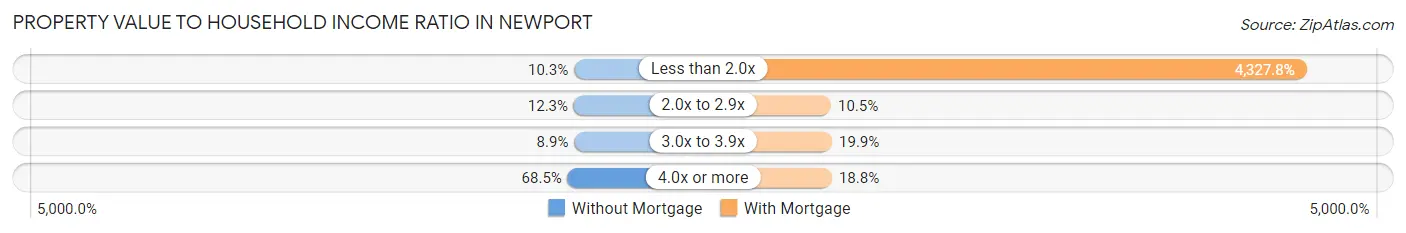
| Value-to-Income Ratio | Without Mortgage | With Mortgage |
| Less than 2.0x | 193 (10.3%) | 137,625 (4,327.8%) |
| 2.0x to 2.9x | 230 (12.3%) | 334 (10.5%) |
| 3.0x to 3.9x | 166 (8.9%) | 632 (19.9%) |
| 4.0x or more | 1,281 (68.5%) | 598 (18.8%) |
| Total | 1,870 (100.0%) | 3,180 (100.0%) |
Real Estate Taxes by Mortgage Status in Newport
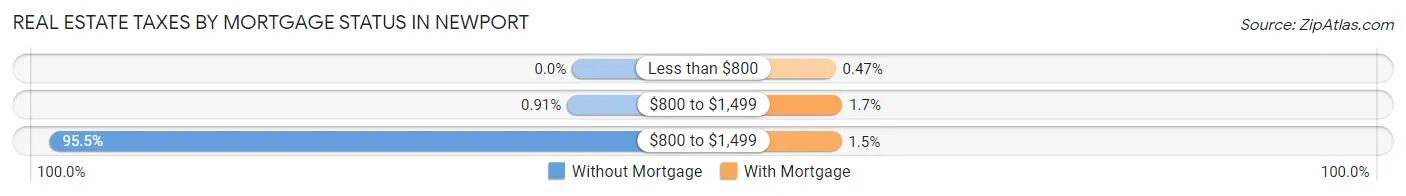
| Property Taxes | Without Mortgage | With Mortgage |
| Less than $800 | 0 (0.0%) | 15 (0.5%) |
| $800 to $1,499 | 17 (0.9%) | 53 (1.7%) |
| $800 to $1,499 | 1,785 (95.5%) | 49 (1.5%) |
| Total | 1,870 (100.0%) | 3,180 (100.0%) |
Health & Disability in Newport
Health Insurance Coverage by Age in Newport
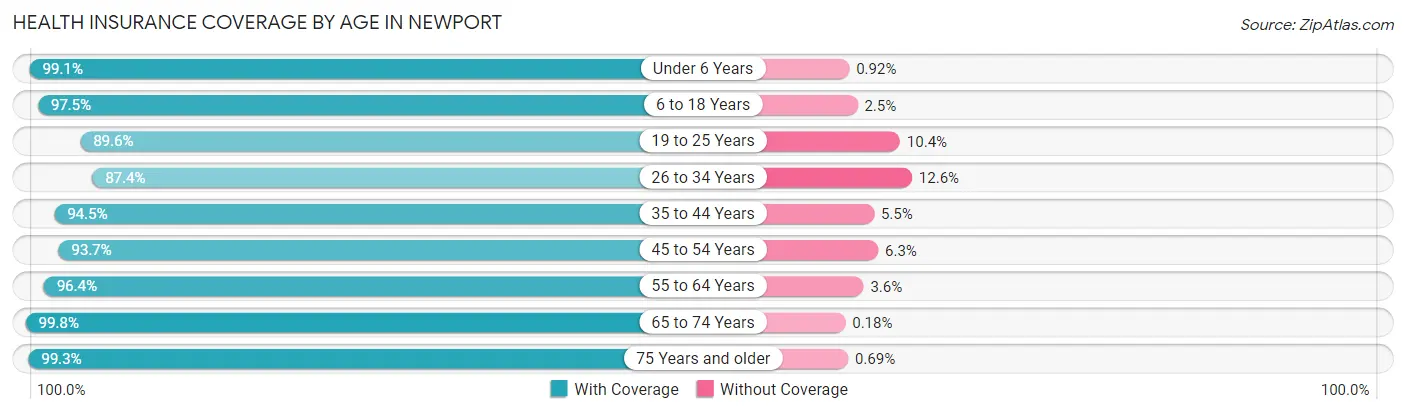
| Age Bracket | With Coverage | Without Coverage |
| Under 6 Years | 964 (99.1%) | 9 (0.9%) |
| 6 to 18 Years | 3,296 (97.5%) | 83 (2.5%) |
| 19 to 25 Years | 2,481 (89.6%) | 287 (10.4%) |
| 26 to 34 Years | 2,683 (87.4%) | 387 (12.6%) |
| 35 to 44 Years | 2,288 (94.5%) | 134 (5.5%) |
| 45 to 54 Years | 2,575 (93.7%) | 173 (6.3%) |
| 55 to 64 Years | 2,754 (96.4%) | 102 (3.6%) |
| 65 to 74 Years | 2,842 (99.8%) | 5 (0.2%) |
| 75 Years and older | 2,017 (99.3%) | 14 (0.7%) |
| Total | 21,900 (94.8%) | 1,194 (5.2%) |
Health Insurance Coverage by Citizenship Status in Newport
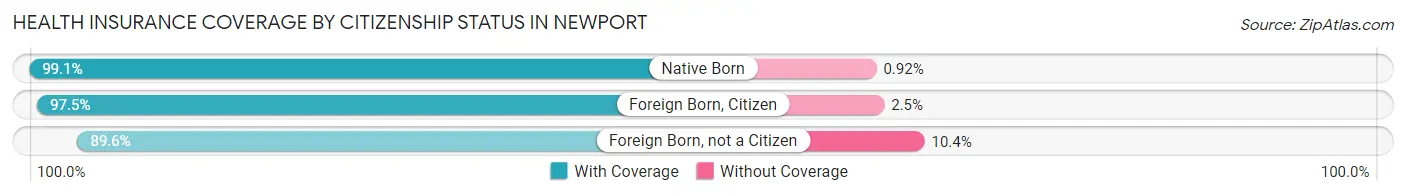
| Citizenship Status | With Coverage | Without Coverage |
| Native Born | 964 (99.1%) | 9 (0.9%) |
| Foreign Born, Citizen | 3,296 (97.5%) | 83 (2.5%) |
| Foreign Born, not a Citizen | 2,481 (89.6%) | 287 (10.4%) |
Health Insurance Coverage by Household Income in Newport
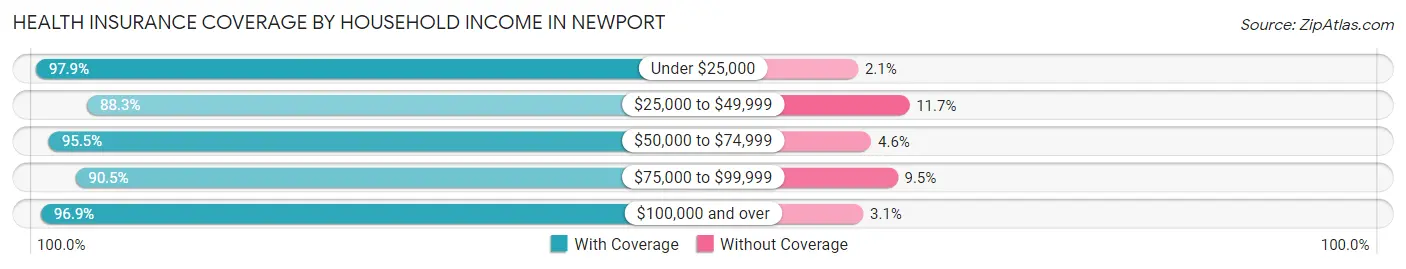
| Household Income | With Coverage | Without Coverage |
| Under $25,000 | 2,517 (97.9%) | 54 (2.1%) |
| $25,000 to $49,999 | 3,382 (88.3%) | 448 (11.7%) |
| $50,000 to $74,999 | 2,037 (95.5%) | 97 (4.5%) |
| $75,000 to $99,999 | 2,343 (90.5%) | 246 (9.5%) |
| $100,000 and over | 10,154 (96.9%) | 321 (3.1%) |
Public vs Private Health Insurance Coverage by Age in Newport
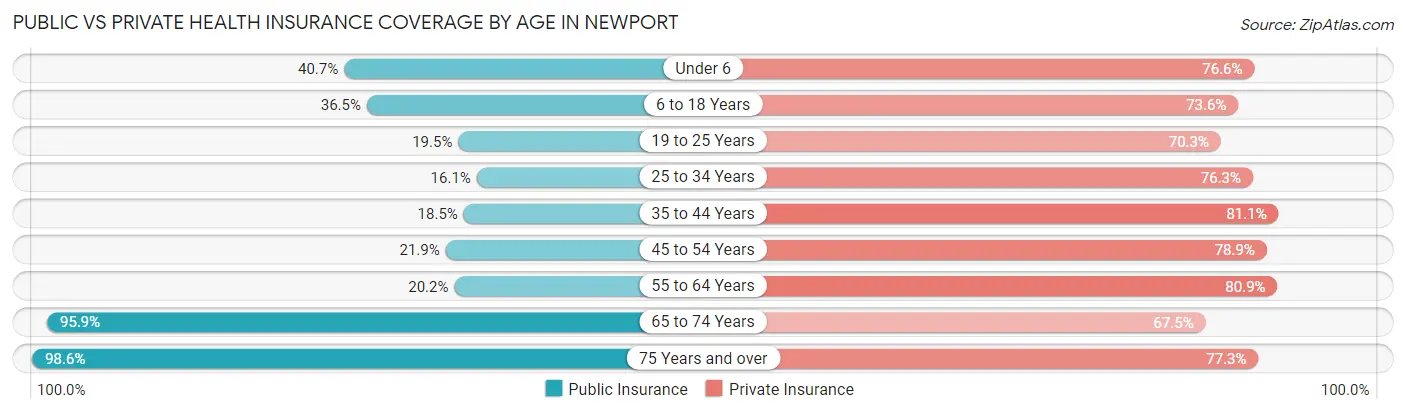
| Age Bracket | Public Insurance | Private Insurance |
| Under 6 | 396 (40.7%) | 745 (76.6%) |
| 6 to 18 Years | 1,233 (36.5%) | 2,486 (73.6%) |
| 19 to 25 Years | 540 (19.5%) | 1,947 (70.3%) |
| 25 to 34 Years | 494 (16.1%) | 2,342 (76.3%) |
| 35 to 44 Years | 448 (18.5%) | 1,963 (81.0%) |
| 45 to 54 Years | 601 (21.9%) | 2,167 (78.9%) |
| 55 to 64 Years | 578 (20.2%) | 2,309 (80.8%) |
| 65 to 74 Years | 2,729 (95.9%) | 1,922 (67.5%) |
| 75 Years and over | 2,003 (98.6%) | 1,570 (77.3%) |
| Total | 9,022 (39.1%) | 17,451 (75.6%) |
Disability Status by Sex by Age in Newport
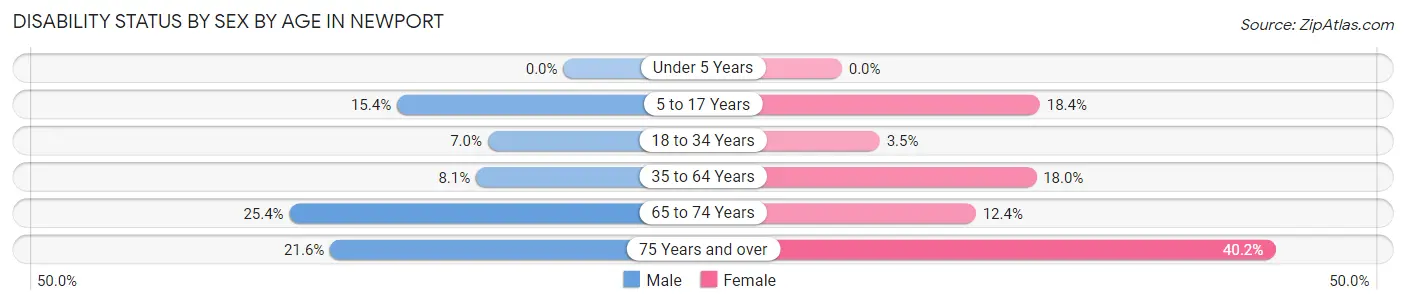
| Age Bracket | Male | Female |
| Under 5 Years | 0 (0.0%) | 0 (0.0%) |
| 5 to 17 Years | 234 (15.4%) | 211 (18.4%) |
| 18 to 34 Years | 199 (7.0%) | 136 (3.5%) |
| 35 to 64 Years | 301 (8.1%) | 777 (18.0%) |
| 65 to 74 Years | 378 (25.4%) | 169 (12.4%) |
| 75 Years and over | 172 (21.6%) | 497 (40.2%) |
Disability Class by Sex by Age in Newport
Disability Class: Hearing Difficulty
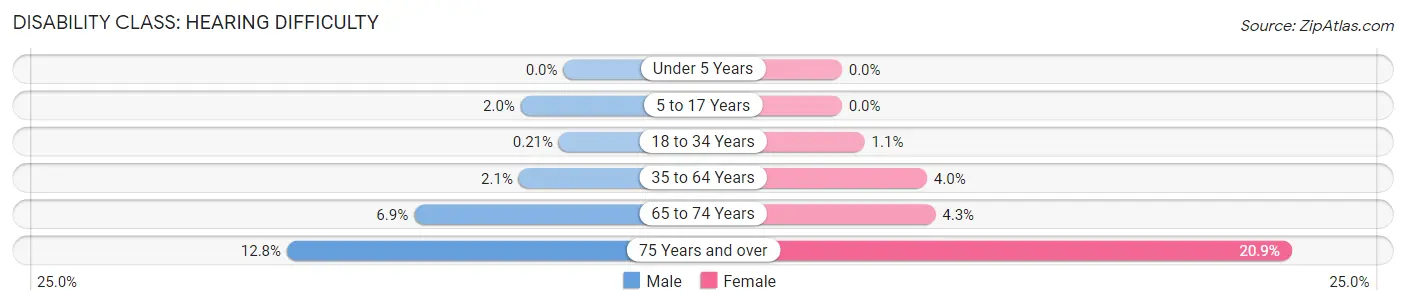
| Age Bracket | Male | Female |
| Under 5 Years | 0 (0.0%) | 0 (0.0%) |
| 5 to 17 Years | 30 (2.0%) | 0 (0.0%) |
| 18 to 34 Years | 6 (0.2%) | 41 (1.1%) |
| 35 to 64 Years | 77 (2.1%) | 170 (4.0%) |
| 65 to 74 Years | 103 (6.9%) | 59 (4.3%) |
| 75 Years and over | 102 (12.8%) | 258 (20.9%) |
Disability Class: Vision Difficulty
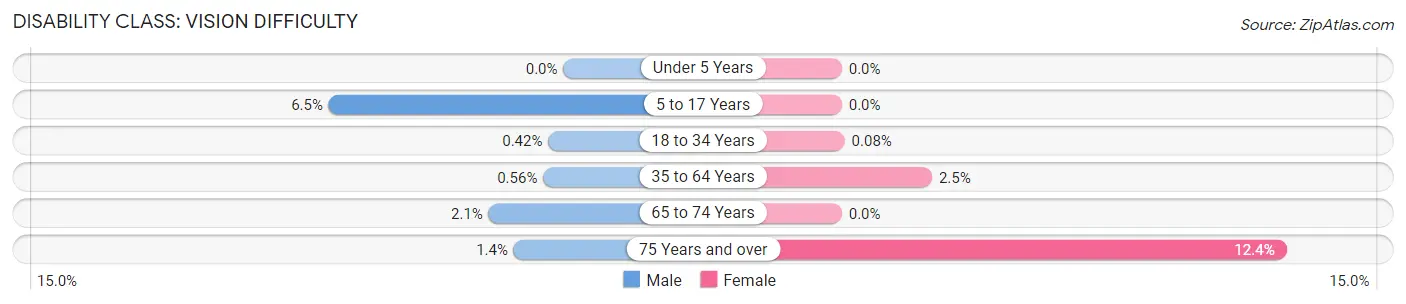
| Age Bracket | Male | Female |
| Under 5 Years | 0 (0.0%) | 0 (0.0%) |
| 5 to 17 Years | 99 (6.5%) | 0 (0.0%) |
| 18 to 34 Years | 12 (0.4%) | 3 (0.1%) |
| 35 to 64 Years | 21 (0.6%) | 108 (2.5%) |
| 65 to 74 Years | 31 (2.1%) | 0 (0.0%) |
| 75 Years and over | 11 (1.4%) | 153 (12.4%) |
Disability Class: Cognitive Difficulty
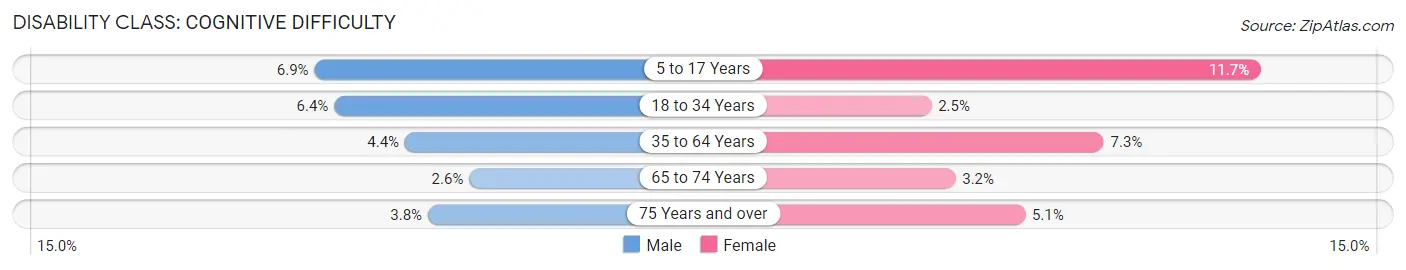
| Age Bracket | Male | Female |
| 5 to 17 Years | 105 (6.9%) | 134 (11.7%) |
| 18 to 34 Years | 181 (6.4%) | 96 (2.5%) |
| 35 to 64 Years | 164 (4.4%) | 314 (7.3%) |
| 65 to 74 Years | 39 (2.6%) | 43 (3.2%) |
| 75 Years and over | 30 (3.8%) | 63 (5.1%) |
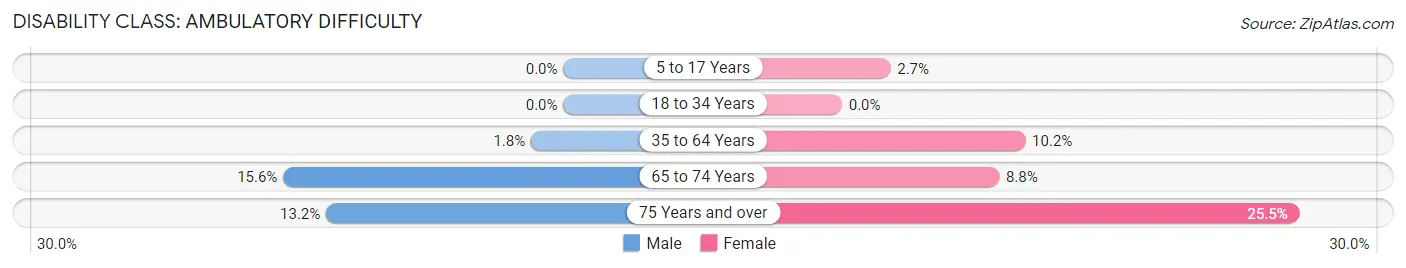
Disability Class: Ambulatory Difficulty
| Age Bracket | Male | Female |
| 5 to 17 Years | 0 (0.0%) | 31 (2.7%) |
| 18 to 34 Years | 0 (0.0%) | 0 (0.0%) |
| 35 to 64 Years | 67 (1.8%) | 440 (10.2%) |
| 65 to 74 Years | 232 (15.6%) | 119 (8.7%) |
| 75 Years and over | 105 (13.2%) | 315 (25.5%) |
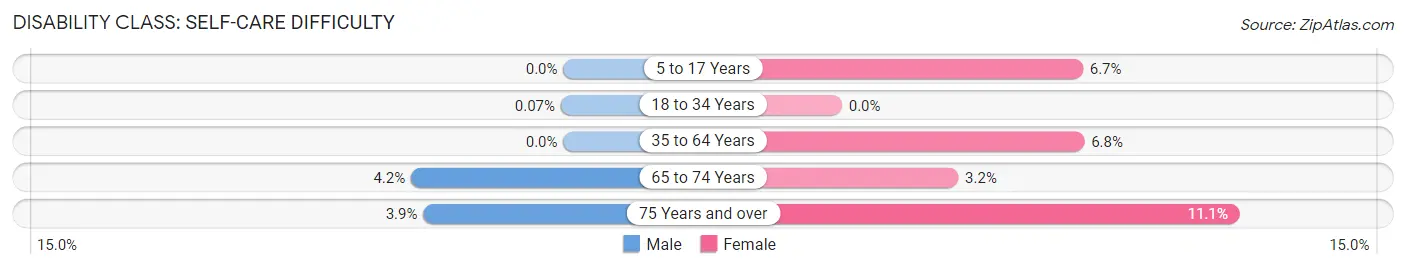
Disability Class: Self-Care Difficulty
| Age Bracket | Male | Female |
| 5 to 17 Years | 0 (0.0%) | 77 (6.7%) |
| 18 to 34 Years | 2 (0.1%) | 0 (0.0%) |
| 35 to 64 Years | 0 (0.0%) | 291 (6.8%) |
| 65 to 74 Years | 63 (4.2%) | 44 (3.2%) |
| 75 Years and over | 31 (3.9%) | 137 (11.1%) |
Technology Access in Newport
Computing Device Access in Newport
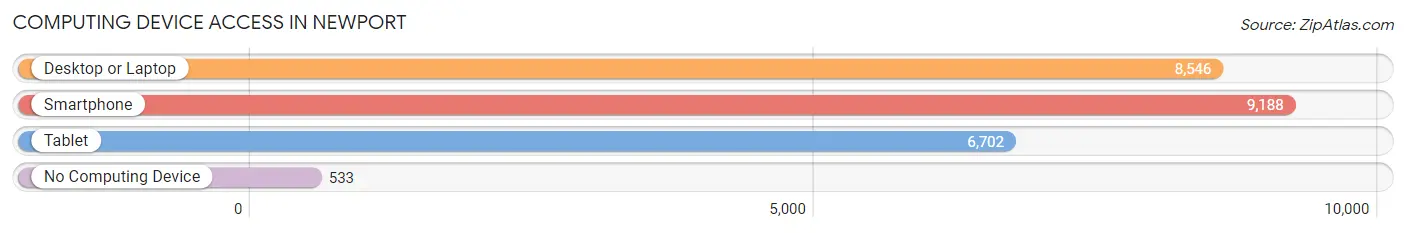
| Device Type | # Households | % Households |
| Desktop or Laptop | 8,546 | 80.3% |
| Smartphone | 9,188 | 86.3% |
| Tablet | 6,702 | 63.0% |
| No Computing Device | 533 | 5.0% |
| Total | 10,645 | 100.0% |
Internet Access in Newport
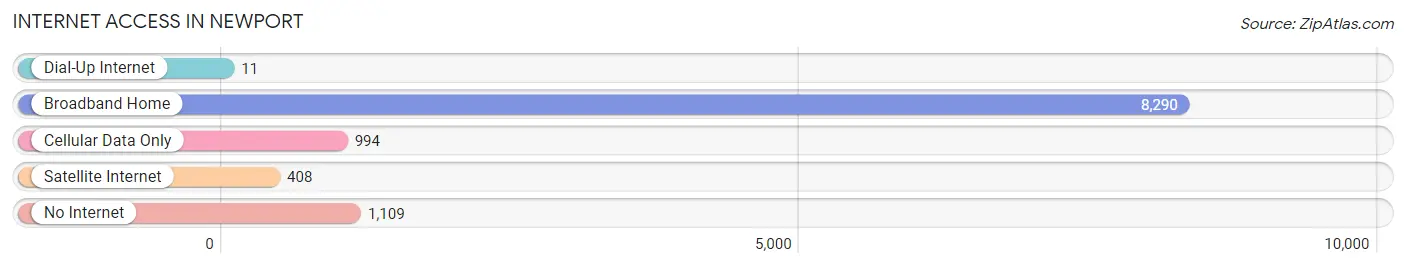
| Internet Type | # Households | % Households |
| Dial-Up Internet | 11 | 0.1% |
| Broadband Home | 8,290 | 77.9% |
| Cellular Data Only | 994 | 9.3% |
| Satellite Internet | 408 | 3.8% |
| No Internet | 1,109 | 10.4% |
| Total | 10,645 | 100.0% |
Newport Summary
Newport, Rhode Island is a city located in the state of Rhode Island, in the United States of America. It is situated on Aquidneck Island, which is the largest island in Narragansett Bay. Newport is known for its rich history, beautiful geography, vibrant economy, and diverse demographics.
History
Newport has a long and storied history, dating back to the 1600s. The area was first settled by the Narragansett Native Americans, who called it Pocasset. In 1639, the first European settlers arrived in the area, led by William Coddington. The settlement was named Newport, after Coddington’s hometown in England.
In the 1700s, Newport became a major port city, and a center of the slave trade. It was also a major center of the Revolutionary War, and was the site of the first naval battle of the war. After the war, Newport became a major center of the whaling industry.
In the 1800s, Newport became a popular summer destination for the wealthy, and many of the city’s grand mansions were built during this time. The city also became a major center of the arts, and was home to many famous writers, artists, and musicians.
Geography
Newport is located on Aquidneck Island, which is the largest island in Narragansett Bay. The city is bordered by the Atlantic Ocean to the south, and the Sakonnet River to the west. The city is also home to several smaller islands, including Goat Island, Rose Island, and Prudence Island.
The city has a total area of 24.3 square miles, of which 21.2 square miles is land and 3.1 square miles is water. The city is located at the mouth of the bay, and is surrounded by several small islands. The city is also home to several beaches, including Easton’s Beach, First Beach, and Second Beach.
Economy
Newport’s economy is largely based on tourism, with the city’s many historic sites and attractions drawing visitors from around the world. The city is also home to several large corporations, including Raytheon, KVH Industries, and the Naval Undersea Warfare Center.
The city is also home to several universities and colleges, including Salve Regina University, the Naval War College, and the Community College of Rhode Island.
Demographics
As of the 2010 census, Newport had a population of 24,672. The city is racially diverse, with the largest racial group being White (77.3%), followed by Hispanic or Latino (7.7%), African American (6.2%), and Asian (3.2%).
The city is also home to a large number of immigrants, with the largest immigrant groups being from Brazil (3.2%), Portugal (2.2%), and India (1.2%).
The median household income in Newport is $50,945, and the median home value is $323,400. The city has a poverty rate of 11.3%, and the unemployment rate is 4.2%.
Newport is a vibrant and diverse city, with a rich history, beautiful geography, vibrant economy, and diverse demographics. The city is home to many historic sites and attractions, and is a popular destination for tourists from around the world. The city is also home to several large corporations, universities, and colleges, making it a great place to live and work.
Common Questions
What is Per Capita Income in Newport?
Per Capita income in Newport is $55,691.
What is the Median Family Income in Newport?
Median Family Income in Newport is $111,275.
What is the Median Household income in Newport?
Median Household Income in Newport is $81,330.
What is Income or Wage Gap in Newport?
Income or Wage Gap in Newport is 22.0%.
Women in Newport earn 78.0 cents for every dollar earned by a man.
What is Family Income Deficit in Newport?
Family Income Deficit in Newport is $11,545.
Families that are below poverty line in Newport earn $11,545 less on average than the poverty threshold level.
What is Inequality or Gini Index in Newport?
Inequality or Gini Index in Newport is 0.53.
What is the Total Population of Newport?
Total Population of Newport is 25,087.
What is the Total Male Population of Newport?
Total Male Population of Newport is 12,177.
What is the Total Female Population of Newport?
Total Female Population of Newport is 12,910.
What is the Ratio of Males per 100 Females in Newport?
There are 94.32 Males per 100 Females in Newport.
What is the Ratio of Females per 100 Males in Newport?
There are 106.02 Females per 100 Males in Newport.
What is the Median Population Age in Newport?
Median Population Age in Newport is 37.4 Years.
What is the Average Family Size in Newport
Average Family Size in Newport is 2.8 People.
What is the Average Household Size in Newport
Average Household Size in Newport is 2.1 People.
How Large is the Labor Force in Newport?
There are 14,271 People in the Labor Forcein in Newport.
What is the Percentage of People in the Labor Force in Newport?
64.6% of People are in the Labor Force in Newport.
What is the Unemployment Rate in Newport?
Unemployment Rate in Newport is 10.0%.