Harmony, RI Map & Demographics
Harmony Map
Harmony Overview
$45,128
PER CAPITA INCOME
$108,973
AVG FAMILY INCOME
$103,430
AVG HOUSEHOLD INCOME
12.0%
WAGE / INCOME GAP [ % ]
88.0¢/ $1
WAGE / INCOME GAP [ $ ]
0.38
INEQUALITY / GINI INDEX
1,442
TOTAL POPULATION
735
MALE POPULATION
707
FEMALE POPULATION
103.96
MALES / 100 FEMALES
96.19
FEMALES / 100 MALES
44.9
MEDIAN AGE
3.4
AVG FAMILY SIZE
3.0
AVG HOUSEHOLD SIZE
851
LABOR FORCE [ PEOPLE ]
71.5%
PERCENT IN LABOR FORCE
3.5%
UNEMPLOYMENT RATE
Harmony Zip Codes
Harmony Area Codes
Income in Harmony
Income Overview in Harmony
Per Capita Income in Harmony is $45,128, while median incomes of families and households are $108,973 and $103,430 respectively.
| Characteristic | Number | Measure |
| Per Capita Income | 1,442 | $45,128 |
| Median Family Income | 387 | $108,973 |
| Mean Family Income | 387 | $152,272 |
| Median Household Income | 474 | $103,430 |
| Mean Household Income | 474 | $135,026 |
| Income Deficit | 387 | $0 |
| Wage / Income Gap (%) | 1,442 | 12.03% |
| Wage / Income Gap ($) | 1,442 | 87.97¢ per $1 |
| Gini / Inequality Index | 1,442 | 0.38 |
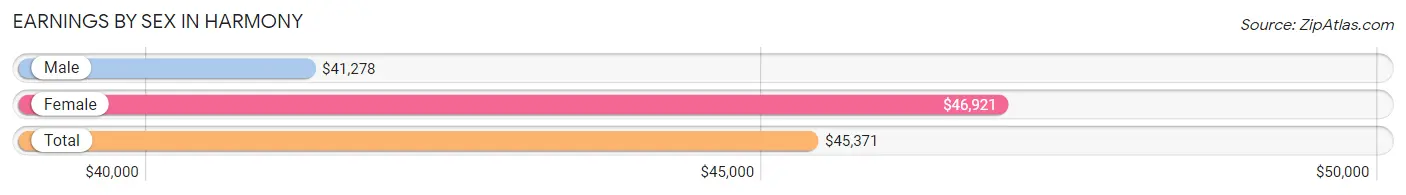
Earnings by Sex in Harmony
Average Earnings in Harmony are $45,371, $41,278 for men and $46,921 for women, a difference of 12.0%.
| Sex | Number | Average Earnings |
| Male | 428 (50.5%) | $41,278 |
| Female | 419 (49.5%) | $46,921 |
| Total | 847 (100.0%) | $45,371 |
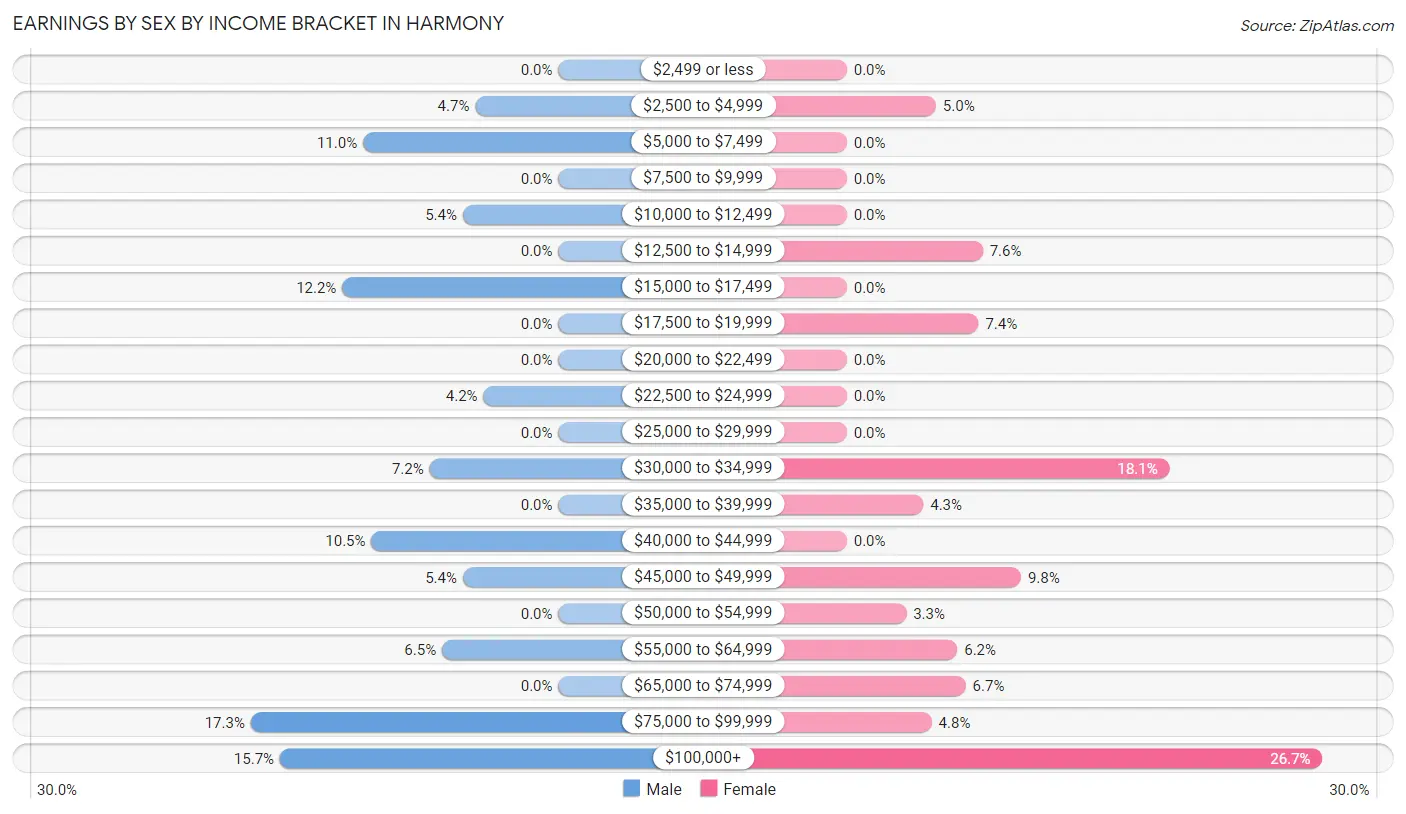
Earnings by Sex by Income Bracket in Harmony
The most common earnings brackets in Harmony are $75,000 to $99,999 for men (74 | 17.3%) and $100,000+ for women (112 | 26.7%).
| Income | Male | Female |
| $2,499 or less | 0 (0.0%) | 0 (0.0%) |
| $2,500 to $4,999 | 20 (4.7%) | 21 (5.0%) |
| $5,000 to $7,499 | 47 (11.0%) | 0 (0.0%) |
| $7,500 to $9,999 | 0 (0.0%) | 0 (0.0%) |
| $10,000 to $12,499 | 23 (5.4%) | 0 (0.0%) |
| $12,500 to $14,999 | 0 (0.0%) | 32 (7.6%) |
| $15,000 to $17,499 | 52 (12.1%) | 0 (0.0%) |
| $17,500 to $19,999 | 0 (0.0%) | 31 (7.4%) |
| $20,000 to $22,499 | 0 (0.0%) | 0 (0.0%) |
| $22,500 to $24,999 | 18 (4.2%) | 0 (0.0%) |
| $25,000 to $29,999 | 0 (0.0%) | 0 (0.0%) |
| $30,000 to $34,999 | 31 (7.2%) | 76 (18.1%) |
| $35,000 to $39,999 | 0 (0.0%) | 18 (4.3%) |
| $40,000 to $44,999 | 45 (10.5%) | 0 (0.0%) |
| $45,000 to $49,999 | 23 (5.4%) | 41 (9.8%) |
| $50,000 to $54,999 | 0 (0.0%) | 14 (3.3%) |
| $55,000 to $64,999 | 28 (6.5%) | 26 (6.2%) |
| $65,000 to $74,999 | 0 (0.0%) | 28 (6.7%) |
| $75,000 to $99,999 | 74 (17.3%) | 20 (4.8%) |
| $100,000+ | 67 (15.7%) | 112 (26.7%) |
| Total | 428 (100.0%) | 419 (100.0%) |
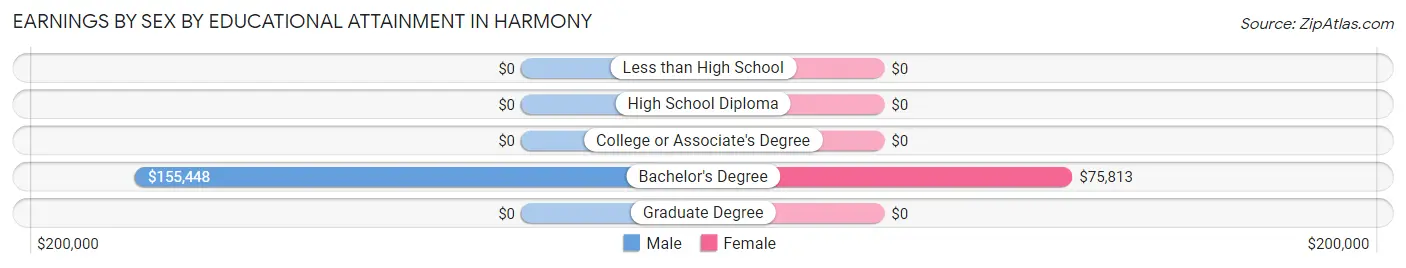
Earnings by Sex by Educational Attainment in Harmony
| Educational Attainment | Male Income | Female Income |
| Less than High School | - | - |
| High School Diploma | - | - |
| College or Associate's Degree | - | - |
| Bachelor's Degree | $155,448 | $75,813 |
| Graduate Degree | - | - |
| Total | - | - |
Family Income in Harmony
Family Income Brackets in Harmony
According to the Harmony family income data, there are 109 families falling into the $100,000 to $149,999 income range, which is the most common income bracket and makes up 28.2% of all families.
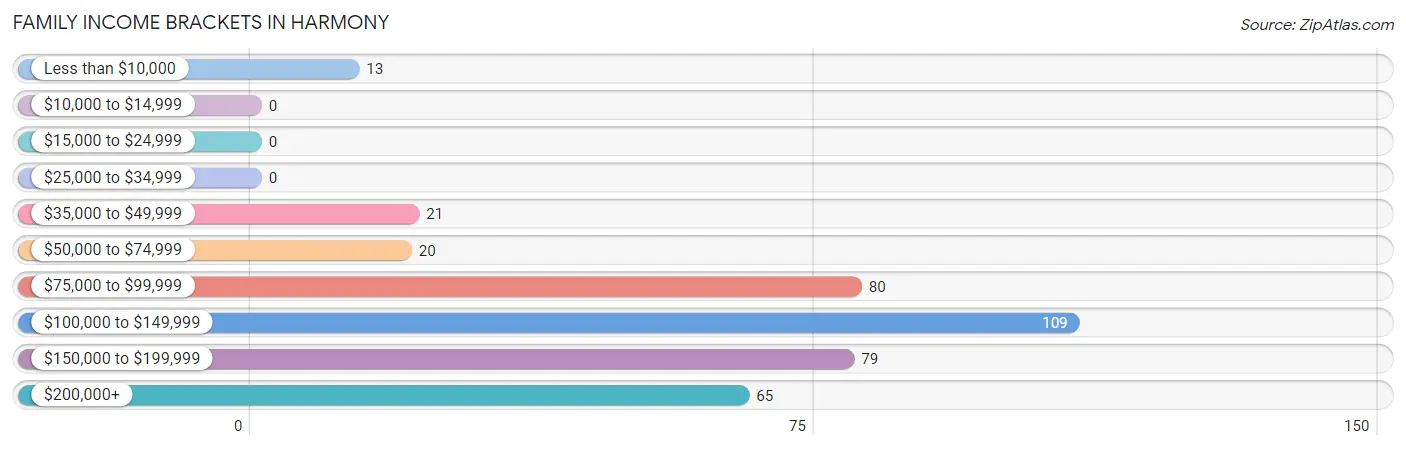
| Income Bracket | # Families | % Families |
| Less than $10,000 | 13 | 3.4% |
| $10,000 to $14,999 | 0 | 0.0% |
| $15,000 to $24,999 | 0 | 0.0% |
| $25,000 to $34,999 | 0 | 0.0% |
| $35,000 to $49,999 | 21 | 5.4% |
| $50,000 to $74,999 | 20 | 5.2% |
| $75,000 to $99,999 | 80 | 20.7% |
| $100,000 to $149,999 | 109 | 28.2% |
| $150,000 to $199,999 | 79 | 20.4% |
| $200,000+ | 65 | 16.8% |
Family Income by Famaliy Size in Harmony
3-person families (121 | 31.3%) account for the highest median family income in Harmony with $250,001 per family, while 3-person families (121 | 31.3%) have the highest median income of $83,334 per family member.
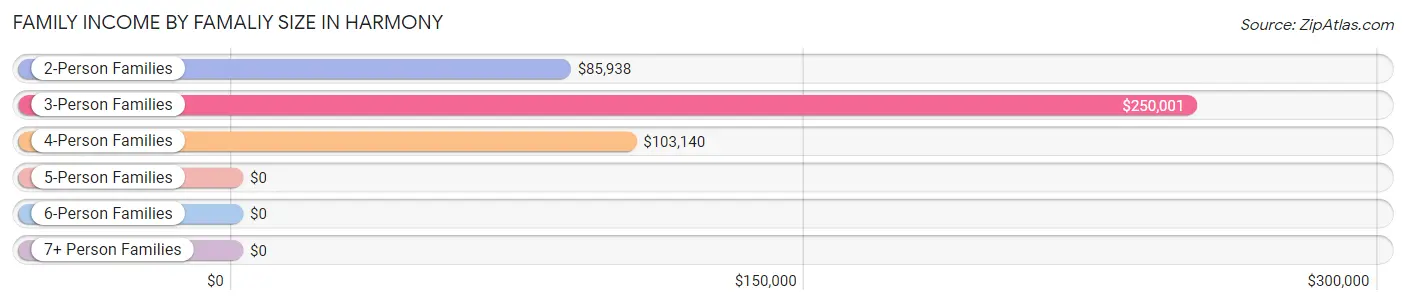
| Income Bracket | # Families | Median Income |
| 2-Person Families | 133 (34.4%) | $85,938 |
| 3-Person Families | 121 (31.3%) | $250,001 |
| 4-Person Families | 64 (16.5%) | $103,140 |
| 5-Person Families | 26 (6.7%) | $0 |
| 6-Person Families | 43 (11.1%) | $0 |
| 7+ Person Families | 0 (0.0%) | $0 |
| Total | 387 (100.0%) | $108,973 |
Family Income by Number of Earners in Harmony
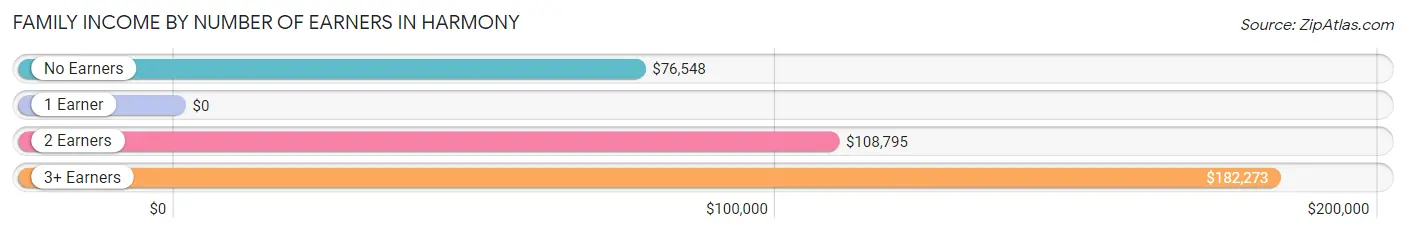
| Number of Earners | # Families | Median Income |
| No Earners | 52 (13.4%) | $76,548 |
| 1 Earner | 36 (9.3%) | $0 |
| 2 Earners | 165 (42.6%) | $108,795 |
| 3+ Earners | 134 (34.6%) | $182,273 |
| Total | 387 (100.0%) | $108,973 |
Household Income in Harmony
Household Income Brackets in Harmony
With 120 households falling in the category, the $75,000 to $99,999 income range is the most frequent in Harmony, accounting for 25.3% of all households.
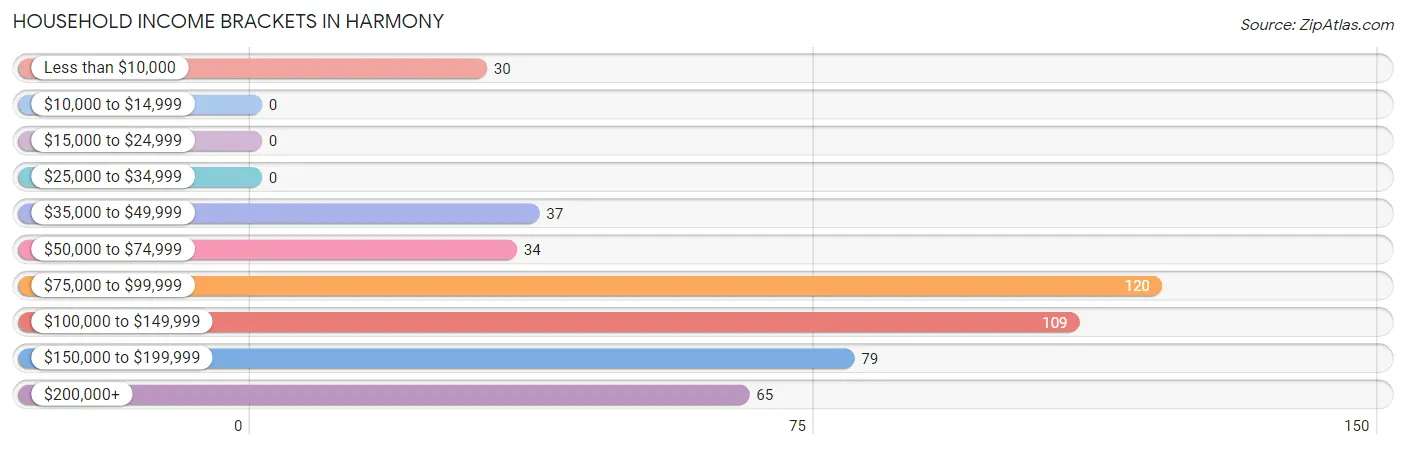
| Income Bracket | # Households | % Households |
| Less than $10,000 | 30 | 6.3% |
| $10,000 to $14,999 | 0 | 0.0% |
| $15,000 to $24,999 | 0 | 0.0% |
| $25,000 to $34,999 | 0 | 0.0% |
| $35,000 to $49,999 | 37 | 7.8% |
| $50,000 to $74,999 | 34 | 7.2% |
| $75,000 to $99,999 | 120 | 25.3% |
| $100,000 to $149,999 | 109 | 23.0% |
| $150,000 to $199,999 | 79 | 16.7% |
| $200,000+ | 65 | 13.7% |
Household Income by Householder Age in Harmony
The median household income in Harmony is $103,430, with the highest median household income of $116,250 found in the 25 to 44 years age bracket for the primary householder. A total of 86 households (18.1%) fall into this category.
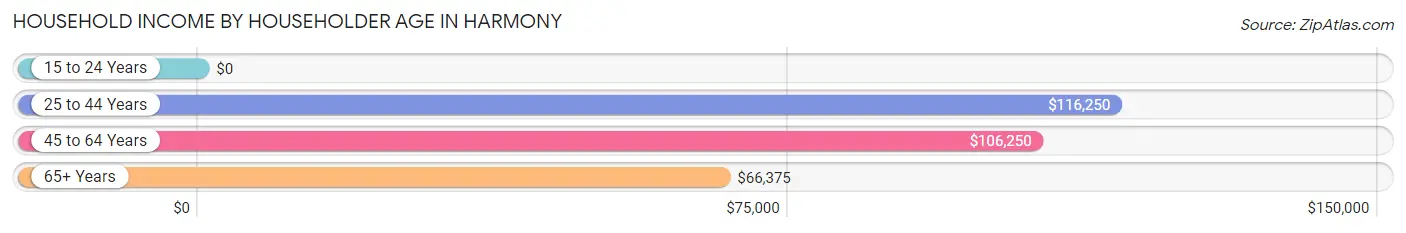
| Income Bracket | # Households | Median Income |
| 15 to 24 Years | 0 (0.0%) | $0 |
| 25 to 44 Years | 86 (18.1%) | $116,250 |
| 45 to 64 Years | 334 (70.5%) | $106,250 |
| 65+ Years | 54 (11.4%) | $66,375 |
| Total | 474 (100.0%) | $103,430 |
Poverty in Harmony
Income Below Poverty by Sex and Age in Harmony
With 3.6% poverty level for males and 4.2% for females among the residents of Harmony, 5 year old males and 35 to 44 year old females are the most vulnerable to poverty, with 13 males (44.8%) and 13 females (15.1%) in their respective age groups living below the poverty level.
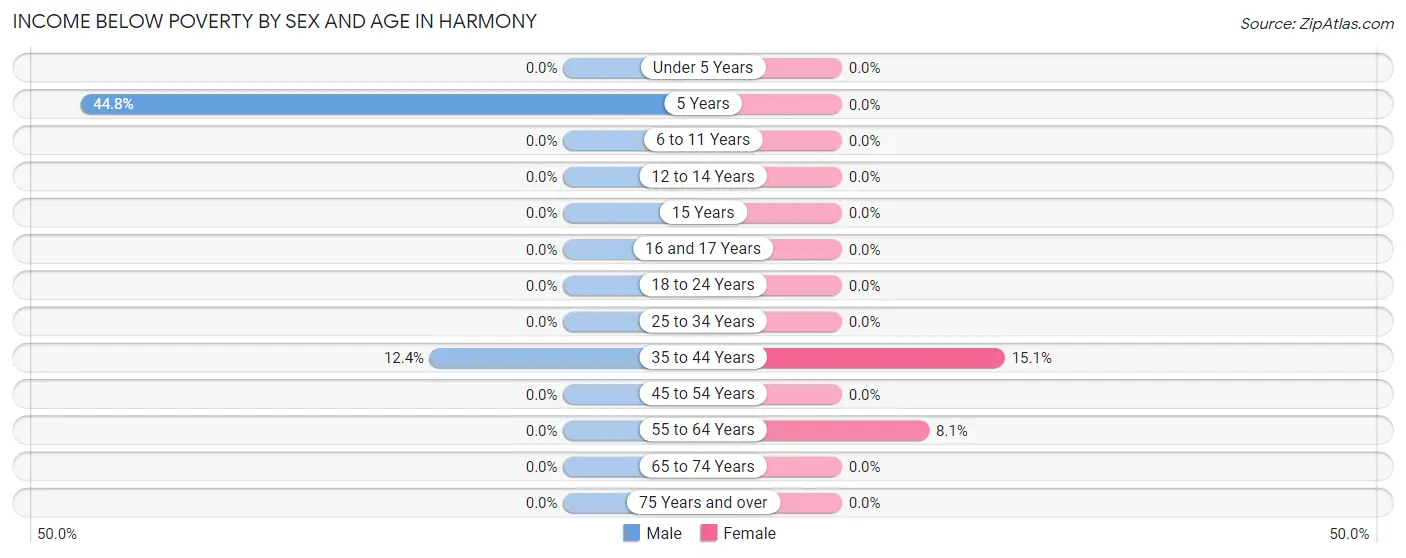
| Age Bracket | Male | Female |
| Under 5 Years | 0 (0.0%) | 0 (0.0%) |
| 5 Years | 13 (44.8%) | 0 (0.0%) |
| 6 to 11 Years | 0 (0.0%) | 0 (0.0%) |
| 12 to 14 Years | 0 (0.0%) | 0 (0.0%) |
| 15 Years | 0 (0.0%) | 0 (0.0%) |
| 16 and 17 Years | 0 (0.0%) | 0 (0.0%) |
| 18 to 24 Years | 0 (0.0%) | 0 (0.0%) |
| 25 to 34 Years | 0 (0.0%) | 0 (0.0%) |
| 35 to 44 Years | 13 (12.4%) | 13 (15.1%) |
| 45 to 54 Years | 0 (0.0%) | 0 (0.0%) |
| 55 to 64 Years | 0 (0.0%) | 17 (8.1%) |
| 65 to 74 Years | 0 (0.0%) | 0 (0.0%) |
| 75 Years and over | 0 (0.0%) | 0 (0.0%) |
| Total | 26 (3.6%) | 30 (4.2%) |
Income Above Poverty by Sex and Age in Harmony
According to the poverty statistics in Harmony, males aged under 5 years and females aged 6 to 11 years are the age groups that are most secure financially, with 100.0% of males and 100.0% of females in these age groups living above the poverty line.
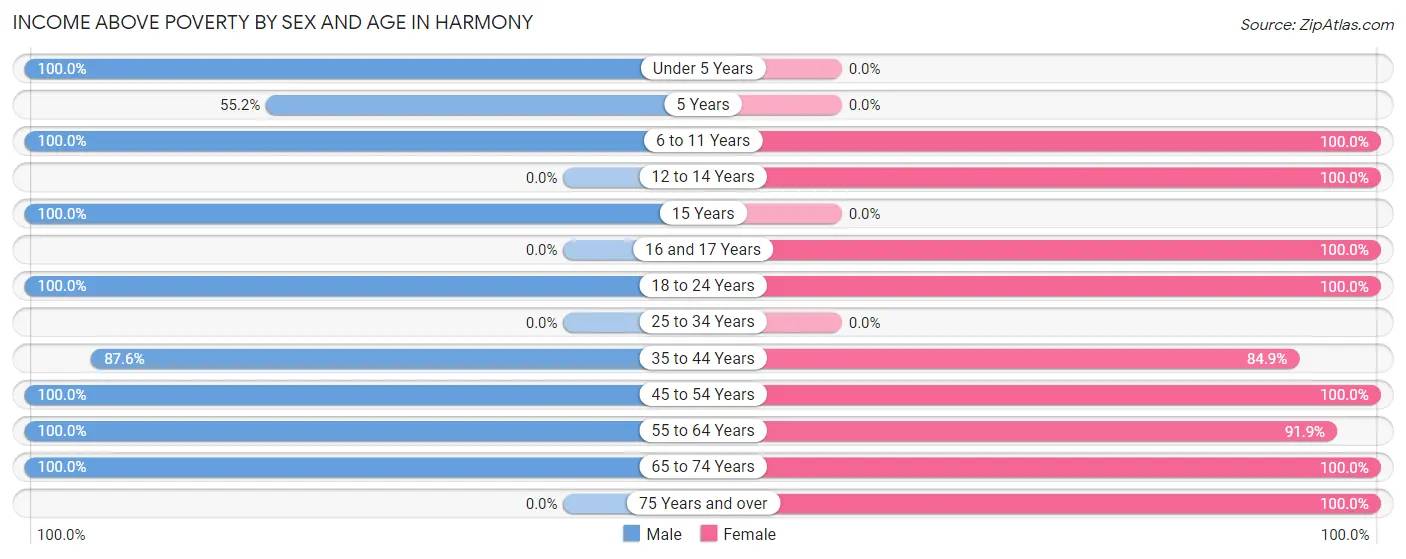
| Age Bracket | Male | Female |
| Under 5 Years | 18 (100.0%) | 0 (0.0%) |
| 5 Years | 16 (55.2%) | 0 (0.0%) |
| 6 to 11 Years | 72 (100.0%) | 91 (100.0%) |
| 12 to 14 Years | 0 (0.0%) | 13 (100.0%) |
| 15 Years | 22 (100.0%) | 0 (0.0%) |
| 16 and 17 Years | 0 (0.0%) | 21 (100.0%) |
| 18 to 24 Years | 90 (100.0%) | 168 (100.0%) |
| 25 to 34 Years | 0 (0.0%) | 0 (0.0%) |
| 35 to 44 Years | 92 (87.6%) | 73 (84.9%) |
| 45 to 54 Years | 66 (100.0%) | 38 (100.0%) |
| 55 to 64 Years | 267 (100.0%) | 193 (91.9%) |
| 65 to 74 Years | 59 (100.0%) | 62 (100.0%) |
| 75 Years and over | 0 (0.0%) | 18 (100.0%) |
| Total | 702 (96.4%) | 677 (95.8%) |
Income Below Poverty Among Married-Couple Families in Harmony
The poverty statistics for married-couple families in Harmony show that 4.1% or 13 of the total 321 families live below the poverty line. Families with 1 or 2 children have the highest poverty rate of 26.0%, comprising of 13 families. On the other hand, families with no children have the lowest poverty rate of 0.0%, which includes 0 families.
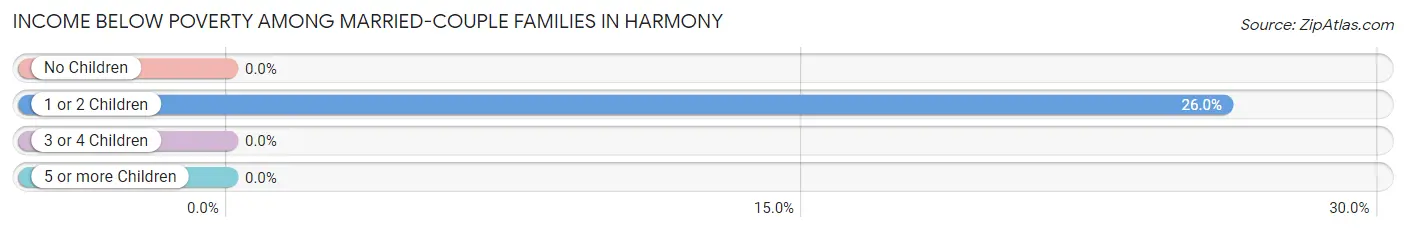
| Children | Above Poverty | Below Poverty |
| No Children | 228 (100.0%) | 0 (0.0%) |
| 1 or 2 Children | 37 (74.0%) | 13 (26.0%) |
| 3 or 4 Children | 43 (100.0%) | 0 (0.0%) |
| 5 or more Children | 0 (0.0%) | 0 (0.0%) |
| Total | 308 (96.0%) | 13 (4.1%) |
Income Below Poverty Among Single-Parent Households in Harmony
| Children | Single Father | Single Mother |
| No Children | 0 (0.0%) | 0 (0.0%) |
| 1 or 2 Children | 0 (0.0%) | 0 (0.0%) |
| 3 or 4 Children | 0 (0.0%) | 0 (0.0%) |
| 5 or more Children | 0 (0.0%) | 0 (0.0%) |
| Total | 0 (0.0%) | 0 (0.0%) |
Income Below Poverty Among Married-Couple vs Single-Parent Households in Harmony
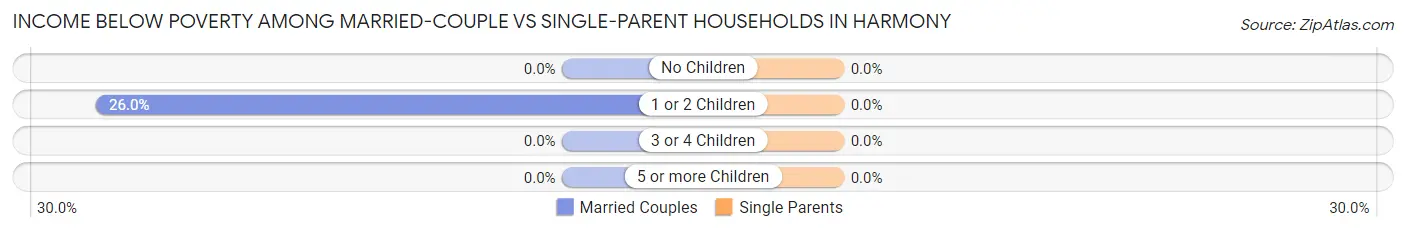
| Children | Married-Couple Families | Single-Parent Households |
| No Children | 0 (0.0%) | 0 (0.0%) |
| 1 or 2 Children | 13 (26.0%) | 0 (0.0%) |
| 3 or 4 Children | 0 (0.0%) | 0 (0.0%) |
| 5 or more Children | 0 (0.0%) | 0 (0.0%) |
| Total | 13 (4.1%) | 0 (0.0%) |
Race in Harmony
The most populous races in Harmony are , and White / Caucasian (1,442 | 100.0%).
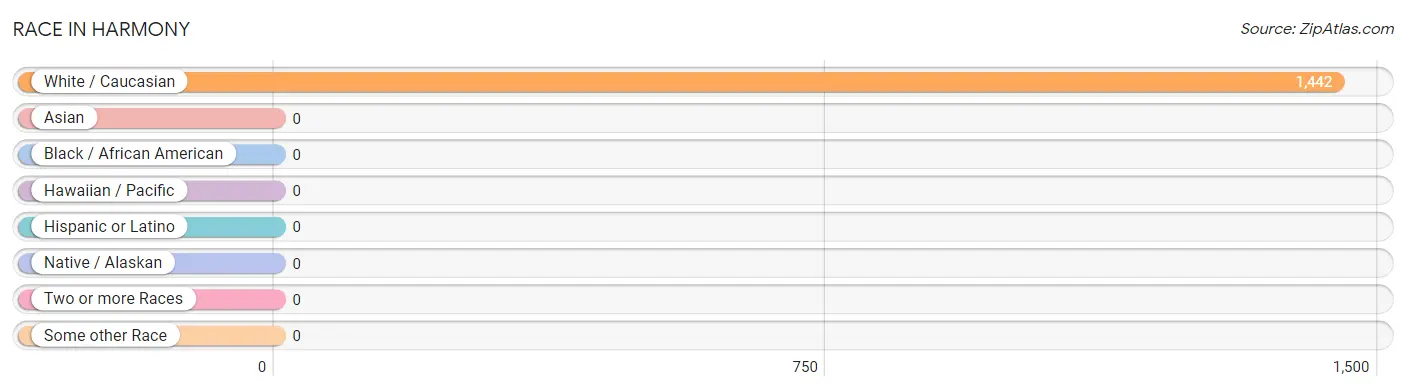
| Race | # Population | % Population |
| Asian | 0 | 0.0% |
| Black / African American | 0 | 0.0% |
| Hawaiian / Pacific | 0 | 0.0% |
| Hispanic or Latino | 0 | 0.0% |
| Native / Alaskan | 0 | 0.0% |
| White / Caucasian | 1,442 | 100.0% |
| Two or more Races | 0 | 0.0% |
| Some other Race | 0 | 0.0% |
| Total | 1,442 | 100.0% |
Ancestry in Harmony
The most populous ancestries reported in Harmony are English (334 | 23.2%), Italian (298 | 20.7%), Irish (264 | 18.3%), Swedish (202 | 14.0%), and American (187 | 13.0%), together accounting for 89.1% of all Harmony residents.
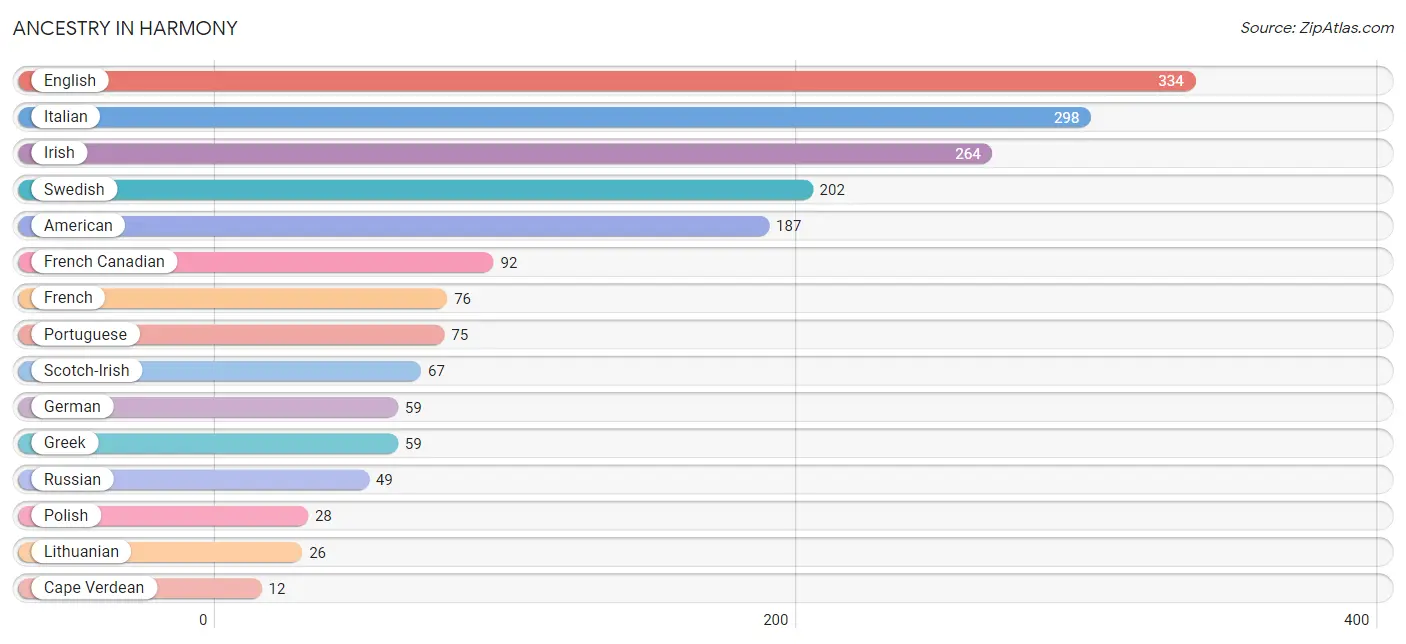
| Ancestry | # Population | % Population |
| American | 187 | 13.0% |
| Cape Verdean | 12 | 0.8% |
| English | 334 | 23.2% |
| French | 76 | 5.3% |
| French Canadian | 92 | 6.4% |
| German | 59 | 4.1% |
| Greek | 59 | 4.1% |
| Irish | 264 | 18.3% |
| Italian | 298 | 20.7% |
| Lithuanian | 26 | 1.8% |
| Polish | 28 | 1.9% |
| Portuguese | 75 | 5.2% |
| Russian | 49 | 3.4% |
| Scotch-Irish | 67 | 4.6% |
| Subsaharan African | 12 | 0.8% |
| Swedish | 202 | 14.0% | View All 16 Rows |
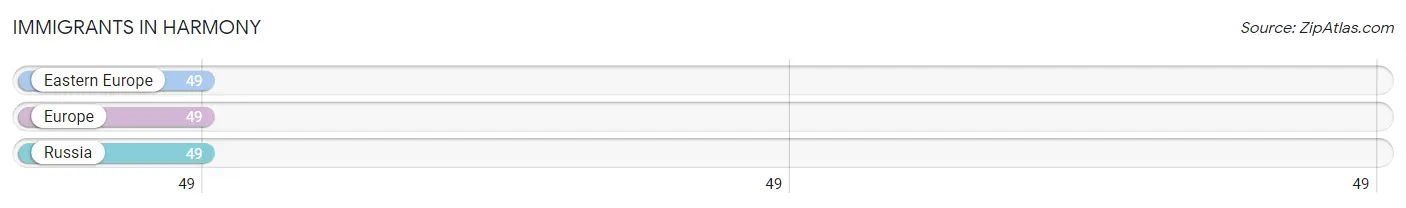
Immigrants in Harmony
The most numerous immigrant groups reported in Harmony came from Eastern Europe (49 | 3.4%), Europe (49 | 3.4%), and Russia (49 | 3.4%), together accounting for 10.2% of all Harmony residents.
| Immigration Origin | # Population | % Population |
| Eastern Europe | 49 | 3.4% |
| Europe | 49 | 3.4% |
| Russia | 49 | 3.4% | View All 3 Rows |
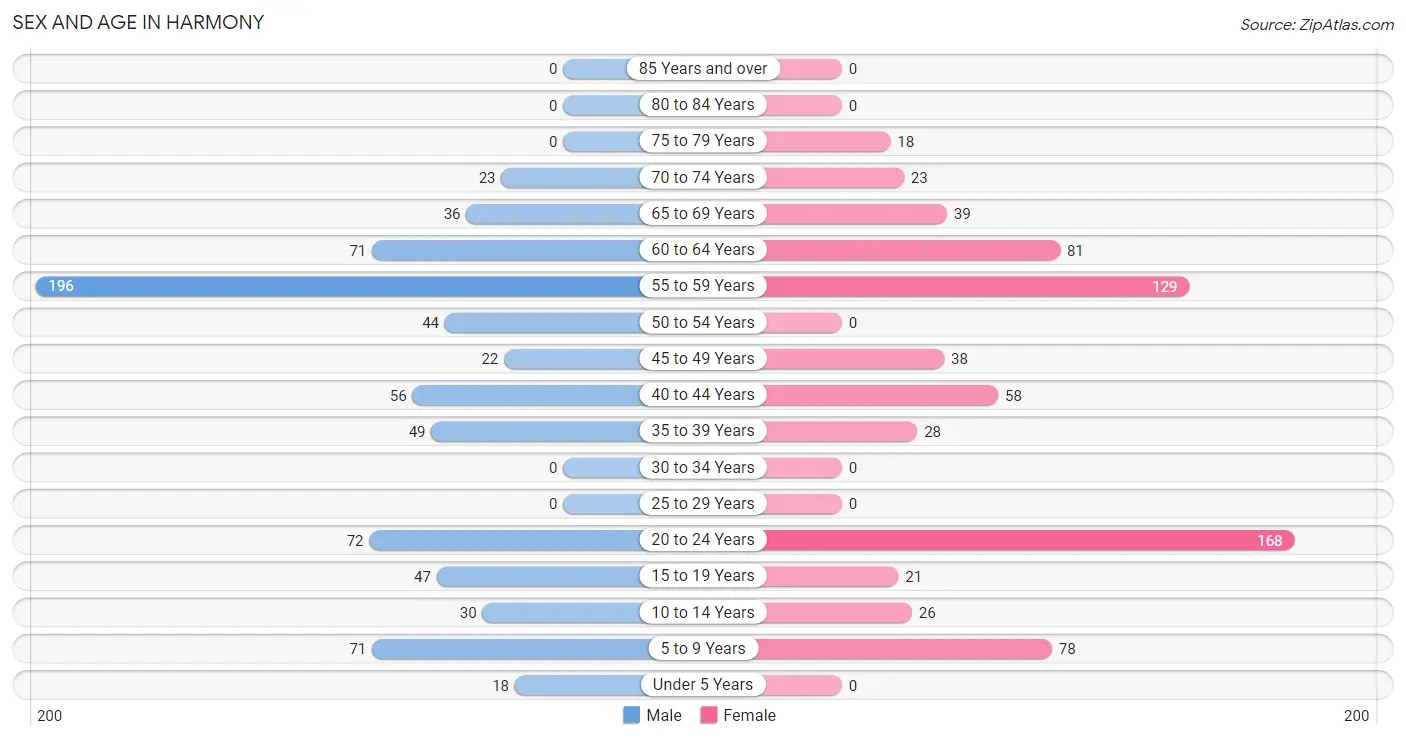
Sex and Age in Harmony
Sex and Age in Harmony
The most populous age groups in Harmony are 55 to 59 Years (196 | 26.7%) for men and 20 to 24 Years (168 | 23.8%) for women.
| Age Bracket | Male | Female |
| Under 5 Years | 18 (2.5%) | 0 (0.0%) |
| 5 to 9 Years | 71 (9.7%) | 78 (11.0%) |
| 10 to 14 Years | 30 (4.1%) | 26 (3.7%) |
| 15 to 19 Years | 47 (6.4%) | 21 (3.0%) |
| 20 to 24 Years | 72 (9.8%) | 168 (23.8%) |
| 25 to 29 Years | 0 (0.0%) | 0 (0.0%) |
| 30 to 34 Years | 0 (0.0%) | 0 (0.0%) |
| 35 to 39 Years | 49 (6.7%) | 28 (4.0%) |
| 40 to 44 Years | 56 (7.6%) | 58 (8.2%) |
| 45 to 49 Years | 22 (3.0%) | 38 (5.4%) |
| 50 to 54 Years | 44 (6.0%) | 0 (0.0%) |
| 55 to 59 Years | 196 (26.7%) | 129 (18.2%) |
| 60 to 64 Years | 71 (9.7%) | 81 (11.5%) |
| 65 to 69 Years | 36 (4.9%) | 39 (5.5%) |
| 70 to 74 Years | 23 (3.1%) | 23 (3.3%) |
| 75 to 79 Years | 0 (0.0%) | 18 (2.5%) |
| 80 to 84 Years | 0 (0.0%) | 0 (0.0%) |
| 85 Years and over | 0 (0.0%) | 0 (0.0%) |
| Total | 735 (100.0%) | 707 (100.0%) |
Families and Households in Harmony
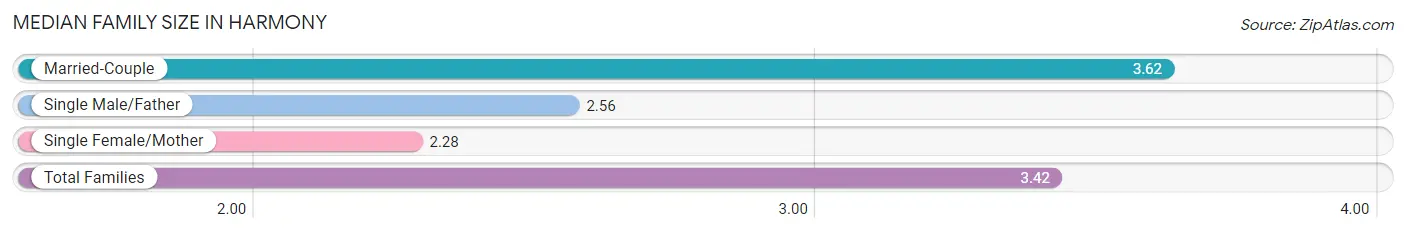
Median Family Size in Harmony
The median family size in Harmony is 3.42 persons per family, with married-couple families (321 | 83.0%) accounting for the largest median family size of 3.62 persons per family. On the other hand, single female/mother families (18 | 4.6%) represent the smallest median family size with 2.28 persons per family.
| Family Type | # Families | Family Size |
| Married-Couple | 321 (83.0%) | 3.62 |
| Single Male/Father | 48 (12.4%) | 2.56 |
| Single Female/Mother | 18 (4.6%) | 2.28 |
| Total Families | 387 (100.0%) | 3.42 |
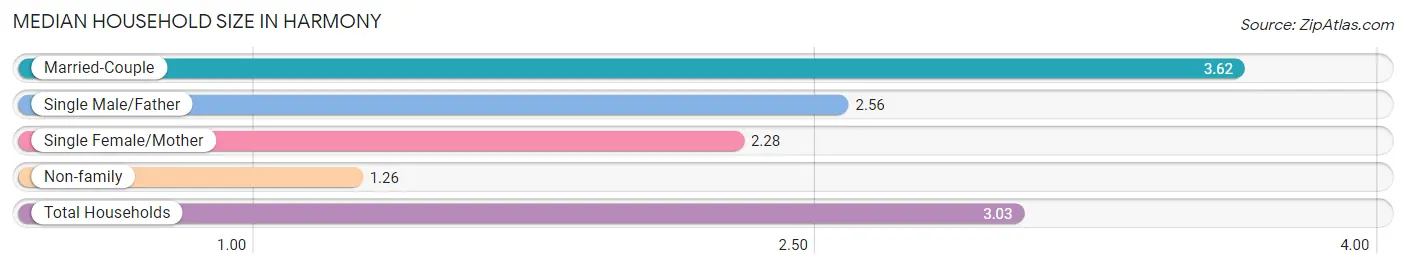
Median Household Size in Harmony
The median household size in Harmony is 3.03 persons per household, with married-couple households (321 | 67.7%) accounting for the largest median household size of 3.62 persons per household. non-family households (87 | 18.3%) represent the smallest median household size with 1.26 persons per household.
| Household Type | # Households | Household Size |
| Married-Couple | 321 (67.7%) | 3.62 |
| Single Male/Father | 48 (10.1%) | 2.56 |
| Single Female/Mother | 18 (3.8%) | 2.28 |
| Non-family | 87 (18.3%) | 1.26 |
| Total Households | 474 (100.0%) | 3.03 |
Household Size by Marriage Status in Harmony
Out of a total of 474 households in Harmony, 387 (81.7%) are family households, while 87 (18.3%) are nonfamily households. The most numerous type of family households are 2-person households, comprising 133, and the most common type of nonfamily households are 1-person households, comprising 61.
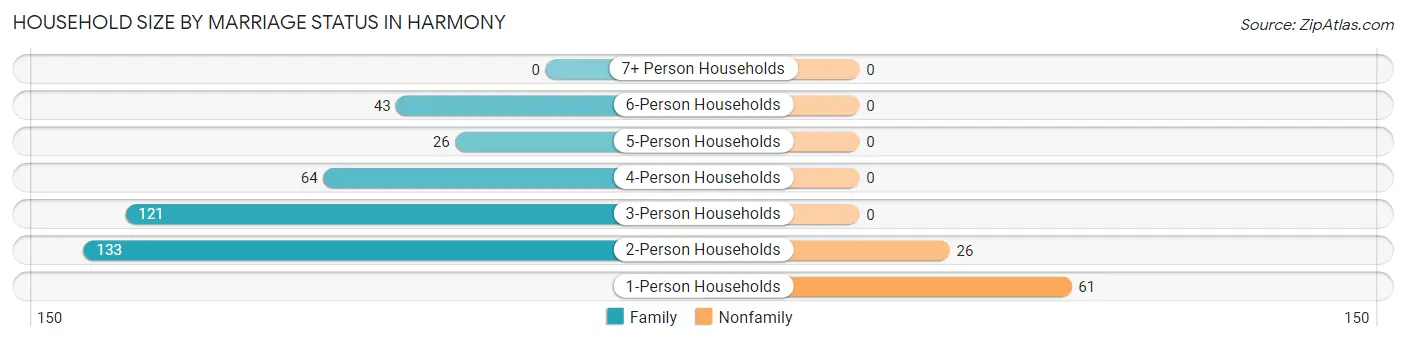
| Household Size | Family Households | Nonfamily Households |
| 1-Person Households | - | 61 (12.9%) |
| 2-Person Households | 133 (28.1%) | 26 (5.5%) |
| 3-Person Households | 121 (25.5%) | 0 (0.0%) |
| 4-Person Households | 64 (13.5%) | 0 (0.0%) |
| 5-Person Households | 26 (5.5%) | 0 (0.0%) |
| 6-Person Households | 43 (9.1%) | 0 (0.0%) |
| 7+ Person Households | 0 (0.0%) | 0 (0.0%) |
| Total | 387 (81.7%) | 87 (18.3%) |
Female Fertility in Harmony
Fertility by Age in Harmony
| Age Bracket | Women with Births | Births / 1,000 Women |
| 15 to 19 years | 0 (0.0%) | 0.0 |
| 20 to 34 years | 0 (0.0%) | 0.0 |
| 35 to 50 years | 0 (0.0%) | 0.0 |
| Total | 0 (0.0%) | 0.0 |
Fertility by Age by Marriage Status in Harmony
| Age Bracket | Married | Unmarried |
| 15 to 19 years | 0 (0.0%) | 0 (0.0%) |
| 20 to 34 years | 0 (0.0%) | 0 (0.0%) |
| 35 to 50 years | 0 (0.0%) | 0 (0.0%) |
| Total | 0 (0.0%) | 0 (0.0%) |
Fertility by Education in Harmony
| Educational Attainment | Women with Births | Births / 1,000 Women |
| Less than High School | 0 (0.0%) | 0.0 |
| High School Diploma | 0 (0.0%) | 0.0 |
| College or Associate's Degree | 0 (0.0%) | 0.0 |
| Bachelor's Degree | 0 (0.0%) | 0.0 |
| Graduate Degree | 0 (0.0%) | 0.0 |
| Total | 0 (0.0%) | 0.0 |
Fertility by Education by Marriage Status in Harmony
| Educational Attainment | Married | Unmarried |
| Less than High School | 0 (0.0%) | 0 (0.0%) |
| High School Diploma | 0 (0.0%) | 0 (0.0%) |
| College or Associate's Degree | 0 (0.0%) | 0 (0.0%) |
| Bachelor's Degree | 0 (0.0%) | 0 (0.0%) |
| Graduate Degree | 0 (0.0%) | 0 (0.0%) |
| Total | 0 (0.0%) | 0 (0.0%) |
Employment Characteristics in Harmony
Employment by Class of Employer in Harmony
Among the 821 employed individuals in Harmony, private company employees (552 | 67.2%), not-for-profit organizations (105 | 12.8%), and self-employed (not incorporated) (68 | 8.3%) make up the most common classes of employment.
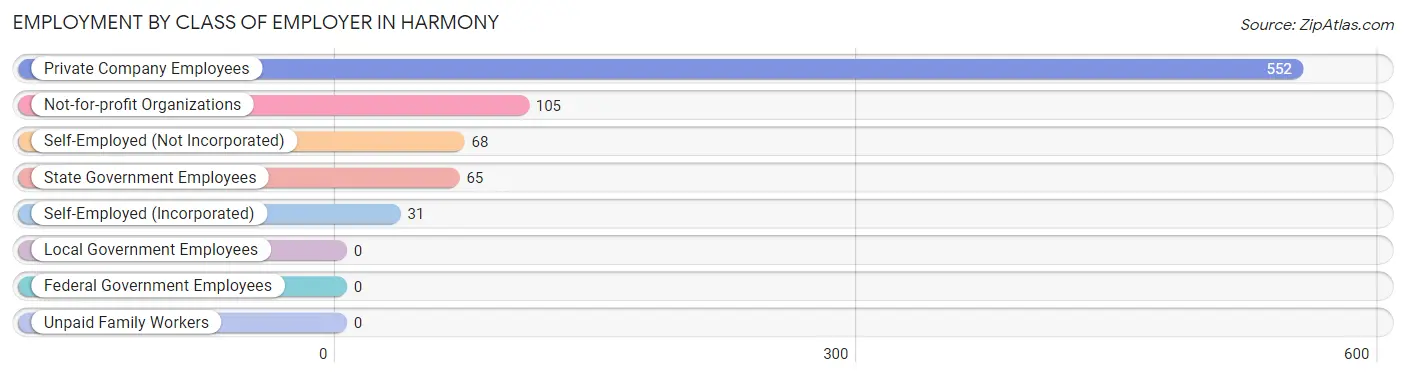
| Employer Class | # Employees | % Employees |
| Private Company Employees | 552 | 67.2% |
| Self-Employed (Incorporated) | 31 | 3.8% |
| Self-Employed (Not Incorporated) | 68 | 8.3% |
| Not-for-profit Organizations | 105 | 12.8% |
| Local Government Employees | 0 | 0.0% |
| State Government Employees | 65 | 7.9% |
| Federal Government Employees | 0 | 0.0% |
| Unpaid Family Workers | 0 | 0.0% |
| Total | 821 | 100.0% |
Employment Status by Age in Harmony
According to the labor force statistics for Harmony, out of the total population over 16 years of age (1,190), 71.5% or 851 individuals are in the labor force, with 3.5% or 30 of them unemployed. The age group with the highest labor force participation rate is 16 to 19 years, with 100.0% or 39 individuals in the labor force. Within the labor force, the 35 to 44 years age range has the highest percentage of unemployed individuals, with 20.5% or 30 of them being unemployed.
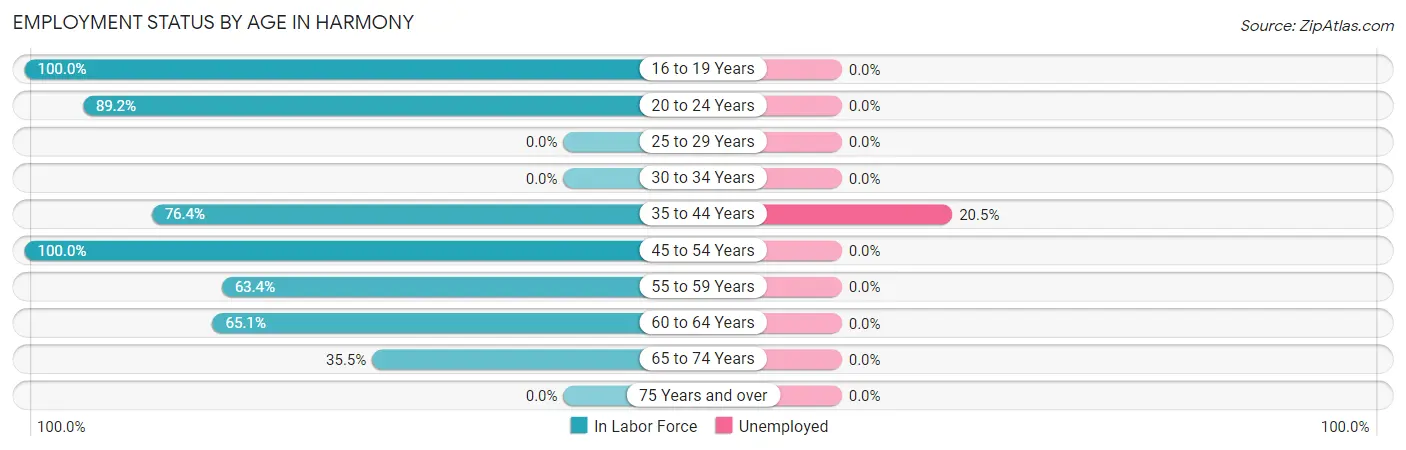
| Age Bracket | In Labor Force | Unemployed |
| 16 to 19 Years | 39 (100.0%) | 0 (0.0%) |
| 20 to 24 Years | 214 (89.2%) | 0 (0.0%) |
| 25 to 29 Years | 0 (0.0%) | 0 (0.0%) |
| 30 to 34 Years | 0 (0.0%) | 0 (0.0%) |
| 35 to 44 Years | 146 (76.4%) | 30 (20.5%) |
| 45 to 54 Years | 104 (100.0%) | 0 (0.0%) |
| 55 to 59 Years | 206 (63.4%) | 0 (0.0%) |
| 60 to 64 Years | 99 (65.1%) | 0 (0.0%) |
| 65 to 74 Years | 43 (35.5%) | 0 (0.0%) |
| 75 Years and over | 0 (0.0%) | 0 (0.0%) |
| Total | 851 (71.5%) | 30 (3.5%) |
Employment Status by Educational Attainment in Harmony
According to labor force statistics for Harmony, 71.9% of individuals (555) out of the total population between 25 and 64 years of age (772) are in the labor force, with 5.4% or 30 of them being unemployed. The group with the highest labor force participation rate are those with the educational attainment of bachelor's degree or higher, with 84.9% or 264 individuals in the labor force. Within the labor force, individuals with college / associate degree education have the highest percentage of unemployment, with 15.8% or 30 of them being unemployed.
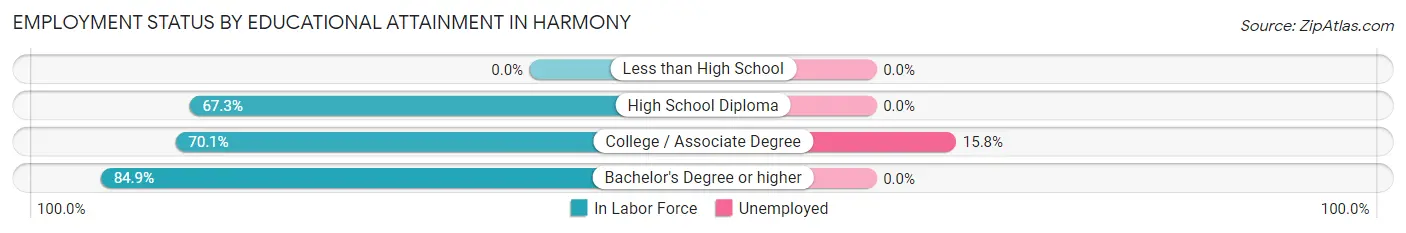
| Educational Attainment | In Labor Force | Unemployed |
| Less than High School | 0 (0.0%) | 0 (0.0%) |
| High School Diploma | 101 (67.3%) | 0 (0.0%) |
| College / Associate Degree | 190 (70.1%) | 43 (15.8%) |
| Bachelor's Degree or higher | 264 (84.9%) | 0 (0.0%) |
| Total | 555 (71.9%) | 42 (5.4%) |
Employment Occupations by Sex in Harmony
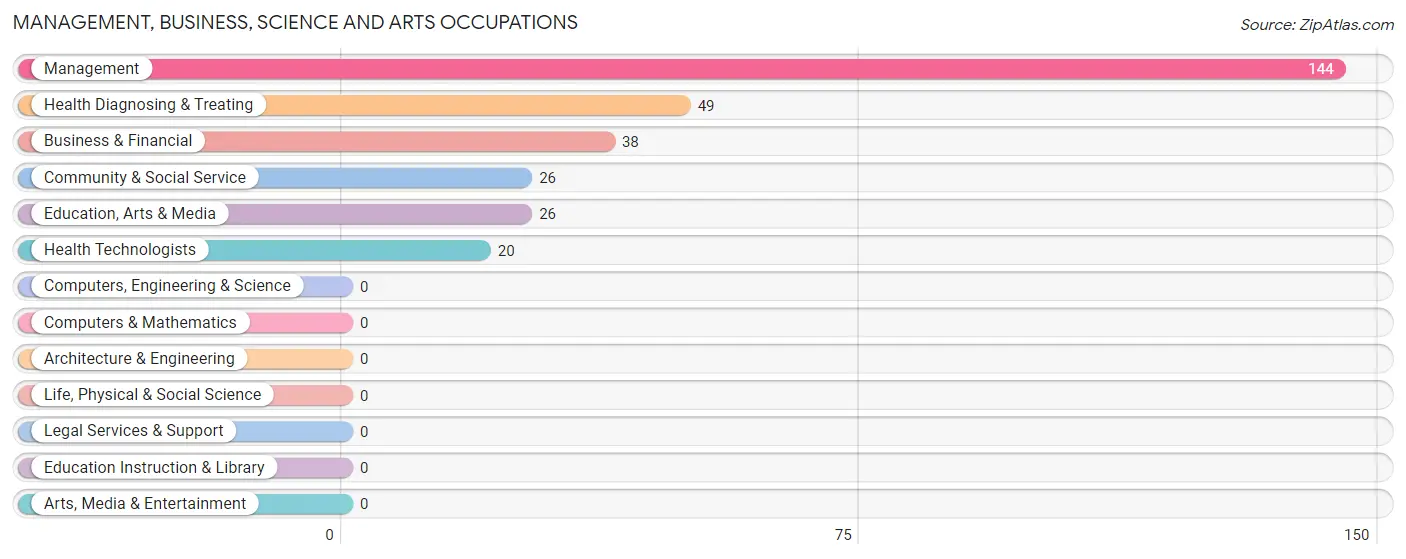
Management, Business, Science and Arts Occupations
The most common Management, Business, Science and Arts occupations in Harmony are Management (144 | 17.5%), Health Diagnosing & Treating (49 | 6.0%), Business & Financial (38 | 4.6%), Community & Social Service (26 | 3.2%), and Education, Arts & Media (26 | 3.2%).
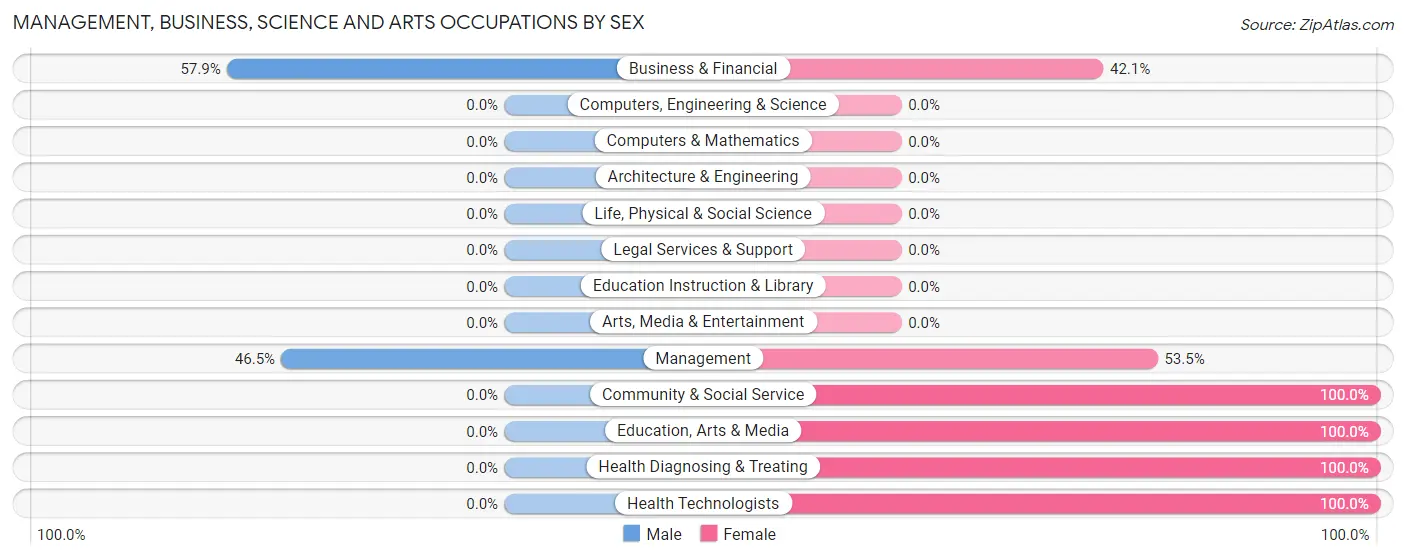
Management, Business, Science and Arts Occupations by Sex
Within the Management, Business, Science and Arts occupations in Harmony, the most male-oriented occupations are Business & Financial (57.9%), and Management (46.5%), while the most female-oriented occupations are Community & Social Service (100.0%), Education, Arts & Media (100.0%), and Health Diagnosing & Treating (100.0%).
| Occupation | Male | Female |
| Management | 67 (46.5%) | 77 (53.5%) |
| Business & Financial | 22 (57.9%) | 16 (42.1%) |
| Computers, Engineering & Science | 0 (0.0%) | 0 (0.0%) |
| Computers & Mathematics | 0 (0.0%) | 0 (0.0%) |
| Architecture & Engineering | 0 (0.0%) | 0 (0.0%) |
| Life, Physical & Social Science | 0 (0.0%) | 0 (0.0%) |
| Community & Social Service | 0 (0.0%) | 26 (100.0%) |
| Education, Arts & Media | 0 (0.0%) | 26 (100.0%) |
| Legal Services & Support | 0 (0.0%) | 0 (0.0%) |
| Education Instruction & Library | 0 (0.0%) | 0 (0.0%) |
| Arts, Media & Entertainment | 0 (0.0%) | 0 (0.0%) |
| Health Diagnosing & Treating | 0 (0.0%) | 49 (100.0%) |
| Health Technologists | 0 (0.0%) | 20 (100.0%) |
| Total (Category) | 89 (34.6%) | 168 (65.4%) |
| Total (Overall) | 402 (49.0%) | 419 (51.0%) |
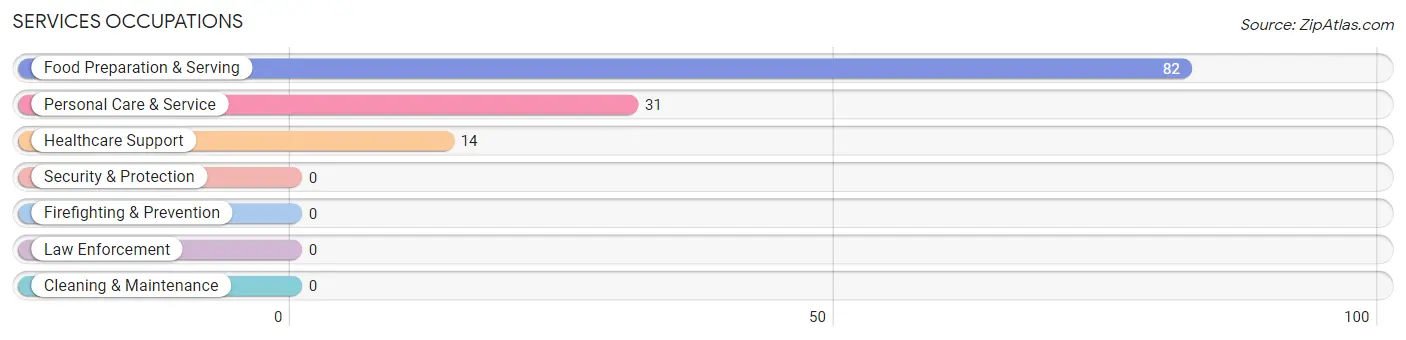
Services Occupations
The most common Services occupations in Harmony are Food Preparation & Serving (82 | 10.0%), Personal Care & Service (31 | 3.8%), and Healthcare Support (14 | 1.7%).
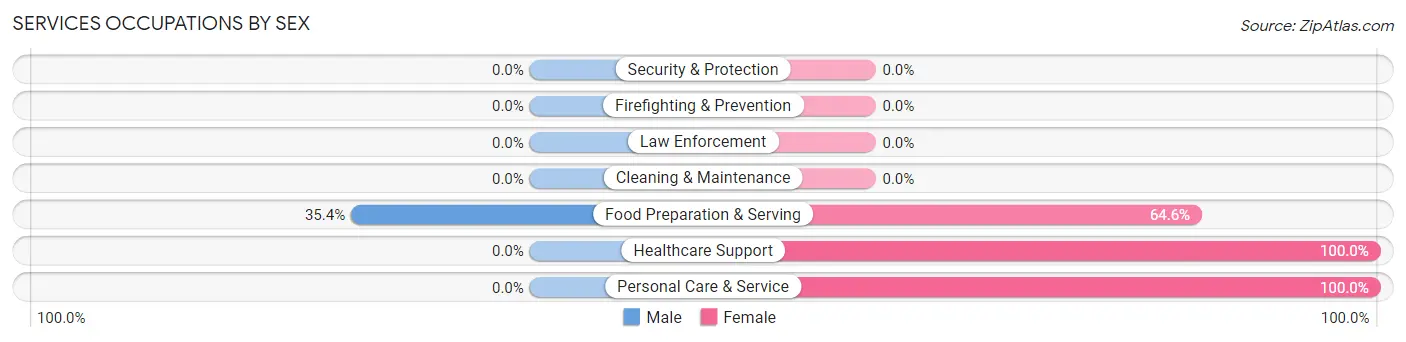
Services Occupations by Sex
| Occupation | Male | Female |
| Healthcare Support | 0 (0.0%) | 14 (100.0%) |
| Security & Protection | 0 (0.0%) | 0 (0.0%) |
| Firefighting & Prevention | 0 (0.0%) | 0 (0.0%) |
| Law Enforcement | 0 (0.0%) | 0 (0.0%) |
| Food Preparation & Serving | 29 (35.4%) | 53 (64.6%) |
| Cleaning & Maintenance | 0 (0.0%) | 0 (0.0%) |
| Personal Care & Service | 0 (0.0%) | 31 (100.0%) |
| Total (Category) | 29 (22.8%) | 98 (77.2%) |
| Total (Overall) | 402 (49.0%) | 419 (51.0%) |
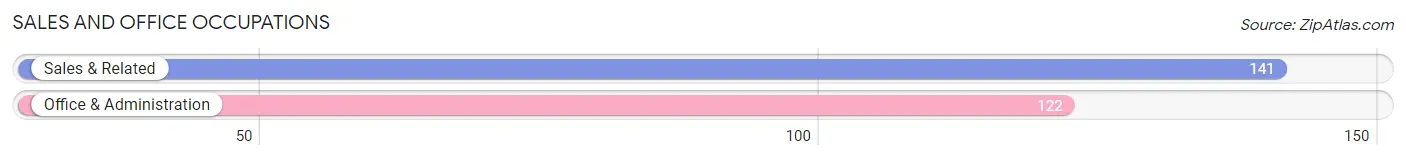
Sales and Office Occupations
The most common Sales and Office occupations in Harmony are Sales & Related (141 | 17.2%), and Office & Administration (122 | 14.9%).
Sales and Office Occupations by Sex
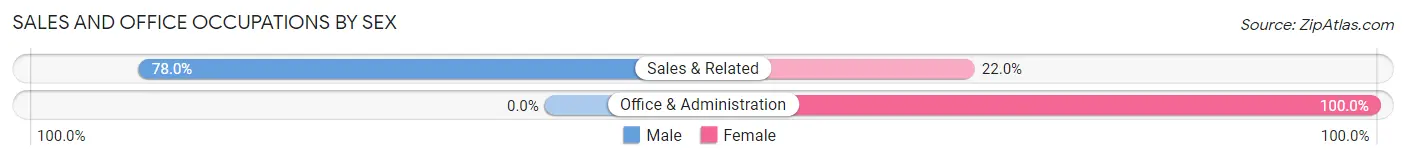
| Occupation | Male | Female |
| Sales & Related | 110 (78.0%) | 31 (22.0%) |
| Office & Administration | 0 (0.0%) | 122 (100.0%) |
| Total (Category) | 110 (41.8%) | 153 (58.2%) |
| Total (Overall) | 402 (49.0%) | 419 (51.0%) |
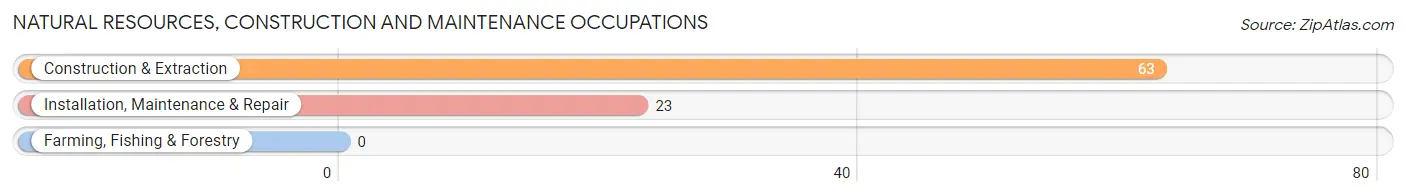
Natural Resources, Construction and Maintenance Occupations
The most common Natural Resources, Construction and Maintenance occupations in Harmony are Construction & Extraction (63 | 7.7%), and Installation, Maintenance & Repair (23 | 2.8%).
Natural Resources, Construction and Maintenance Occupations by Sex
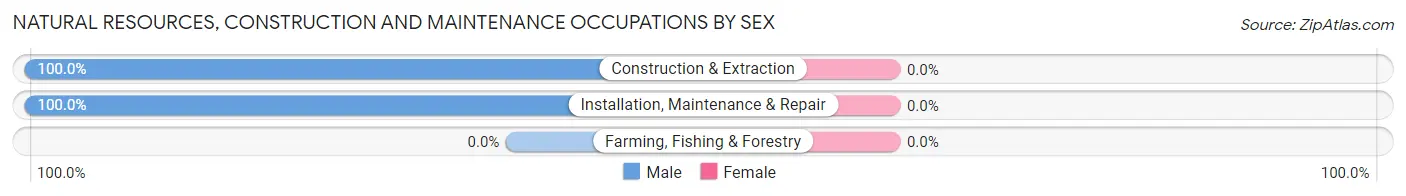
| Occupation | Male | Female |
| Farming, Fishing & Forestry | 0 (0.0%) | 0 (0.0%) |
| Construction & Extraction | 63 (100.0%) | 0 (0.0%) |
| Installation, Maintenance & Repair | 23 (100.0%) | 0 (0.0%) |
| Total (Category) | 86 (100.0%) | 0 (0.0%) |
| Total (Overall) | 402 (49.0%) | 419 (51.0%) |
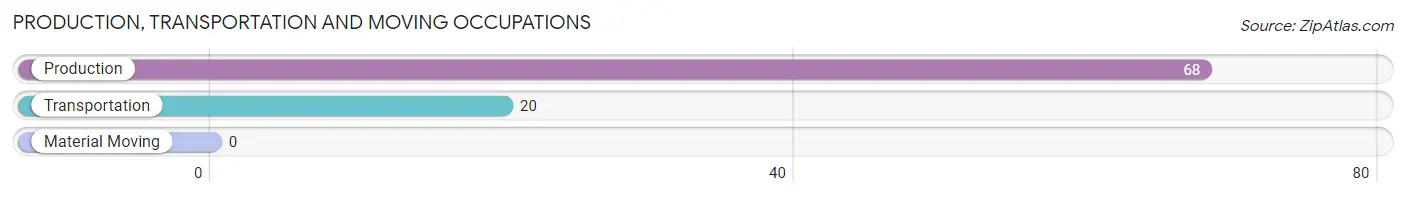
Production, Transportation and Moving Occupations
The most common Production, Transportation and Moving occupations in Harmony are Production (68 | 8.3%), and Transportation (20 | 2.4%).
Production, Transportation and Moving Occupations by Sex
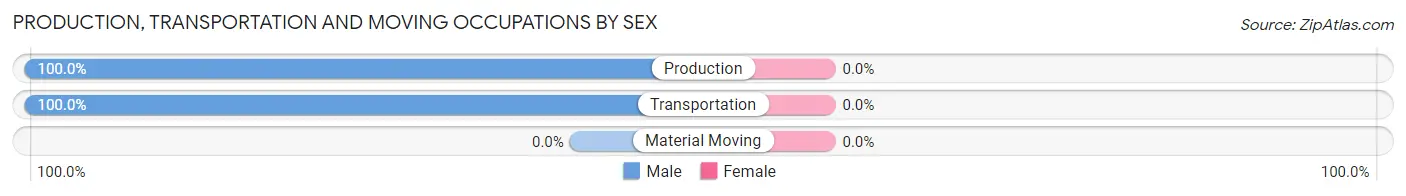
| Occupation | Male | Female |
| Production | 68 (100.0%) | 0 (0.0%) |
| Transportation | 20 (100.0%) | 0 (0.0%) |
| Material Moving | 0 (0.0%) | 0 (0.0%) |
| Total (Category) | 88 (100.0%) | 0 (0.0%) |
| Total (Overall) | 402 (49.0%) | 419 (51.0%) |
Employment Industries by Sex in Harmony
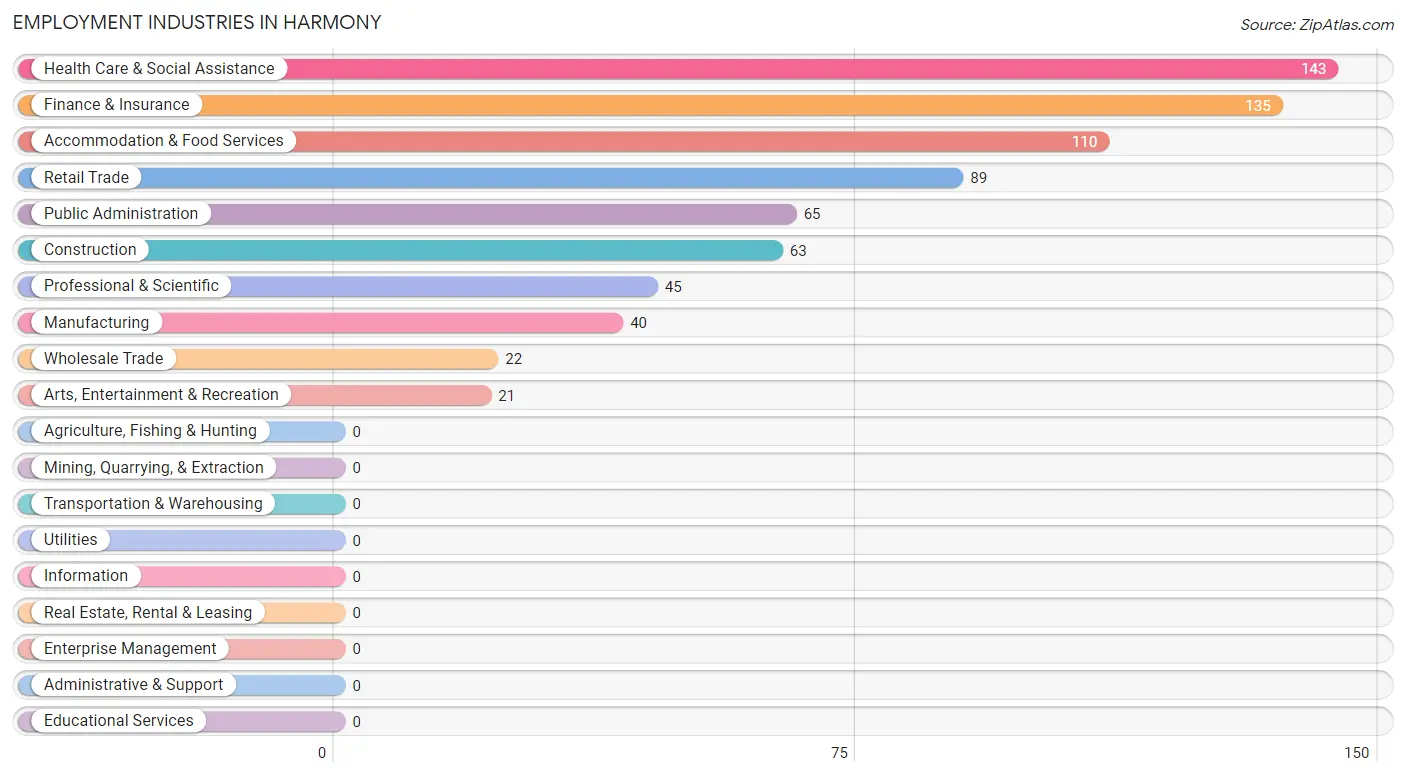
Employment Industries in Harmony
The major employment industries in Harmony include Health Care & Social Assistance (143 | 17.4%), Finance & Insurance (135 | 16.4%), Accommodation & Food Services (110 | 13.4%), Retail Trade (89 | 10.8%), and Public Administration (65 | 7.9%).
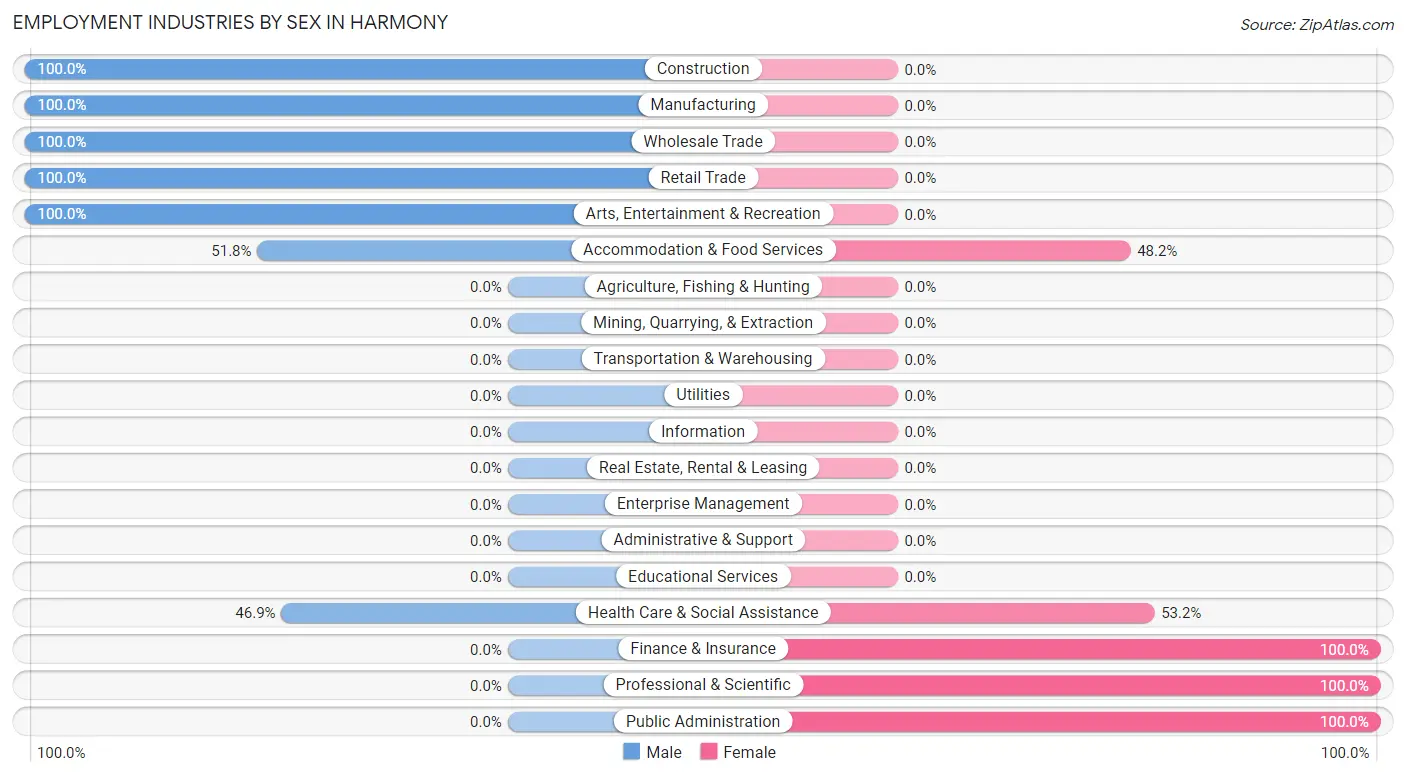
Employment Industries by Sex in Harmony
The Harmony industries that see more men than women are Construction (100.0%), Manufacturing (100.0%), and Wholesale Trade (100.0%), whereas the industries that tend to have a higher number of women are Finance & Insurance (100.0%), Professional & Scientific (100.0%), and Public Administration (100.0%).
| Industry | Male | Female |
| Agriculture, Fishing & Hunting | 0 (0.0%) | 0 (0.0%) |
| Mining, Quarrying, & Extraction | 0 (0.0%) | 0 (0.0%) |
| Construction | 63 (100.0%) | 0 (0.0%) |
| Manufacturing | 40 (100.0%) | 0 (0.0%) |
| Wholesale Trade | 22 (100.0%) | 0 (0.0%) |
| Retail Trade | 89 (100.0%) | 0 (0.0%) |
| Transportation & Warehousing | 0 (0.0%) | 0 (0.0%) |
| Utilities | 0 (0.0%) | 0 (0.0%) |
| Information | 0 (0.0%) | 0 (0.0%) |
| Finance & Insurance | 0 (0.0%) | 135 (100.0%) |
| Real Estate, Rental & Leasing | 0 (0.0%) | 0 (0.0%) |
| Professional & Scientific | 0 (0.0%) | 45 (100.0%) |
| Enterprise Management | 0 (0.0%) | 0 (0.0%) |
| Administrative & Support | 0 (0.0%) | 0 (0.0%) |
| Educational Services | 0 (0.0%) | 0 (0.0%) |
| Health Care & Social Assistance | 67 (46.9%) | 76 (53.1%) |
| Arts, Entertainment & Recreation | 21 (100.0%) | 0 (0.0%) |
| Accommodation & Food Services | 57 (51.8%) | 53 (48.2%) |
| Public Administration | 0 (0.0%) | 65 (100.0%) |
| Total | 402 (49.0%) | 419 (51.0%) |
Education in Harmony
School Enrollment in Harmony
The most common levels of schooling among the 353 students in Harmony are elementary school (120 | 34.0%), graduate / professional (67 | 19.0%), and middle school (56 | 15.9%).
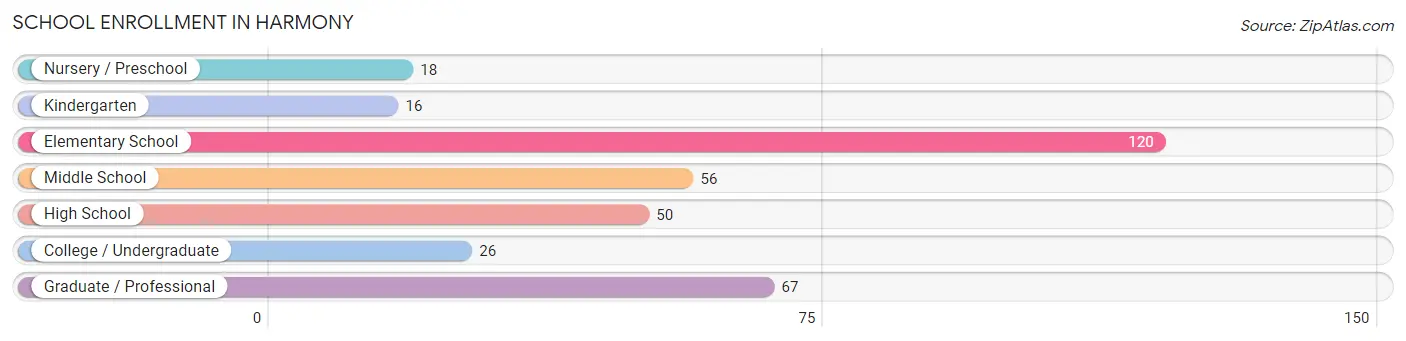
| School Level | # Students | % Students |
| Nursery / Preschool | 18 | 5.1% |
| Kindergarten | 16 | 4.5% |
| Elementary School | 120 | 34.0% |
| Middle School | 56 | 15.9% |
| High School | 50 | 14.2% |
| College / Undergraduate | 26 | 7.4% |
| Graduate / Professional | 67 | 19.0% |
| Total | 353 | 100.0% |
School Enrollment by Age by Funding Source in Harmony
Out of a total of 353 students who are enrolled in schools in Harmony, 199 (56.4%) attend a private institution, while the remaining 154 (43.6%) are enrolled in public schools. The age group of 35 years and over has the highest likelihood of being enrolled in private schools, with 67 (100.0% in the age bracket) enrolled. Conversely, the age group of 3 to 4 year olds has the lowest likelihood of being enrolled in a private school, with 18 (100.0% in the age bracket) attending a public institution.
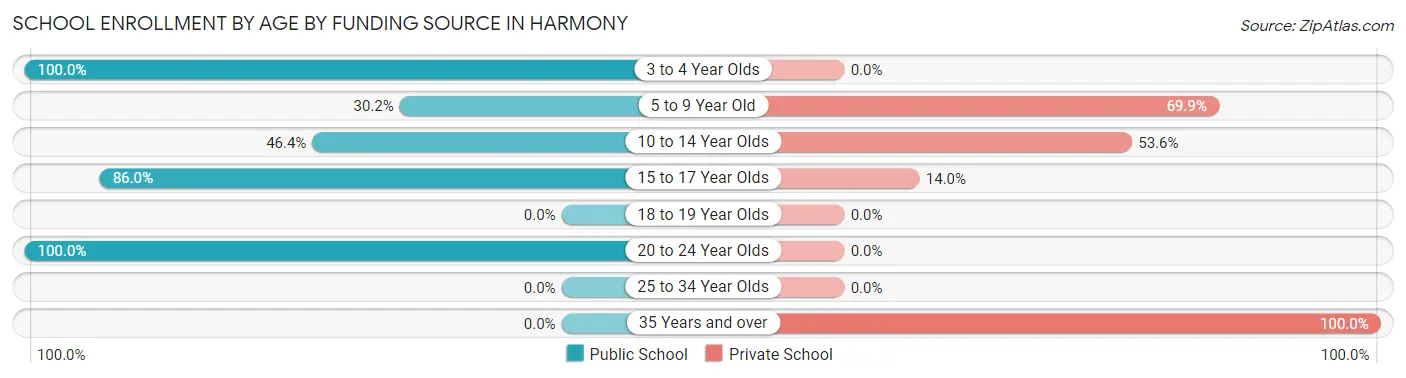
| Age Bracket | Public School | Private School |
| 3 to 4 Year Olds | 18 (100.0%) | 0 (0.0%) |
| 5 to 9 Year Old | 41 (30.1%) | 95 (69.9%) |
| 10 to 14 Year Olds | 26 (46.4%) | 30 (53.6%) |
| 15 to 17 Year Olds | 43 (86.0%) | 7 (14.0%) |
| 18 to 19 Year Olds | 0 (0.0%) | 0 (0.0%) |
| 20 to 24 Year Olds | 26 (100.0%) | 0 (0.0%) |
| 25 to 34 Year Olds | 0 (0.0%) | 0 (0.0%) |
| 35 Years and over | 0 (0.0%) | 67 (100.0%) |
| Total | 154 (43.6%) | 199 (56.4%) |
Educational Attainment by Field of Study in Harmony
Psychology (91 | 24.7%), science & technology (87 | 23.6%), business (47 | 12.8%), liberal arts & history (35 | 9.5%), and computers & mathematics (31 | 8.4%) are the most common fields of study among 368 individuals in Harmony who have obtained a bachelor's degree or higher.
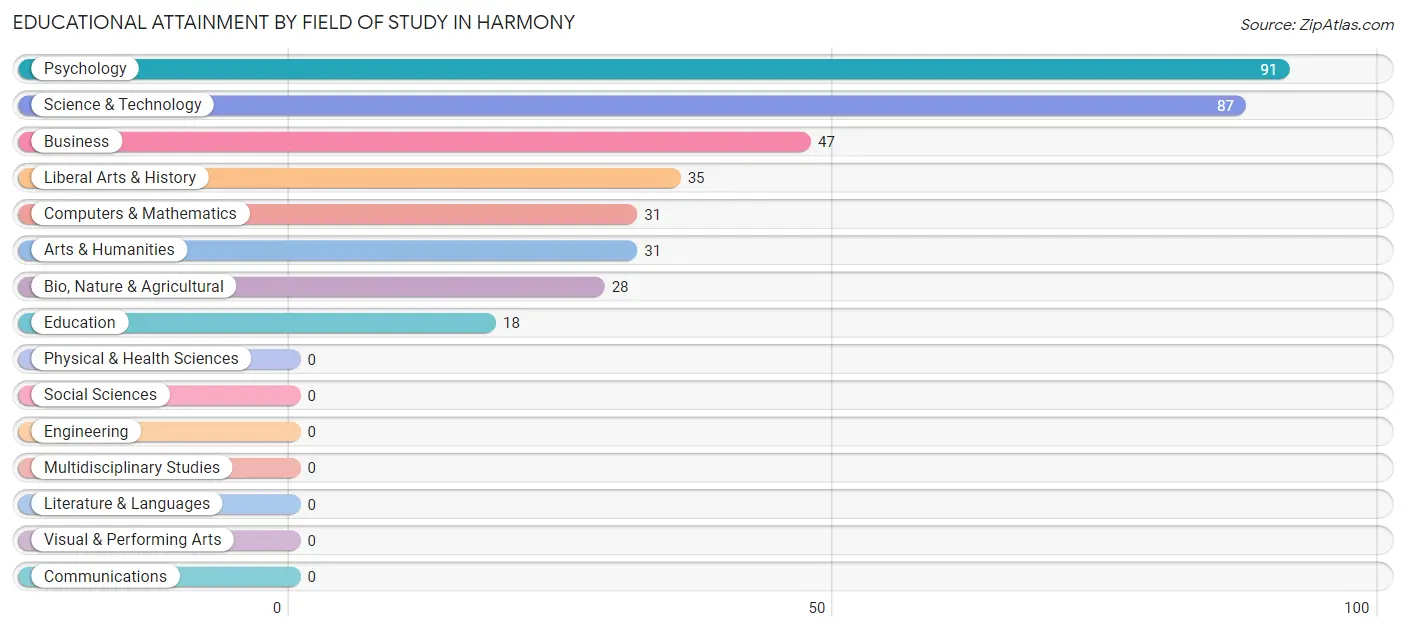
| Field of Study | # Graduates | % Graduates |
| Computers & Mathematics | 31 | 8.4% |
| Bio, Nature & Agricultural | 28 | 7.6% |
| Physical & Health Sciences | 0 | 0.0% |
| Psychology | 91 | 24.7% |
| Social Sciences | 0 | 0.0% |
| Engineering | 0 | 0.0% |
| Multidisciplinary Studies | 0 | 0.0% |
| Science & Technology | 87 | 23.6% |
| Business | 47 | 12.8% |
| Education | 18 | 4.9% |
| Literature & Languages | 0 | 0.0% |
| Liberal Arts & History | 35 | 9.5% |
| Visual & Performing Arts | 0 | 0.0% |
| Communications | 0 | 0.0% |
| Arts & Humanities | 31 | 8.4% |
| Total | 368 | 100.0% |
Transportation & Commute in Harmony
Vehicle Availability by Sex in Harmony
The most prevalent vehicle ownership categories in Harmony are males with 3 vehicles (211, accounting for 52.5%) and females with 3 vehicles (218, making up 50.4%).
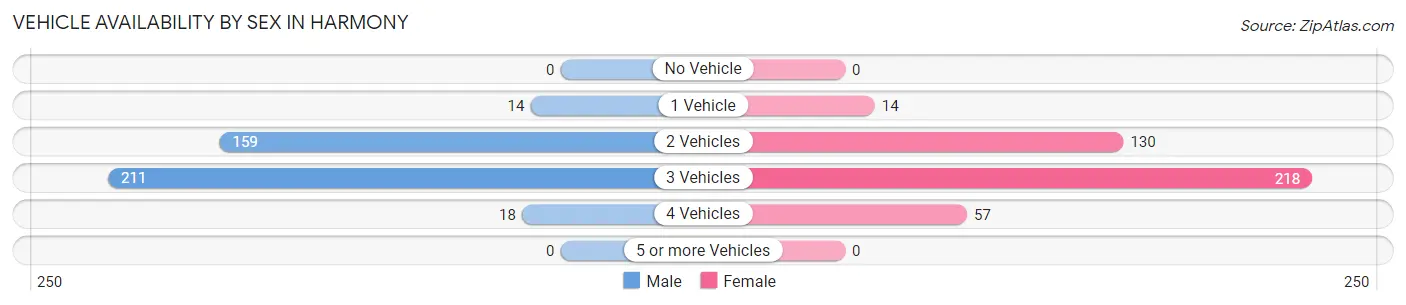
| Vehicles Available | Male | Female |
| No Vehicle | 0 (0.0%) | 0 (0.0%) |
| 1 Vehicle | 14 (3.5%) | 14 (3.3%) |
| 2 Vehicles | 159 (39.6%) | 130 (31.0%) |
| 3 Vehicles | 211 (52.5%) | 218 (52.0%) |
| 4 Vehicles | 18 (4.5%) | 57 (13.6%) |
| 5 or more Vehicles | 0 (0.0%) | 0 (0.0%) |
| Total | 402 (100.0%) | 419 (100.0%) |
Commute Time in Harmony
The most frequently occuring commute durations in Harmony are 25 to 29 minutes (180 commuters, 22.8%), 10 to 14 minutes (132 commuters, 16.7%), and 30 to 34 minutes (131 commuters, 16.6%).
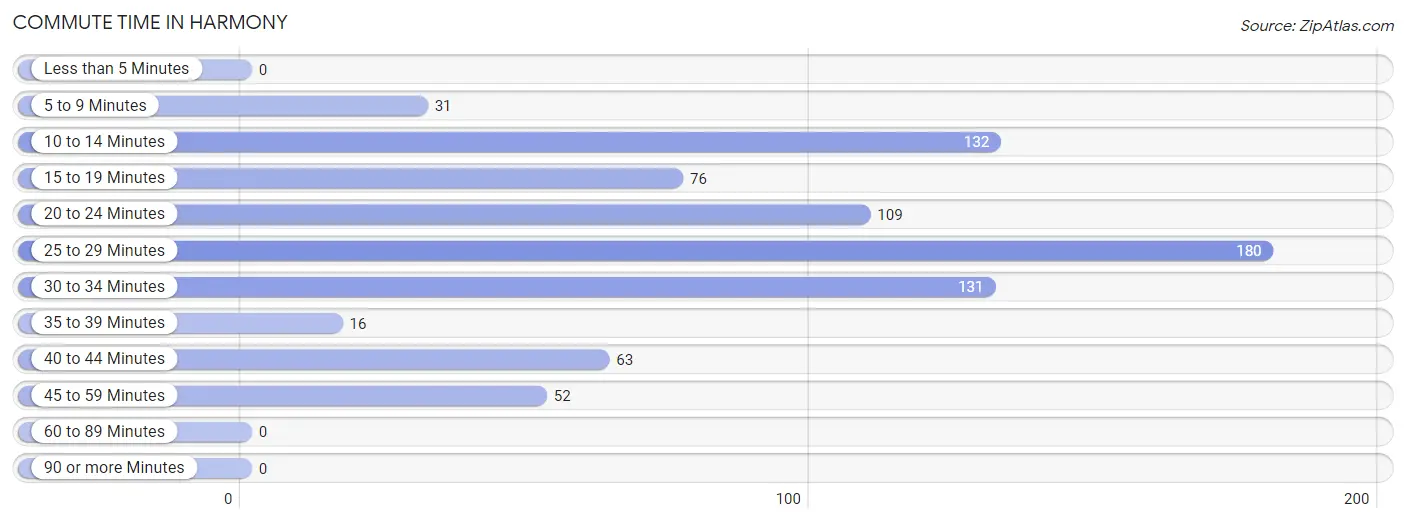
| Commute Time | # Commuters | % Commuters |
| Less than 5 Minutes | 0 | 0.0% |
| 5 to 9 Minutes | 31 | 3.9% |
| 10 to 14 Minutes | 132 | 16.7% |
| 15 to 19 Minutes | 76 | 9.6% |
| 20 to 24 Minutes | 109 | 13.8% |
| 25 to 29 Minutes | 180 | 22.8% |
| 30 to 34 Minutes | 131 | 16.6% |
| 35 to 39 Minutes | 16 | 2.0% |
| 40 to 44 Minutes | 63 | 8.0% |
| 45 to 59 Minutes | 52 | 6.6% |
| 60 to 89 Minutes | 0 | 0.0% |
| 90 or more Minutes | 0 | 0.0% |
Commute Time by Sex in Harmony
The most common commute times in Harmony are 25 to 29 minutes (119 commuters, 29.6%) for males and 15 to 19 minutes (76 commuters, 19.6%) for females.
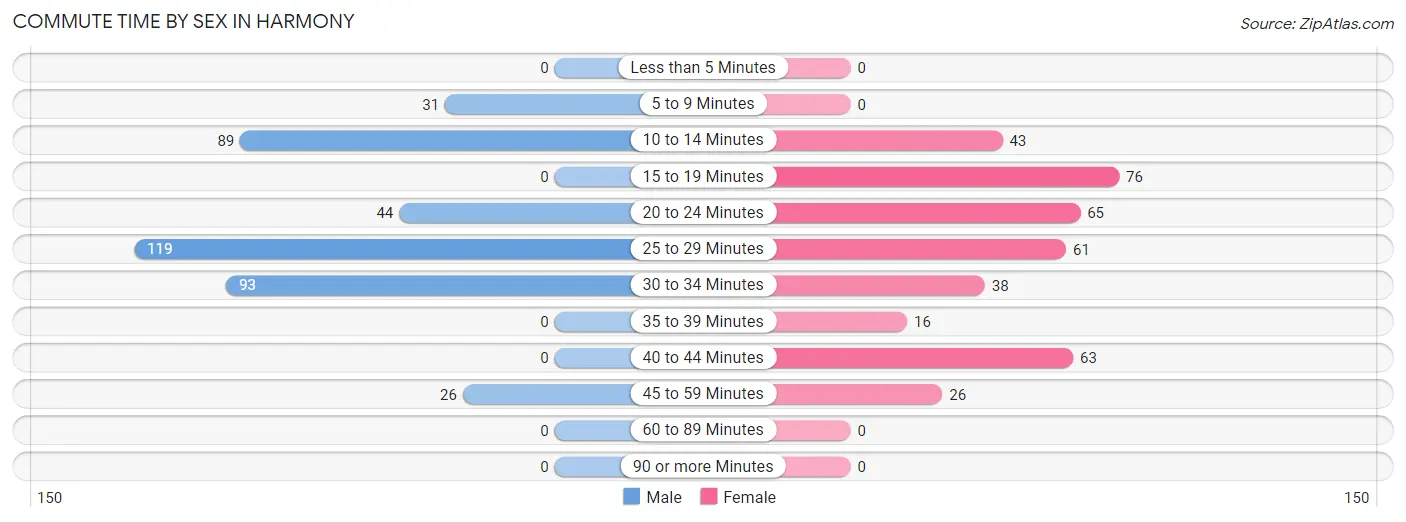
| Commute Time | Male | Female |
| Less than 5 Minutes | 0 (0.0%) | 0 (0.0%) |
| 5 to 9 Minutes | 31 (7.7%) | 0 (0.0%) |
| 10 to 14 Minutes | 89 (22.1%) | 43 (11.1%) |
| 15 to 19 Minutes | 0 (0.0%) | 76 (19.6%) |
| 20 to 24 Minutes | 44 (11.0%) | 65 (16.8%) |
| 25 to 29 Minutes | 119 (29.6%) | 61 (15.7%) |
| 30 to 34 Minutes | 93 (23.1%) | 38 (9.8%) |
| 35 to 39 Minutes | 0 (0.0%) | 16 (4.1%) |
| 40 to 44 Minutes | 0 (0.0%) | 63 (16.2%) |
| 45 to 59 Minutes | 26 (6.5%) | 26 (6.7%) |
| 60 to 89 Minutes | 0 (0.0%) | 0 (0.0%) |
| 90 or more Minutes | 0 (0.0%) | 0 (0.0%) |
Time of Departure to Work by Sex in Harmony
The most frequent times of departure to work in Harmony are 7:30 AM to 7:59 AM (70, 17.4%) for males and 8:30 AM to 8:59 AM (88, 22.7%) for females.
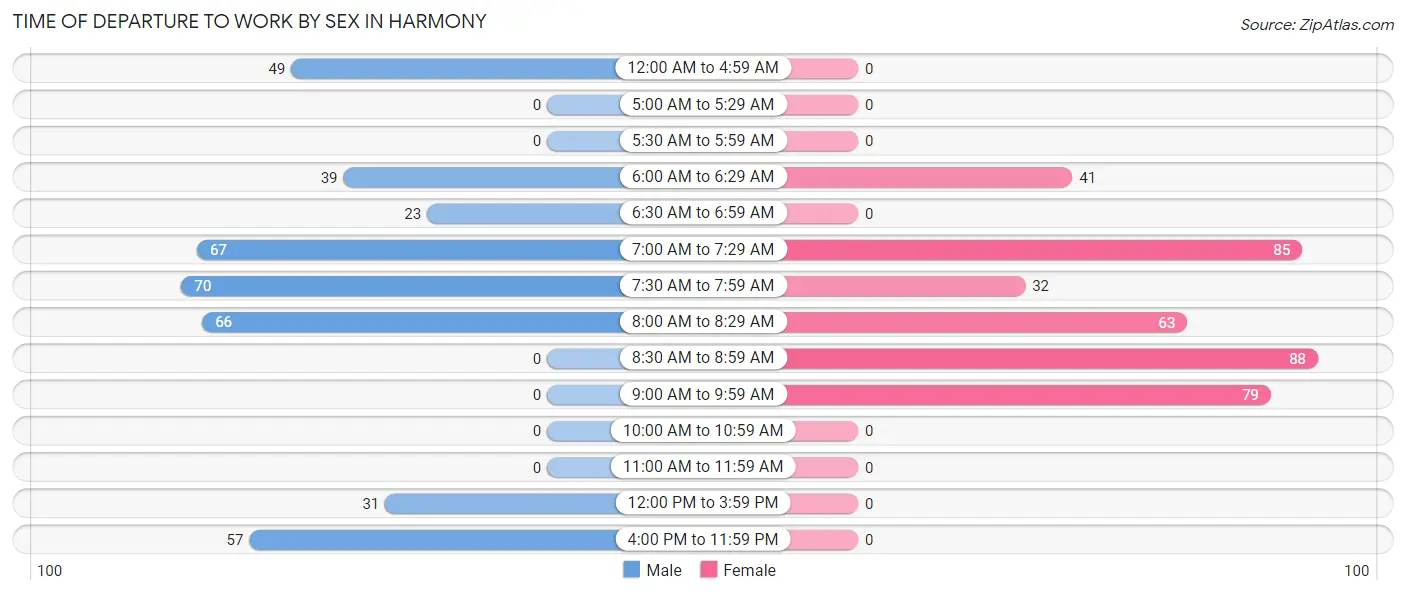
| Time of Departure | Male | Female |
| 12:00 AM to 4:59 AM | 49 (12.2%) | 0 (0.0%) |
| 5:00 AM to 5:29 AM | 0 (0.0%) | 0 (0.0%) |
| 5:30 AM to 5:59 AM | 0 (0.0%) | 0 (0.0%) |
| 6:00 AM to 6:29 AM | 39 (9.7%) | 41 (10.6%) |
| 6:30 AM to 6:59 AM | 23 (5.7%) | 0 (0.0%) |
| 7:00 AM to 7:29 AM | 67 (16.7%) | 85 (21.9%) |
| 7:30 AM to 7:59 AM | 70 (17.4%) | 32 (8.3%) |
| 8:00 AM to 8:29 AM | 66 (16.4%) | 63 (16.2%) |
| 8:30 AM to 8:59 AM | 0 (0.0%) | 88 (22.7%) |
| 9:00 AM to 9:59 AM | 0 (0.0%) | 79 (20.4%) |
| 10:00 AM to 10:59 AM | 0 (0.0%) | 0 (0.0%) |
| 11:00 AM to 11:59 AM | 0 (0.0%) | 0 (0.0%) |
| 12:00 PM to 3:59 PM | 31 (7.7%) | 0 (0.0%) |
| 4:00 PM to 11:59 PM | 57 (14.2%) | 0 (0.0%) |
| Total | 402 (100.0%) | 388 (100.0%) |
Housing Occupancy in Harmony
Occupancy by Ownership in Harmony
Of the total 474 dwellings in Harmony, owner-occupied units account for 431 (90.9%), while renter-occupied units make up 43 (9.1%).
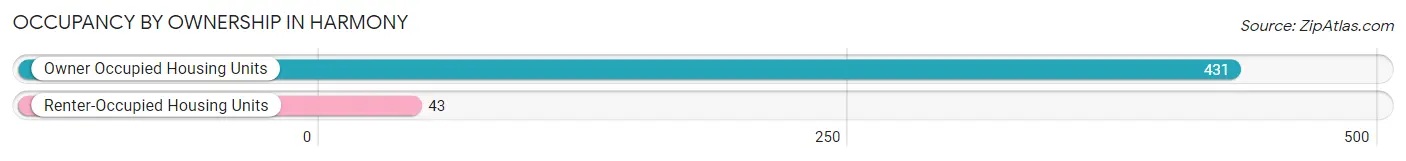
| Occupancy | # Housing Units | % Housing Units |
| Owner Occupied Housing Units | 431 | 90.9% |
| Renter-Occupied Housing Units | 43 | 9.1% |
| Total Occupied Housing Units | 474 | 100.0% |
Occupancy by Household Size in Harmony
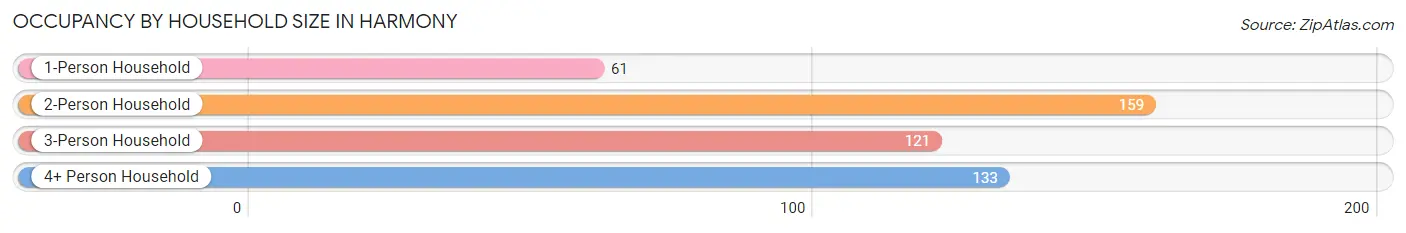
| Household Size | # Housing Units | % Housing Units |
| 1-Person Household | 61 | 12.9% |
| 2-Person Household | 159 | 33.5% |
| 3-Person Household | 121 | 25.5% |
| 4+ Person Household | 133 | 28.1% |
| Total Housing Units | 474 | 100.0% |
Occupancy by Ownership by Household Size in Harmony
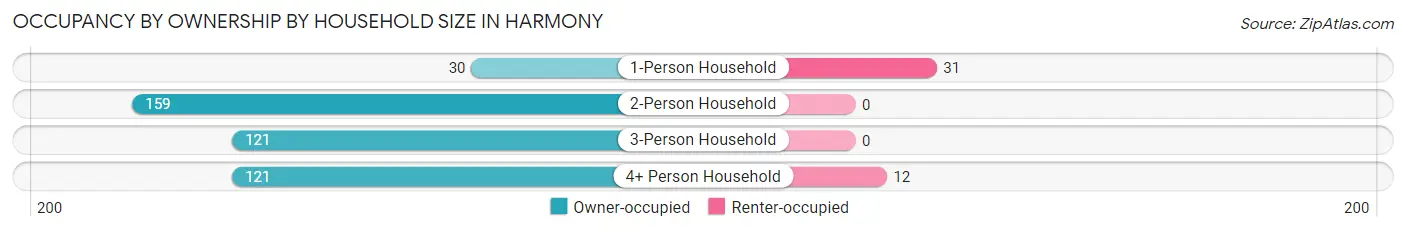
| Household Size | Owner-occupied | Renter-occupied |
| 1-Person Household | 30 (49.2%) | 31 (50.8%) |
| 2-Person Household | 159 (100.0%) | 0 (0.0%) |
| 3-Person Household | 121 (100.0%) | 0 (0.0%) |
| 4+ Person Household | 121 (91.0%) | 12 (9.0%) |
| Total Housing Units | 431 (90.9%) | 43 (9.1%) |
Occupancy by Educational Attainment in Harmony
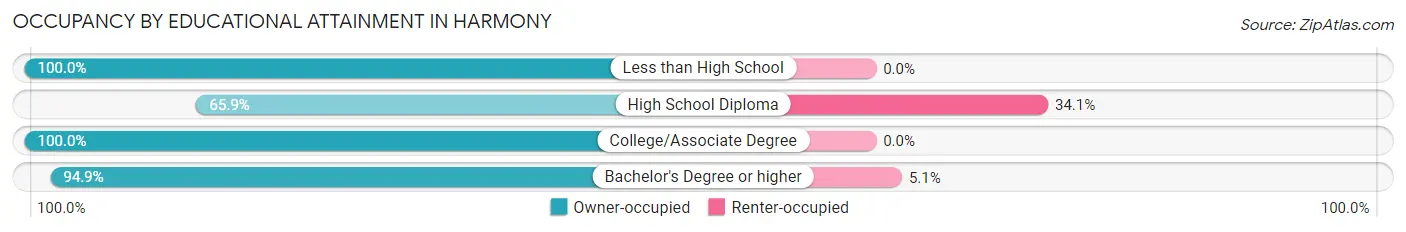
| Household Size | Owner-occupied | Renter-occupied |
| Less than High School | 40 (100.0%) | 0 (0.0%) |
| High School Diploma | 60 (65.9%) | 31 (34.1%) |
| College/Associate Degree | 108 (100.0%) | 0 (0.0%) |
| Bachelor's Degree or higher | 223 (94.9%) | 12 (5.1%) |
Occupancy by Age of Householder in Harmony
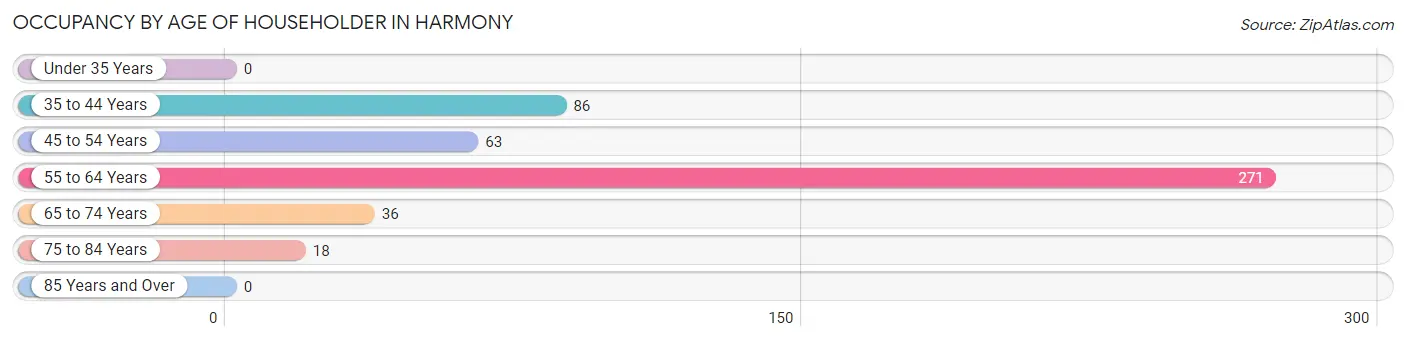
| Age Bracket | # Households | % Households |
| Under 35 Years | 0 | 0.0% |
| 35 to 44 Years | 86 | 18.1% |
| 45 to 54 Years | 63 | 13.3% |
| 55 to 64 Years | 271 | 57.2% |
| 65 to 74 Years | 36 | 7.6% |
| 75 to 84 Years | 18 | 3.8% |
| 85 Years and Over | 0 | 0.0% |
| Total | 474 | 100.0% |
Housing Finances in Harmony
Median Income by Occupancy in Harmony
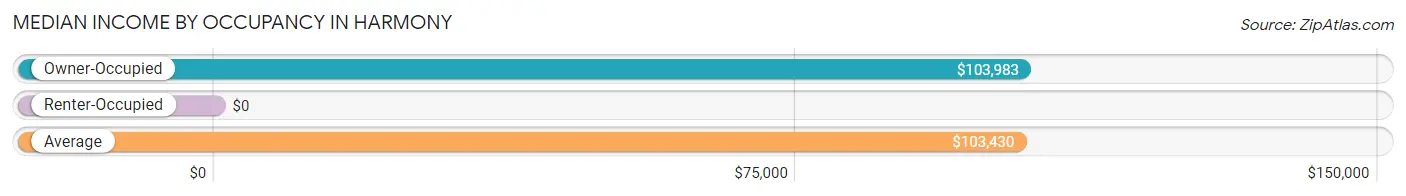
| Occupancy Type | # Households | Median Income |
| Owner-Occupied | 431 (90.9%) | $103,983 |
| Renter-Occupied | 43 (9.1%) | $0 |
| Average | 474 (100.0%) | $103,430 |
Occupancy by Householder Income Bracket in Harmony
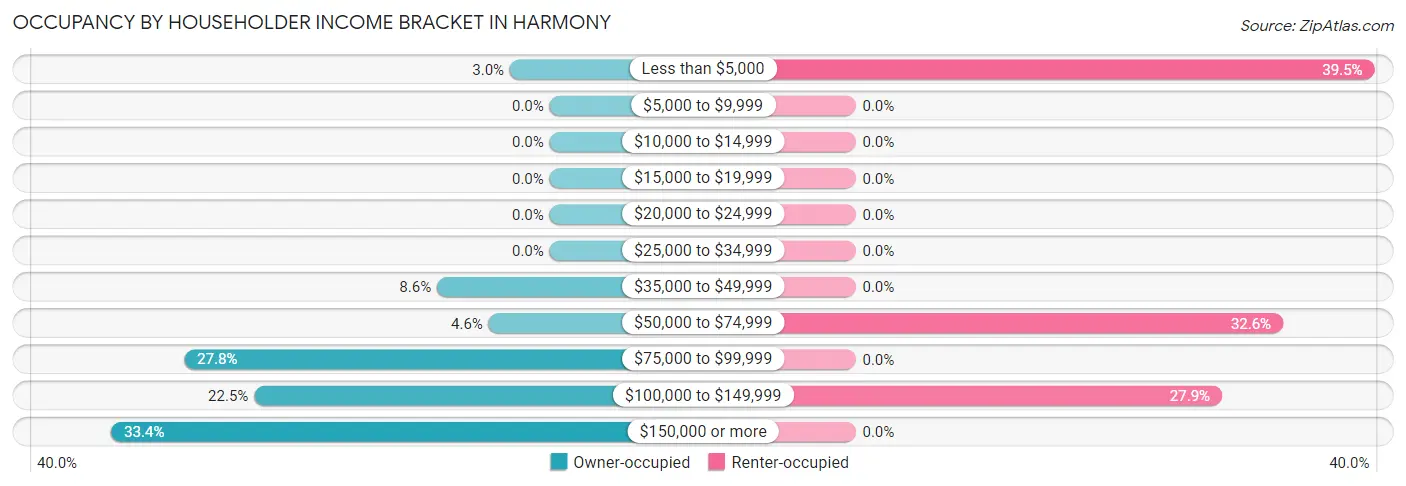
| Income Bracket | Owner-occupied | Renter-occupied |
| Less than $5,000 | 13 (3.0%) | 17 (39.5%) |
| $5,000 to $9,999 | 0 (0.0%) | 0 (0.0%) |
| $10,000 to $14,999 | 0 (0.0%) | 0 (0.0%) |
| $15,000 to $19,999 | 0 (0.0%) | 0 (0.0%) |
| $20,000 to $24,999 | 0 (0.0%) | 0 (0.0%) |
| $25,000 to $34,999 | 0 (0.0%) | 0 (0.0%) |
| $35,000 to $49,999 | 37 (8.6%) | 0 (0.0%) |
| $50,000 to $74,999 | 20 (4.6%) | 14 (32.6%) |
| $75,000 to $99,999 | 120 (27.8%) | 0 (0.0%) |
| $100,000 to $149,999 | 97 (22.5%) | 12 (27.9%) |
| $150,000 or more | 144 (33.4%) | 0 (0.0%) |
| Total | 431 (100.0%) | 43 (100.0%) |
Monthly Housing Cost Tiers in Harmony
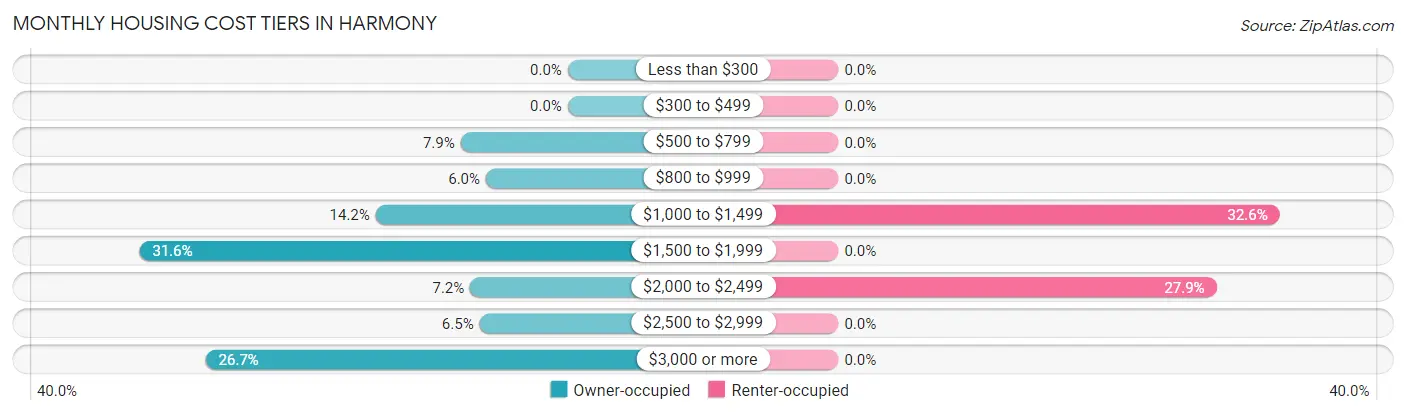
| Monthly Cost | Owner-occupied | Renter-occupied |
| Less than $300 | 0 (0.0%) | 0 (0.0%) |
| $300 to $499 | 0 (0.0%) | 0 (0.0%) |
| $500 to $799 | 34 (7.9%) | 0 (0.0%) |
| $800 to $999 | 26 (6.0%) | 0 (0.0%) |
| $1,000 to $1,499 | 61 (14.1%) | 14 (32.6%) |
| $1,500 to $1,999 | 136 (31.6%) | 0 (0.0%) |
| $2,000 to $2,499 | 31 (7.2%) | 12 (27.9%) |
| $2,500 to $2,999 | 28 (6.5%) | 0 (0.0%) |
| $3,000 or more | 115 (26.7%) | 0 (0.0%) |
| Total | 431 (100.0%) | 43 (100.0%) |
Physical Housing Characteristics in Harmony
Housing Structures in Harmony
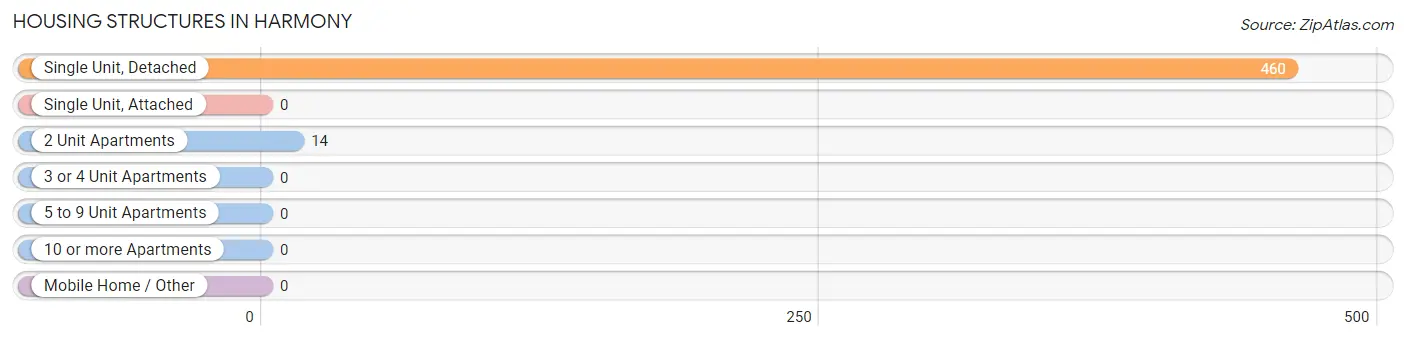
| Structure Type | # Housing Units | % Housing Units |
| Single Unit, Detached | 460 | 97.1% |
| Single Unit, Attached | 0 | 0.0% |
| 2 Unit Apartments | 14 | 2.9% |
| 3 or 4 Unit Apartments | 0 | 0.0% |
| 5 to 9 Unit Apartments | 0 | 0.0% |
| 10 or more Apartments | 0 | 0.0% |
| Mobile Home / Other | 0 | 0.0% |
| Total | 474 | 100.0% |
Housing Structures by Occupancy in Harmony
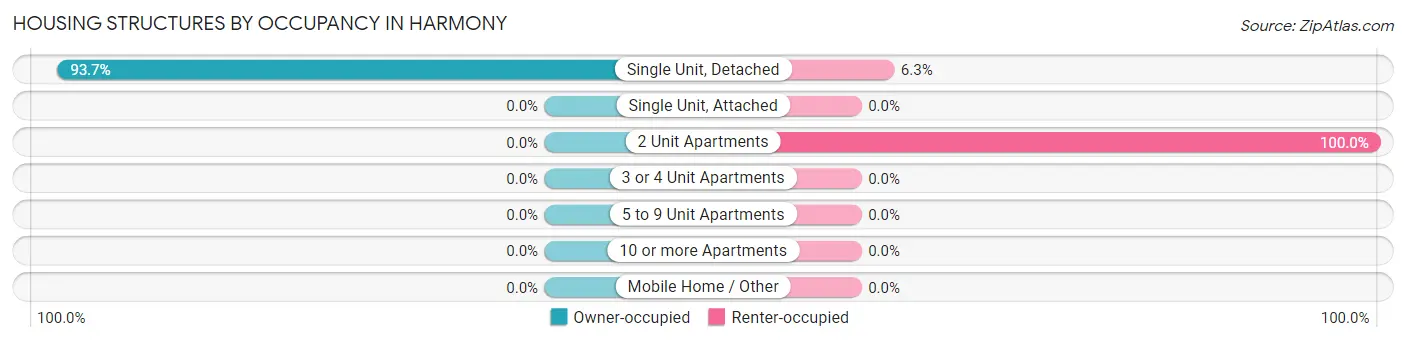
| Structure Type | Owner-occupied | Renter-occupied |
| Single Unit, Detached | 431 (93.7%) | 29 (6.3%) |
| Single Unit, Attached | 0 (0.0%) | 0 (0.0%) |
| 2 Unit Apartments | 0 (0.0%) | 14 (100.0%) |
| 3 or 4 Unit Apartments | 0 (0.0%) | 0 (0.0%) |
| 5 to 9 Unit Apartments | 0 (0.0%) | 0 (0.0%) |
| 10 or more Apartments | 0 (0.0%) | 0 (0.0%) |
| Mobile Home / Other | 0 (0.0%) | 0 (0.0%) |
| Total | 431 (90.9%) | 43 (9.1%) |
Housing Structures by Number of Rooms in Harmony
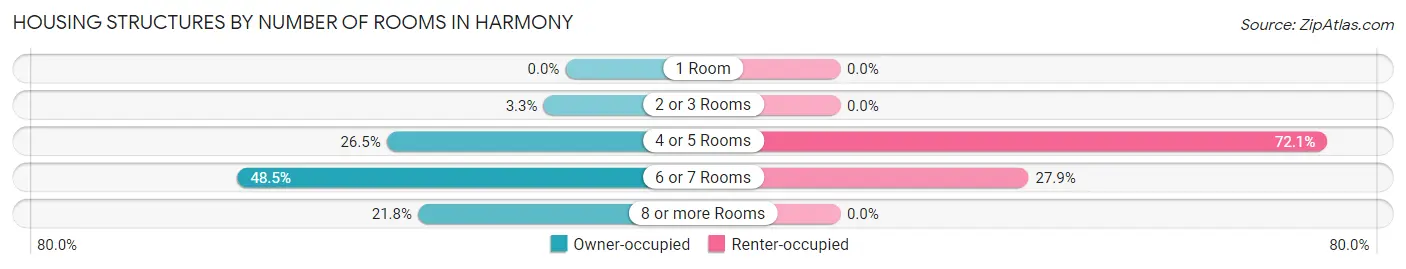
| Number of Rooms | Owner-occupied | Renter-occupied |
| 1 Room | 0 (0.0%) | 0 (0.0%) |
| 2 or 3 Rooms | 14 (3.3%) | 0 (0.0%) |
| 4 or 5 Rooms | 114 (26.5%) | 31 (72.1%) |
| 6 or 7 Rooms | 209 (48.5%) | 12 (27.9%) |
| 8 or more Rooms | 94 (21.8%) | 0 (0.0%) |
| Total | 431 (100.0%) | 43 (100.0%) |
Housing Structure by Heating Type in Harmony
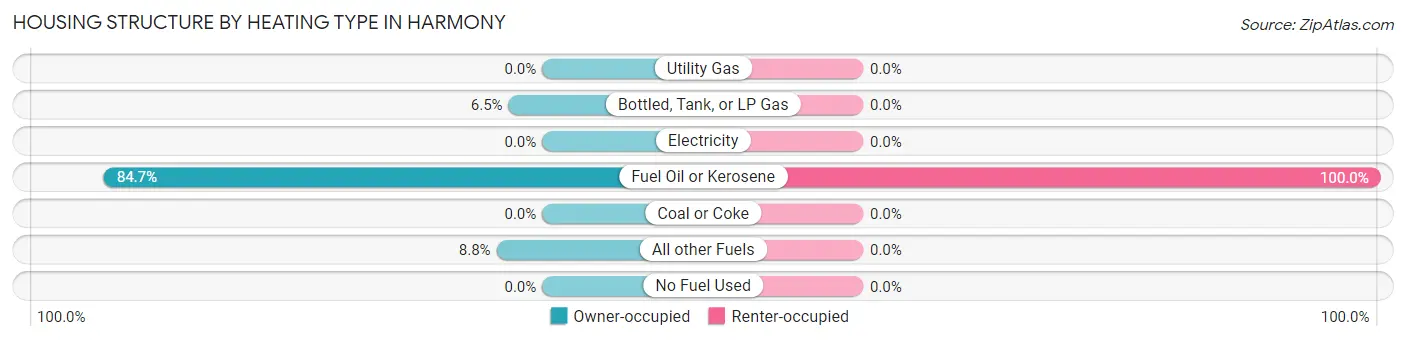
| Heating Type | Owner-occupied | Renter-occupied |
| Utility Gas | 0 (0.0%) | 0 (0.0%) |
| Bottled, Tank, or LP Gas | 28 (6.5%) | 0 (0.0%) |
| Electricity | 0 (0.0%) | 0 (0.0%) |
| Fuel Oil or Kerosene | 365 (84.7%) | 43 (100.0%) |
| Coal or Coke | 0 (0.0%) | 0 (0.0%) |
| All other Fuels | 38 (8.8%) | 0 (0.0%) |
| No Fuel Used | 0 (0.0%) | 0 (0.0%) |
| Total | 431 (100.0%) | 43 (100.0%) |
Household Vehicle Usage in Harmony
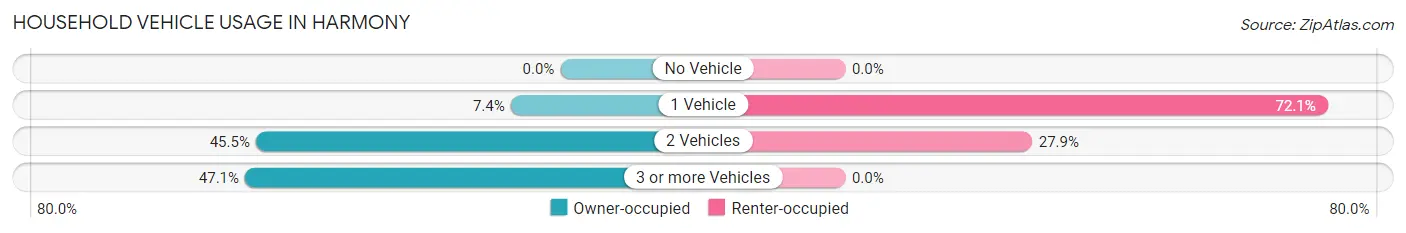
| Vehicles per Household | Owner-occupied | Renter-occupied |
| No Vehicle | 0 (0.0%) | 0 (0.0%) |
| 1 Vehicle | 32 (7.4%) | 31 (72.1%) |
| 2 Vehicles | 196 (45.5%) | 12 (27.9%) |
| 3 or more Vehicles | 203 (47.1%) | 0 (0.0%) |
| Total | 431 (100.0%) | 43 (100.0%) |
Real Estate & Mortgages in Harmony
Real Estate and Mortgage Overview in Harmony
| Characteristic | Without Mortgage | With Mortgage |
| Housing Units | 42 | 389 |
| Median Property Value | - | - |
| Median Household Income | - | - |
| Monthly Housing Costs | - | - |
| Real Estate Taxes | - | - |
Property Value by Mortgage Status in Harmony
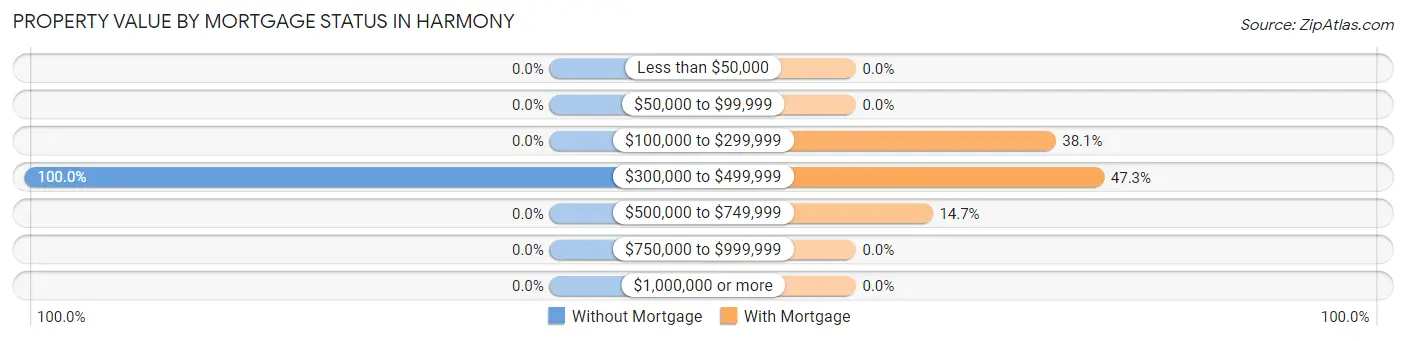
| Property Value | Without Mortgage | With Mortgage |
| Less than $50,000 | 0 (0.0%) | 0 (0.0%) |
| $50,000 to $99,999 | 0 (0.0%) | 0 (0.0%) |
| $100,000 to $299,999 | 0 (0.0%) | 148 (38.1%) |
| $300,000 to $499,999 | 42 (100.0%) | 184 (47.3%) |
| $500,000 to $749,999 | 0 (0.0%) | 57 (14.6%) |
| $750,000 to $999,999 | 0 (0.0%) | 0 (0.0%) |
| $1,000,000 or more | 0 (0.0%) | 0 (0.0%) |
| Total | 42 (100.0%) | 389 (100.0%) |
Household Income by Mortgage Status in Harmony
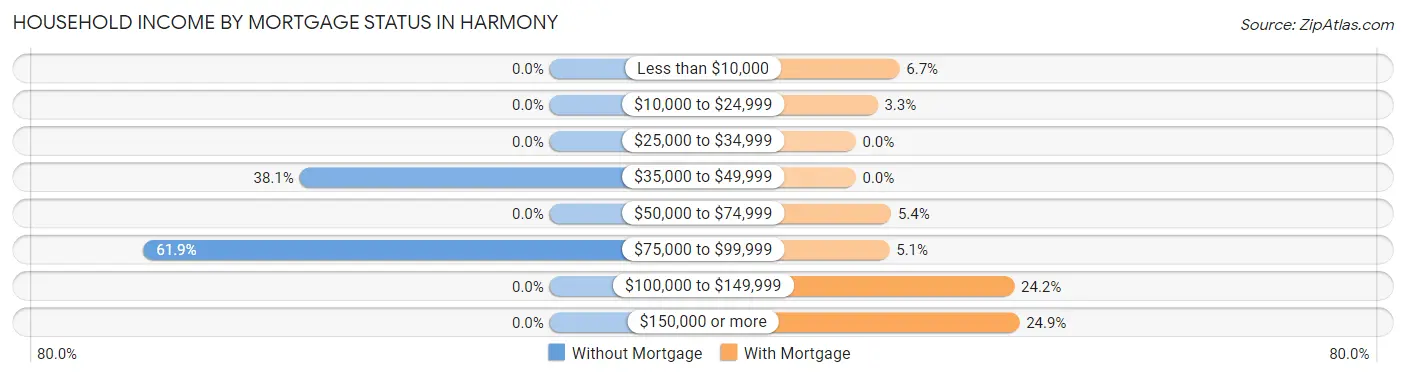
| Household Income | Without Mortgage | With Mortgage |
| Less than $10,000 | 0 (0.0%) | 26 (6.7%) |
| $10,000 to $24,999 | 0 (0.0%) | 13 (3.3%) |
| $25,000 to $34,999 | 0 (0.0%) | 0 (0.0%) |
| $35,000 to $49,999 | 16 (38.1%) | 0 (0.0%) |
| $50,000 to $74,999 | 0 (0.0%) | 21 (5.4%) |
| $75,000 to $99,999 | 26 (61.9%) | 20 (5.1%) |
| $100,000 to $149,999 | 0 (0.0%) | 94 (24.2%) |
| $150,000 or more | 0 (0.0%) | 97 (24.9%) |
| Total | 42 (100.0%) | 389 (100.0%) |
Property Value to Household Income Ratio in Harmony
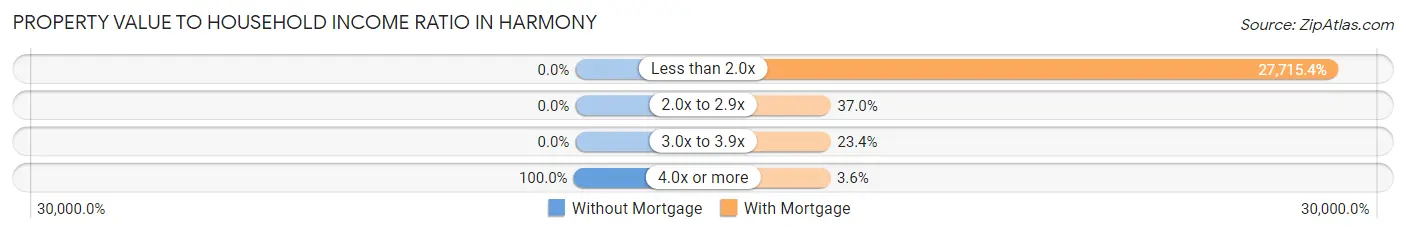
| Value-to-Income Ratio | Without Mortgage | With Mortgage |
| Less than 2.0x | 0 (0.0%) | 107,813 (27,715.4%) |
| 2.0x to 2.9x | 0 (0.0%) | 144 (37.0%) |
| 3.0x to 3.9x | 0 (0.0%) | 91 (23.4%) |
| 4.0x or more | 42 (100.0%) | 14 (3.6%) |
| Total | 42 (100.0%) | 389 (100.0%) |
Real Estate Taxes by Mortgage Status in Harmony
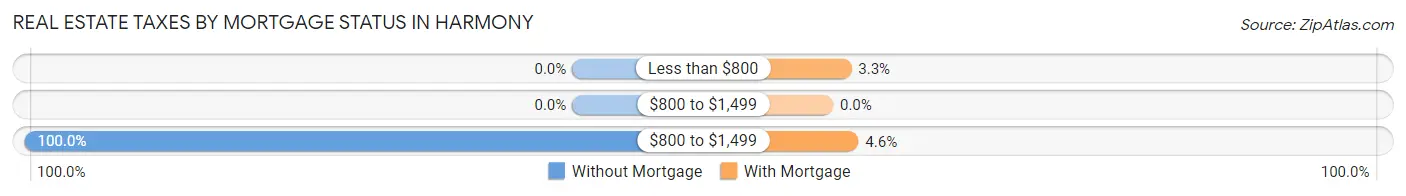
| Property Taxes | Without Mortgage | With Mortgage |
| Less than $800 | 0 (0.0%) | 13 (3.3%) |
| $800 to $1,499 | 0 (0.0%) | 0 (0.0%) |
| $800 to $1,499 | 42 (100.0%) | 18 (4.6%) |
| Total | 42 (100.0%) | 389 (100.0%) |
Health & Disability in Harmony
Health Insurance Coverage by Age in Harmony
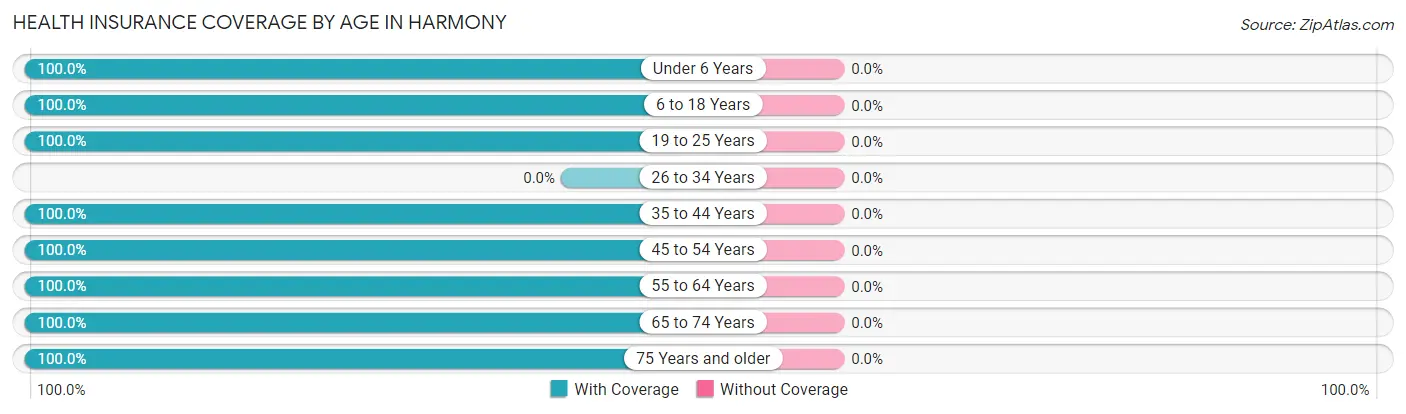
| Age Bracket | With Coverage | Without Coverage |
| Under 6 Years | 47 (100.0%) | 0 (0.0%) |
| 6 to 18 Years | 219 (100.0%) | 0 (0.0%) |
| 19 to 25 Years | 258 (100.0%) | 0 (0.0%) |
| 26 to 34 Years | 0 (0.0%) | 0 (0.0%) |
| 35 to 44 Years | 191 (100.0%) | 0 (0.0%) |
| 45 to 54 Years | 104 (100.0%) | 0 (0.0%) |
| 55 to 64 Years | 477 (100.0%) | 0 (0.0%) |
| 65 to 74 Years | 121 (100.0%) | 0 (0.0%) |
| 75 Years and older | 18 (100.0%) | 0 (0.0%) |
| Total | 1,435 (100.0%) | 0 (0.0%) |
Health Insurance Coverage by Citizenship Status in Harmony
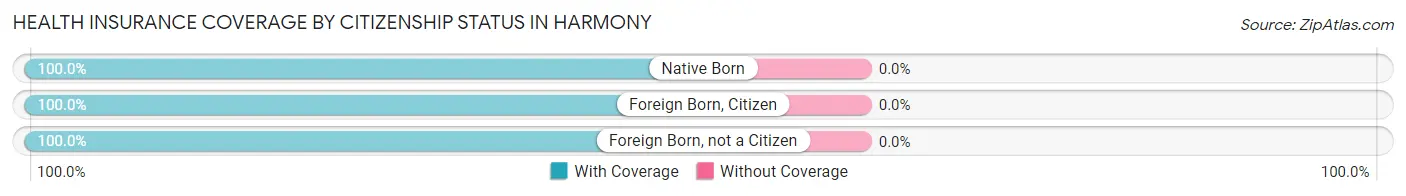
| Citizenship Status | With Coverage | Without Coverage |
| Native Born | 47 (100.0%) | 0 (0.0%) |
| Foreign Born, Citizen | 219 (100.0%) | 0 (0.0%) |
| Foreign Born, not a Citizen | 258 (100.0%) | 0 (0.0%) |
Health Insurance Coverage by Household Income in Harmony
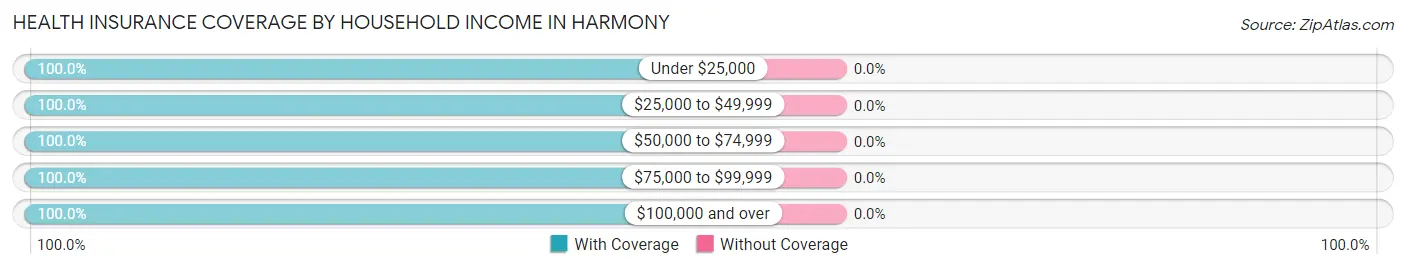
| Household Income | With Coverage | Without Coverage |
| Under $25,000 | 56 (100.0%) | 0 (0.0%) |
| $25,000 to $49,999 | 85 (100.0%) | 0 (0.0%) |
| $50,000 to $74,999 | 54 (100.0%) | 0 (0.0%) |
| $75,000 to $99,999 | 269 (100.0%) | 0 (0.0%) |
| $100,000 and over | 971 (100.0%) | 0 (0.0%) |
Public vs Private Health Insurance Coverage by Age in Harmony
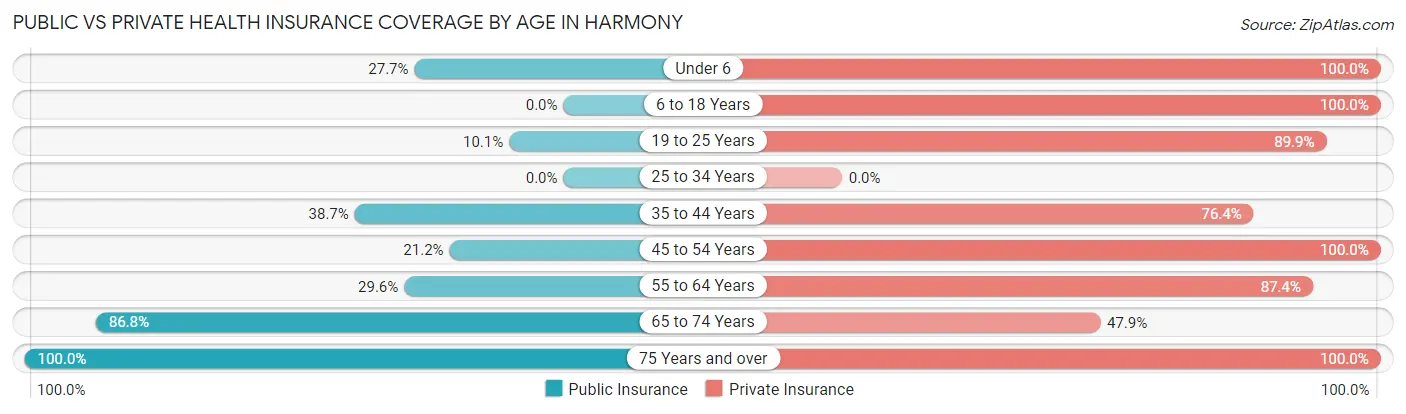
| Age Bracket | Public Insurance | Private Insurance |
| Under 6 | 13 (27.7%) | 47 (100.0%) |
| 6 to 18 Years | 0 (0.0%) | 219 (100.0%) |
| 19 to 25 Years | 26 (10.1%) | 232 (89.9%) |
| 25 to 34 Years | 0 (0.0%) | 0 (0.0%) |
| 35 to 44 Years | 74 (38.7%) | 146 (76.4%) |
| 45 to 54 Years | 22 (21.1%) | 104 (100.0%) |
| 55 to 64 Years | 141 (29.6%) | 417 (87.4%) |
| 65 to 74 Years | 105 (86.8%) | 58 (47.9%) |
| 75 Years and over | 18 (100.0%) | 18 (100.0%) |
| Total | 399 (27.8%) | 1,241 (86.5%) |
Disability Status by Sex by Age in Harmony
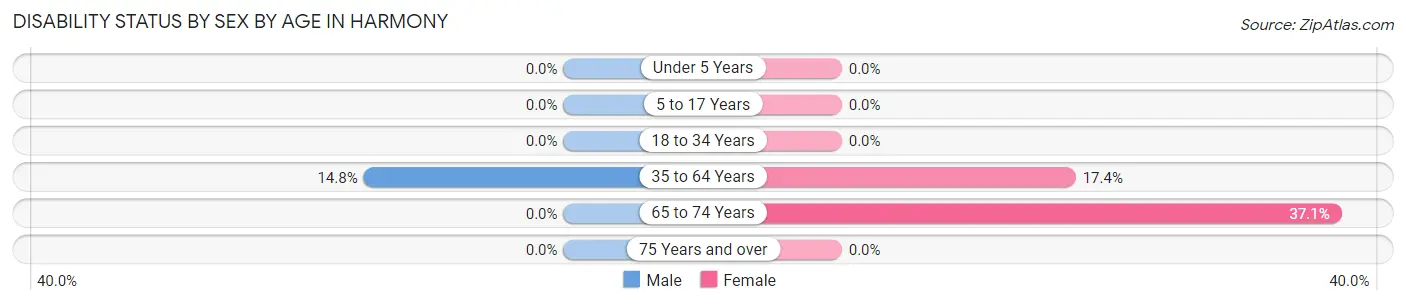
| Age Bracket | Male | Female |
| Under 5 Years | 0 (0.0%) | 0 (0.0%) |
| 5 to 17 Years | 0 (0.0%) | 0 (0.0%) |
| 18 to 34 Years | 0 (0.0%) | 0 (0.0%) |
| 35 to 64 Years | 65 (14.8%) | 58 (17.4%) |
| 65 to 74 Years | 0 (0.0%) | 23 (37.1%) |
| 75 Years and over | 0 (0.0%) | 0 (0.0%) |
Disability Class by Sex by Age in Harmony
Disability Class: Hearing Difficulty
| Age Bracket | Male | Female |
| Under 5 Years | 0 (0.0%) | 0 (0.0%) |
| 5 to 17 Years | 0 (0.0%) | 0 (0.0%) |
| 18 to 34 Years | 0 (0.0%) | 0 (0.0%) |
| 35 to 64 Years | 0 (0.0%) | 0 (0.0%) |
| 65 to 74 Years | 0 (0.0%) | 0 (0.0%) |
| 75 Years and over | 0 (0.0%) | 0 (0.0%) |
Disability Class: Vision Difficulty
| Age Bracket | Male | Female |
| Under 5 Years | 0 (0.0%) | 0 (0.0%) |
| 5 to 17 Years | 0 (0.0%) | 0 (0.0%) |
| 18 to 34 Years | 0 (0.0%) | 0 (0.0%) |
| 35 to 64 Years | 0 (0.0%) | 0 (0.0%) |
| 65 to 74 Years | 0 (0.0%) | 0 (0.0%) |
| 75 Years and over | 0 (0.0%) | 0 (0.0%) |
Disability Class: Cognitive Difficulty
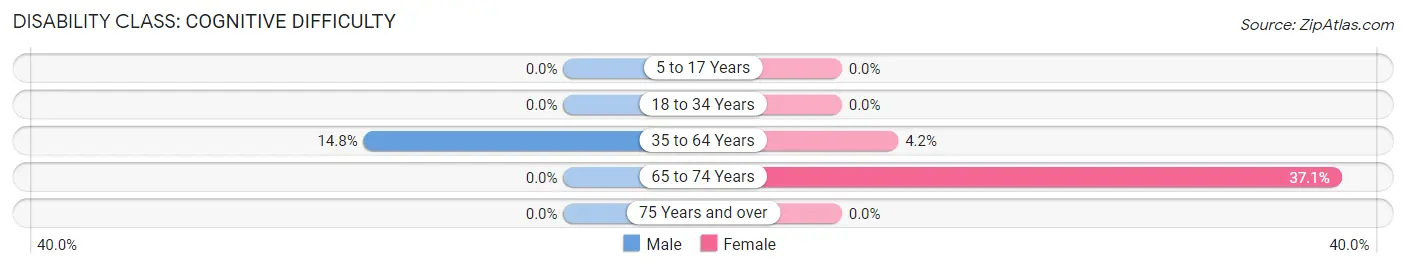
| Age Bracket | Male | Female |
| 5 to 17 Years | 0 (0.0%) | 0 (0.0%) |
| 18 to 34 Years | 0 (0.0%) | 0 (0.0%) |
| 35 to 64 Years | 65 (14.8%) | 14 (4.2%) |
| 65 to 74 Years | 0 (0.0%) | 23 (37.1%) |
| 75 Years and over | 0 (0.0%) | 0 (0.0%) |
Disability Class: Ambulatory Difficulty
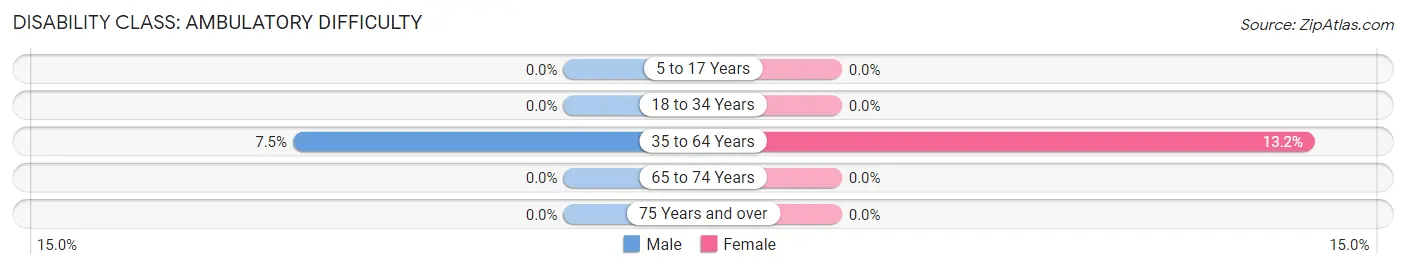
| Age Bracket | Male | Female |
| 5 to 17 Years | 0 (0.0%) | 0 (0.0%) |
| 18 to 34 Years | 0 (0.0%) | 0 (0.0%) |
| 35 to 64 Years | 33 (7.5%) | 44 (13.2%) |
| 65 to 74 Years | 0 (0.0%) | 0 (0.0%) |
| 75 Years and over | 0 (0.0%) | 0 (0.0%) |
Disability Class: Self-Care Difficulty
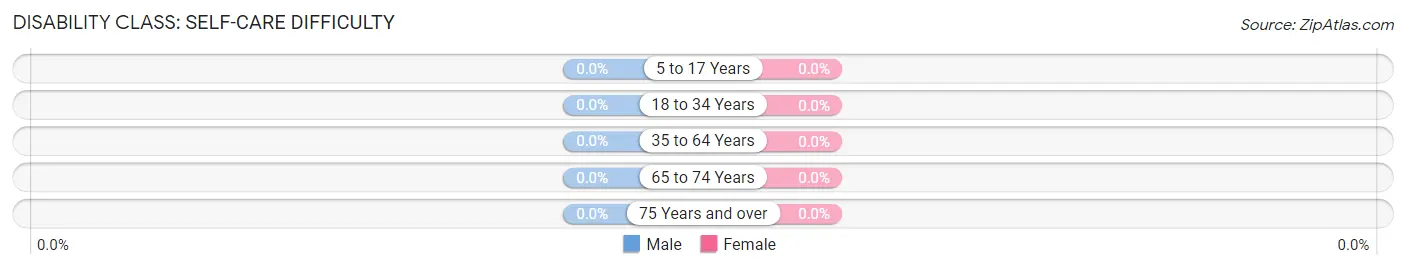
| Age Bracket | Male | Female |
| 5 to 17 Years | 0 (0.0%) | 0 (0.0%) |
| 18 to 34 Years | 0 (0.0%) | 0 (0.0%) |
| 35 to 64 Years | 0 (0.0%) | 0 (0.0%) |
| 65 to 74 Years | 0 (0.0%) | 0 (0.0%) |
| 75 Years and over | 0 (0.0%) | 0 (0.0%) |
Technology Access in Harmony
Computing Device Access in Harmony
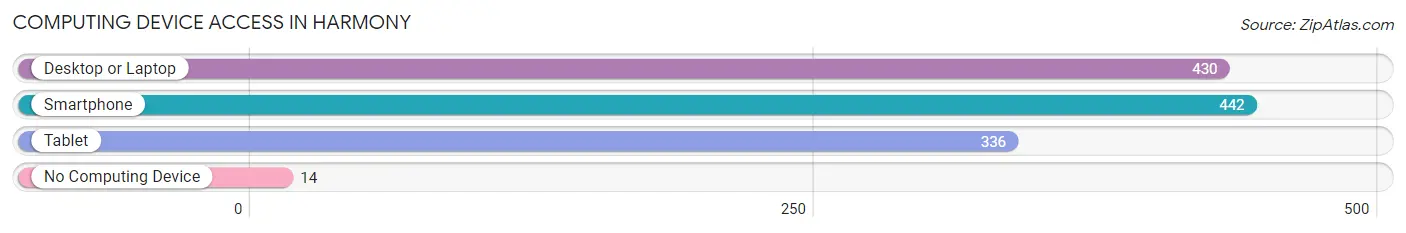
| Device Type | # Households | % Households |
| Desktop or Laptop | 430 | 90.7% |
| Smartphone | 442 | 93.2% |
| Tablet | 336 | 70.9% |
| No Computing Device | 14 | 2.9% |
| Total | 474 | 100.0% |
Internet Access in Harmony
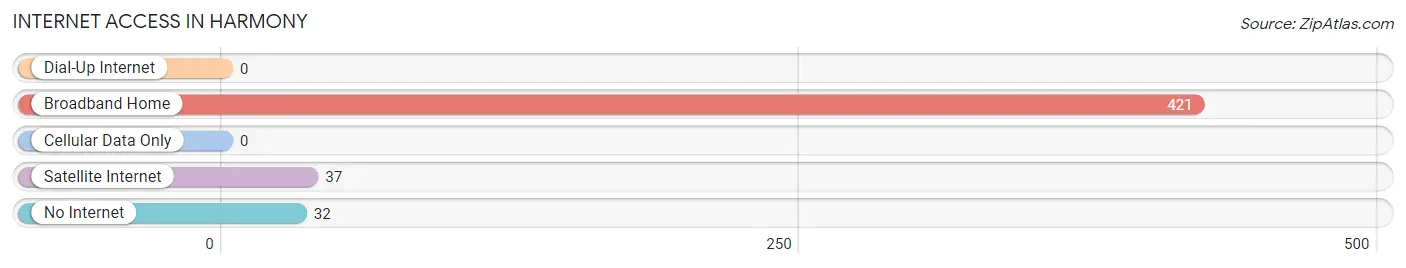
| Internet Type | # Households | % Households |
| Dial-Up Internet | 0 | 0.0% |
| Broadband Home | 421 | 88.8% |
| Cellular Data Only | 0 | 0.0% |
| Satellite Internet | 37 | 7.8% |
| No Internet | 32 | 6.8% |
| Total | 474 | 100.0% |
Harmony Summary
Harmony is a small town located in the state of Rhode Island. It is situated in the southwestern part of the state, in the town of Richmond. The town has a population of approximately 1,500 people, according to the 2010 census.
Geography
Harmony is located in the southwestern part of Rhode Island, in the town of Richmond. It is situated on the banks of the Wood River, which flows through the town. The town is bordered by the towns of Exeter, Hopkinton, and Richmond. The town is located in the Narragansett Bay watershed, and is part of the Blackstone Valley. The town is located in the Narragansett Bay watershed, and is part of the Blackstone Valley.
The town is mostly rural, with a few small businesses located in the town center. The town is home to several small lakes, including Harmony Pond, which is located in the center of town. The town is also home to several small farms, which produce a variety of crops.
History
Harmony was first settled in 1638 by a group of English settlers. The town was originally known as "Harmony Hill," and was part of the town of Exeter. In 1731, the town was incorporated as the town of Harmony.
The town was an agricultural community for much of its history, with the main crops being corn, potatoes, and hay. The town was also home to several small mills, which produced a variety of goods.
In the late 19th century, the town began to experience a period of growth and development. The town was home to several small businesses, including a sawmill, a gristmill, and a blacksmith shop. The town also had a post office, a school, and a library.
Economy
Harmony is a small, rural town, and the economy is largely based on agriculture. The town is home to several small farms, which produce a variety of crops, including corn, potatoes, hay, and other vegetables. The town is also home to several small businesses, including a sawmill, a gristmill, and a blacksmith shop.
The town is also home to several small businesses, including a grocery store, a hardware store, and a restaurant. The town is also home to several small businesses, including a gas station, a pharmacy, and a bank.
Demographics
According to the 2010 census, the population of Harmony was 1,500 people. The town is predominantly white, with a small minority population. The median age of the population is 44.7 years, and the median household income is $50,000.
Conclusion
Harmony is a small town located in the southwestern part of Rhode Island. The town has a population of approximately 1,500 people, and is predominantly white. The town is largely rural, with a few small businesses located in the town center. The town is home to several small farms, which produce a variety of crops. The town is also home to several small businesses, including a sawmill, a gristmill, and a blacksmith shop. The town is also home to several small businesses, including a grocery store, a hardware store, and a restaurant. The median household income is $50,000, and the median age of the population is 44.7 years.
Common Questions
What is Per Capita Income in Harmony?
Per Capita income in Harmony is $45,128.
What is the Median Family Income in Harmony?
Median Family Income in Harmony is $108,973.
What is the Median Household income in Harmony?
Median Household Income in Harmony is $103,430.
What is Income or Wage Gap in Harmony?
Income or Wage Gap in Harmony is 12.0%.
Women in Harmony earn 88.0 cents for every dollar earned by a man.
What is Inequality or Gini Index in Harmony?
Inequality or Gini Index in Harmony is 0.38.
What is the Total Population of Harmony?
Total Population of Harmony is 1,442.
What is the Total Male Population of Harmony?
Total Male Population of Harmony is 735.
What is the Total Female Population of Harmony?
Total Female Population of Harmony is 707.
What is the Ratio of Males per 100 Females in Harmony?
There are 103.96 Males per 100 Females in Harmony.
What is the Ratio of Females per 100 Males in Harmony?
There are 96.19 Females per 100 Males in Harmony.
What is the Median Population Age in Harmony?
Median Population Age in Harmony is 44.9 Years.
What is the Average Family Size in Harmony
Average Family Size in Harmony is 3.4 People.
What is the Average Household Size in Harmony
Average Household Size in Harmony is 3.0 People.
How Large is the Labor Force in Harmony?
There are 851 People in the Labor Forcein in Harmony.
What is the Percentage of People in the Labor Force in Harmony?
71.5% of People are in the Labor Force in Harmony.
What is the Unemployment Rate in Harmony?
Unemployment Rate in Harmony is 3.5%.