Greene, RI Map & Demographics
Greene Map
Greene Overview
$35,774
PER CAPITA INCOME
$97,167
AVG FAMILY INCOME
$96,176
AVG HOUSEHOLD INCOME
45.0%
WAGE / INCOME GAP [ % ]
55.0¢/ $1
WAGE / INCOME GAP [ $ ]
0.31
INEQUALITY / GINI INDEX
1,070
TOTAL POPULATION
531
MALE POPULATION
539
FEMALE POPULATION
98.52
MALES / 100 FEMALES
101.51
FEMALES / 100 MALES
34.2
MEDIAN AGE
3.6
AVG FAMILY SIZE
3.2
AVG HOUSEHOLD SIZE
469
LABOR FORCE [ PEOPLE ]
54.5%
PERCENT IN LABOR FORCE
2.8%
UNEMPLOYMENT RATE
Greene Zip Codes
Greene Area Codes
Income in Greene
Income Overview in Greene
Per Capita Income in Greene is $35,774, while median incomes of families and households are $97,167 and $96,176 respectively.
| Characteristic | Number | Measure |
| Per Capita Income | 1,070 | $35,774 |
| Median Family Income | 268 | $97,167 |
| Mean Family Income | 268 | $121,759 |
| Median Household Income | 330 | $96,176 |
| Mean Household Income | 330 | $114,459 |
| Income Deficit | 268 | $0 |
| Wage / Income Gap (%) | 1,070 | 44.98% |
| Wage / Income Gap ($) | 1,070 | 55.02¢ per $1 |
| Gini / Inequality Index | 1,070 | 0.31 |
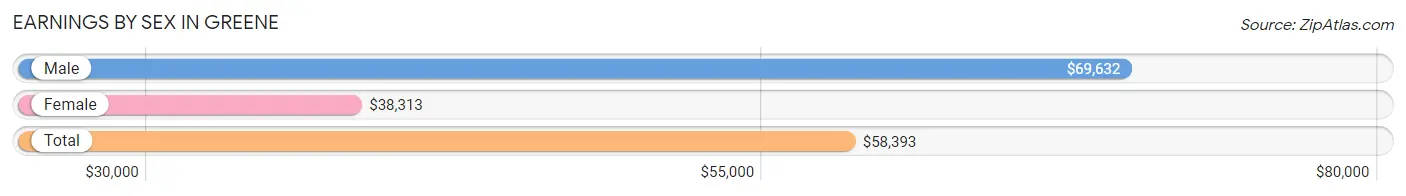
Earnings by Sex in Greene
Average Earnings in Greene are $58,393, $69,632 for men and $38,313 for women, a difference of 45.0%.
| Sex | Number | Average Earnings |
| Male | 279 (58.1%) | $69,632 |
| Female | 201 (41.9%) | $38,313 |
| Total | 480 (100.0%) | $58,393 |
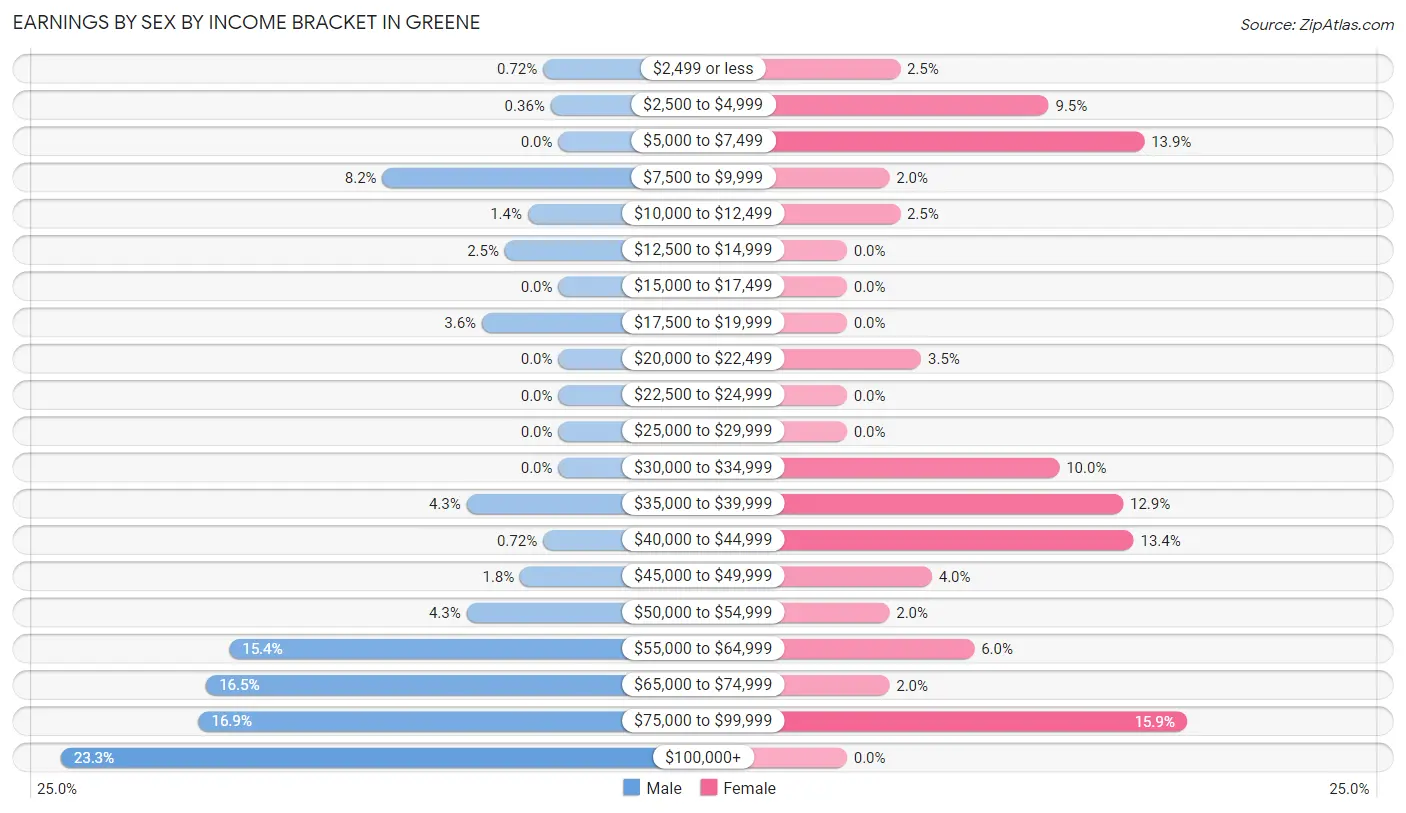
Earnings by Sex by Income Bracket in Greene
The most common earnings brackets in Greene are $100,000+ for men (65 | 23.3%) and $75,000 to $99,999 for women (32 | 15.9%).
| Income | Male | Female |
| $2,499 or less | 2 (0.7%) | 5 (2.5%) |
| $2,500 to $4,999 | 1 (0.4%) | 19 (9.5%) |
| $5,000 to $7,499 | 0 (0.0%) | 28 (13.9%) |
| $7,500 to $9,999 | 23 (8.2%) | 4 (2.0%) |
| $10,000 to $12,499 | 4 (1.4%) | 5 (2.5%) |
| $12,500 to $14,999 | 7 (2.5%) | 0 (0.0%) |
| $15,000 to $17,499 | 0 (0.0%) | 0 (0.0%) |
| $17,500 to $19,999 | 10 (3.6%) | 0 (0.0%) |
| $20,000 to $22,499 | 0 (0.0%) | 7 (3.5%) |
| $22,500 to $24,999 | 0 (0.0%) | 0 (0.0%) |
| $25,000 to $29,999 | 0 (0.0%) | 0 (0.0%) |
| $30,000 to $34,999 | 0 (0.0%) | 20 (10.0%) |
| $35,000 to $39,999 | 12 (4.3%) | 26 (12.9%) |
| $40,000 to $44,999 | 2 (0.7%) | 27 (13.4%) |
| $45,000 to $49,999 | 5 (1.8%) | 8 (4.0%) |
| $50,000 to $54,999 | 12 (4.3%) | 4 (2.0%) |
| $55,000 to $64,999 | 43 (15.4%) | 12 (6.0%) |
| $65,000 to $74,999 | 46 (16.5%) | 4 (2.0%) |
| $75,000 to $99,999 | 47 (16.9%) | 32 (15.9%) |
| $100,000+ | 65 (23.3%) | 0 (0.0%) |
| Total | 279 (100.0%) | 201 (100.0%) |
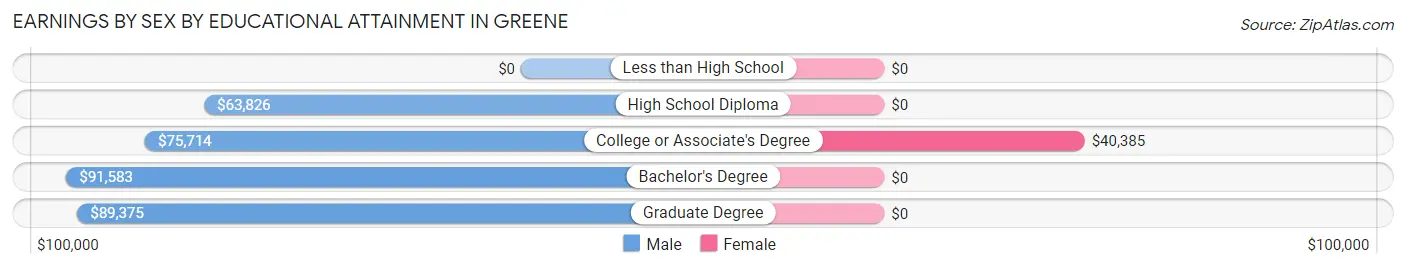
Earnings by Sex by Educational Attainment in Greene
Average earnings in Greene are $73,450 for men and $40,078 for women, a difference of 45.4%. Men with an educational attainment of bachelor's degree enjoy the highest average annual earnings of $91,583, while those with high school diploma education earn the least with $63,826. Women with an educational attainment of college or associate's degree earn the most with the average annual earnings of $40,385, while those with college or associate's degree education have the smallest earnings of $40,385.
| Educational Attainment | Male Income | Female Income |
| Less than High School | - | - |
| High School Diploma | $63,826 | $0 |
| College or Associate's Degree | $75,714 | $40,385 |
| Bachelor's Degree | $91,583 | $0 |
| Graduate Degree | $89,375 | $0 |
| Total | $73,450 | $40,078 |
Family Income in Greene
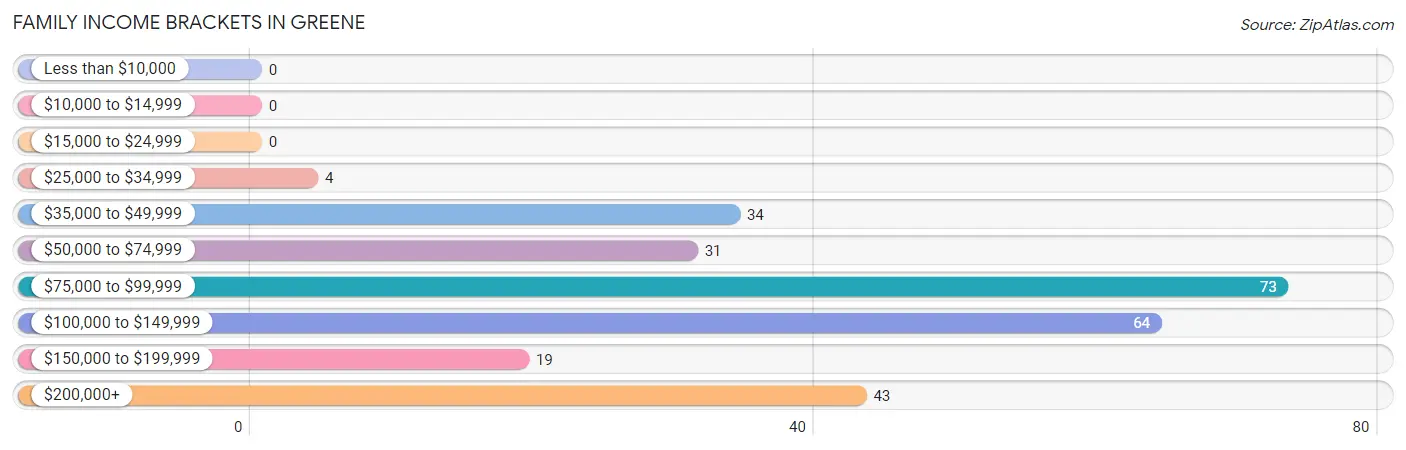
Family Income Brackets in Greene
According to the Greene family income data, there are 73 families falling into the $75,000 to $99,999 income range, which is the most common income bracket and makes up 27.2% of all families.
| Income Bracket | # Families | % Families |
| Less than $10,000 | 0 | 0.0% |
| $10,000 to $14,999 | 0 | 0.0% |
| $15,000 to $24,999 | 0 | 0.0% |
| $25,000 to $34,999 | 4 | 1.5% |
| $35,000 to $49,999 | 34 | 12.7% |
| $50,000 to $74,999 | 31 | 11.6% |
| $75,000 to $99,999 | 73 | 27.2% |
| $100,000 to $149,999 | 64 | 23.9% |
| $150,000 to $199,999 | 19 | 7.1% |
| $200,000+ | 43 | 16.0% |
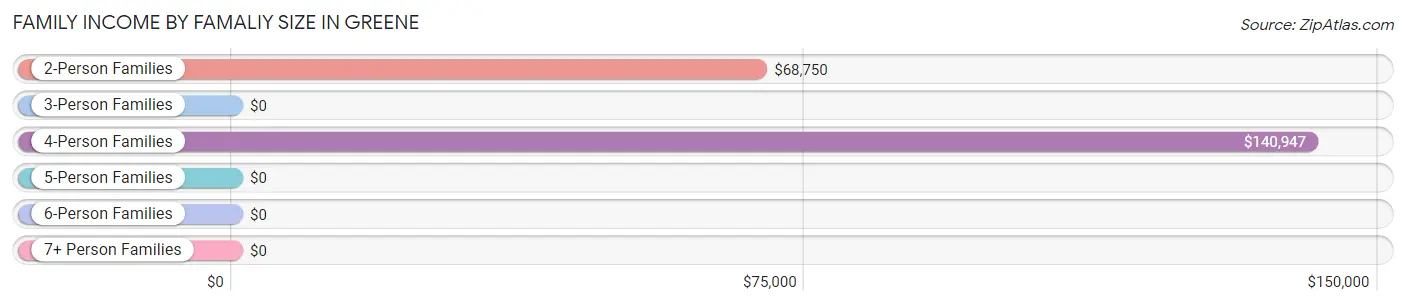
Family Income by Famaliy Size in Greene
4-person families (101 | 37.7%) account for the highest median family income in Greene with $140,947 per family, while 4-person families (101 | 37.7%) have the highest median income of $35,237 per family member.
| Income Bracket | # Families | Median Income |
| 2-Person Families | 74 (27.6%) | $68,750 |
| 3-Person Families | 54 (20.2%) | $0 |
| 4-Person Families | 101 (37.7%) | $140,947 |
| 5-Person Families | 39 (14.5%) | $0 |
| 6-Person Families | 0 (0.0%) | $0 |
| 7+ Person Families | 0 (0.0%) | $0 |
| Total | 268 (100.0%) | $97,167 |
Family Income by Number of Earners in Greene
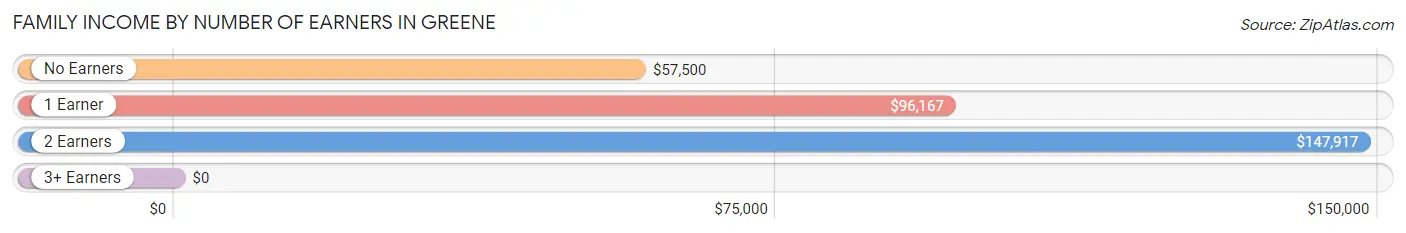
| Number of Earners | # Families | Median Income |
| No Earners | 30 (11.2%) | $57,500 |
| 1 Earner | 106 (39.6%) | $96,167 |
| 2 Earners | 108 (40.3%) | $147,917 |
| 3+ Earners | 24 (9.0%) | $0 |
| Total | 268 (100.0%) | $97,167 |
Household Income in Greene
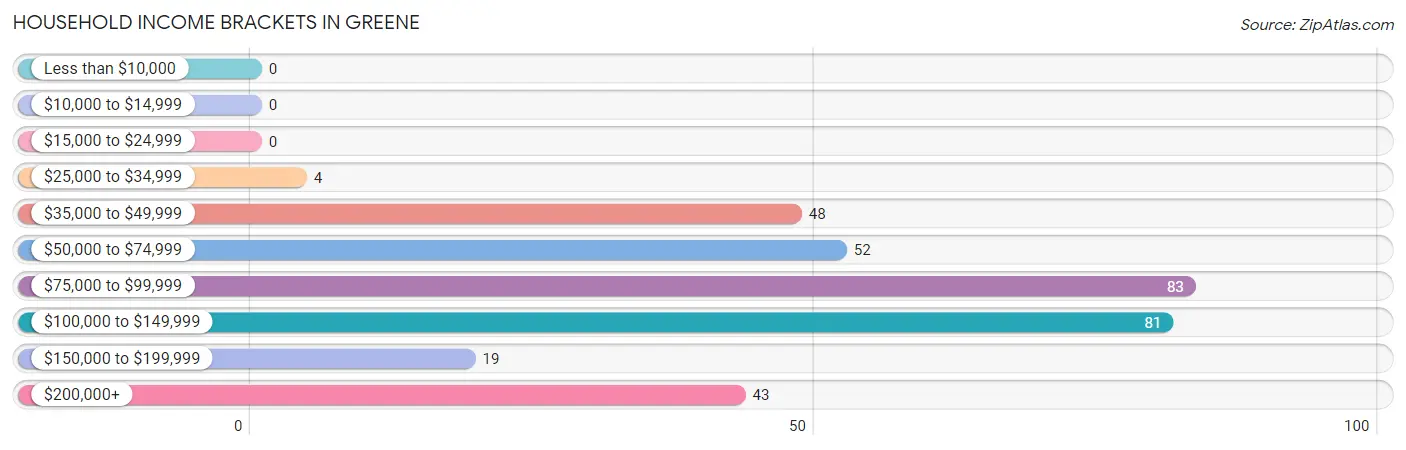
Household Income Brackets in Greene
With 83 households falling in the category, the $75,000 to $99,999 income range is the most frequent in Greene, accounting for 25.2% of all households.
| Income Bracket | # Households | % Households |
| Less than $10,000 | 0 | 0.0% |
| $10,000 to $14,999 | 0 | 0.0% |
| $15,000 to $24,999 | 0 | 0.0% |
| $25,000 to $34,999 | 4 | 1.2% |
| $35,000 to $49,999 | 48 | 14.5% |
| $50,000 to $74,999 | 52 | 15.8% |
| $75,000 to $99,999 | 83 | 25.2% |
| $100,000 to $149,999 | 81 | 24.5% |
| $150,000 to $199,999 | 19 | 5.8% |
| $200,000+ | 43 | 13.0% |
Household Income by Householder Age in Greene
The median household income in Greene is $96,176, with the highest median household income of $120,833 found in the 45 to 64 years age bracket for the primary householder. A total of 124 households (37.6%) fall into this category.
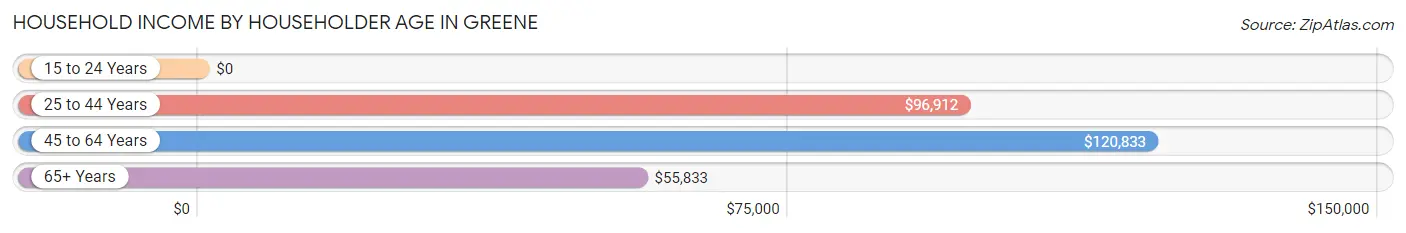
| Income Bracket | # Households | Median Income |
| 15 to 24 Years | 0 (0.0%) | $0 |
| 25 to 44 Years | 138 (41.8%) | $96,912 |
| 45 to 64 Years | 124 (37.6%) | $120,833 |
| 65+ Years | 68 (20.6%) | $55,833 |
| Total | 330 (100.0%) | $96,176 |
Poverty in Greene
Income Below Poverty by Sex and Age in Greene
With 1.3% poverty level for males and 2.8% for females among the residents of Greene, 35 to 44 year old males and 25 to 34 year old females are the most vulnerable to poverty, with 3 males (8.1%) and 15 females (15.5%) in their respective age groups living below the poverty level.
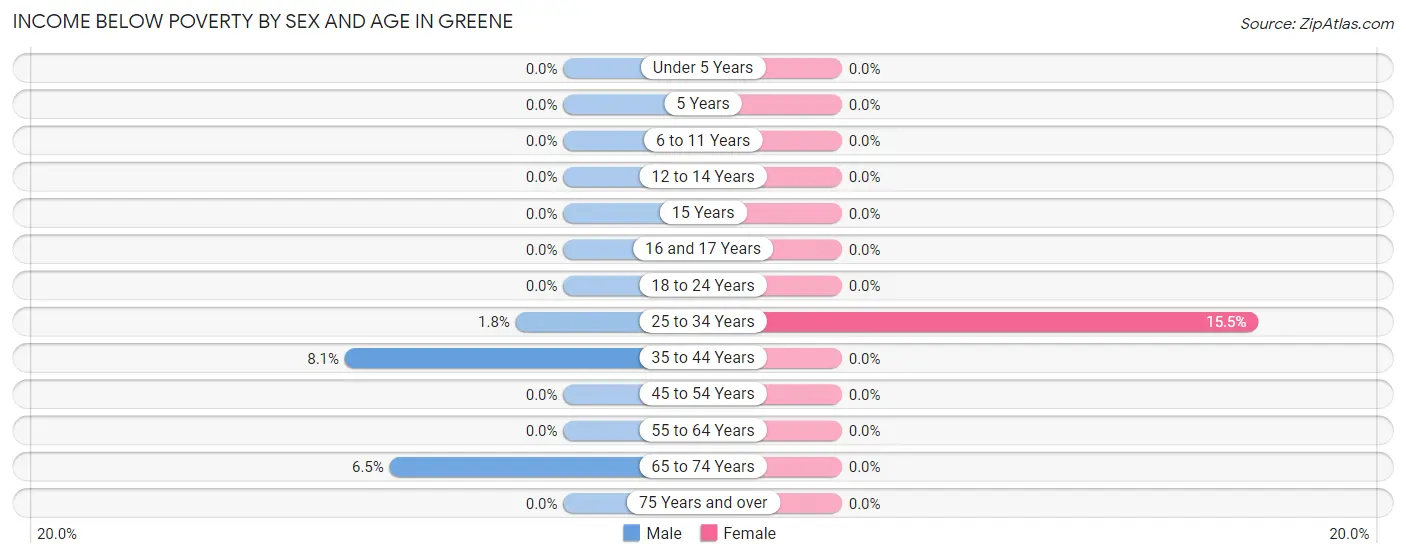
| Age Bracket | Male | Female |
| Under 5 Years | 0 (0.0%) | 0 (0.0%) |
| 5 Years | 0 (0.0%) | 0 (0.0%) |
| 6 to 11 Years | 0 (0.0%) | 0 (0.0%) |
| 12 to 14 Years | 0 (0.0%) | 0 (0.0%) |
| 15 Years | 0 (0.0%) | 0 (0.0%) |
| 16 and 17 Years | 0 (0.0%) | 0 (0.0%) |
| 18 to 24 Years | 0 (0.0%) | 0 (0.0%) |
| 25 to 34 Years | 2 (1.8%) | 15 (15.5%) |
| 35 to 44 Years | 3 (8.1%) | 0 (0.0%) |
| 45 to 54 Years | 0 (0.0%) | 0 (0.0%) |
| 55 to 64 Years | 0 (0.0%) | 0 (0.0%) |
| 65 to 74 Years | 2 (6.5%) | 0 (0.0%) |
| 75 Years and over | 0 (0.0%) | 0 (0.0%) |
| Total | 7 (1.3%) | 15 (2.8%) |
Income Above Poverty by Sex and Age in Greene
According to the poverty statistics in Greene, males aged under 5 years and females aged under 5 years are the age groups that are most secure financially, with 100.0% of males and 100.0% of females in these age groups living above the poverty line.
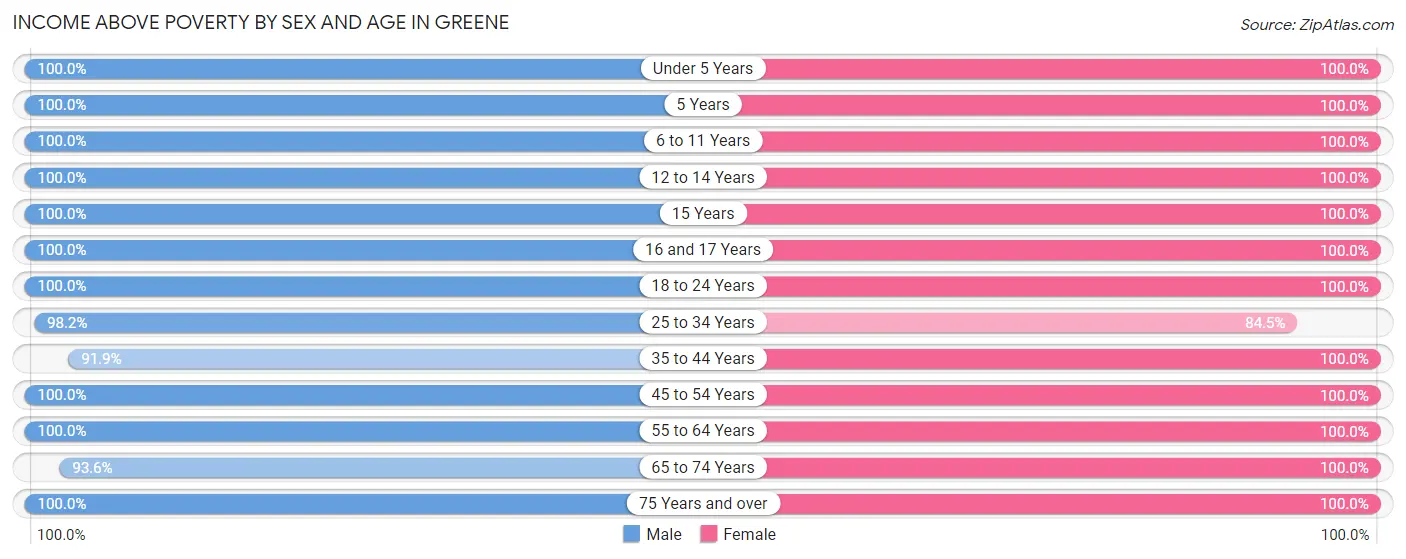
| Age Bracket | Male | Female |
| Under 5 Years | 6 (100.0%) | 49 (100.0%) |
| 5 Years | 24 (100.0%) | 11 (100.0%) |
| 6 to 11 Years | 30 (100.0%) | 27 (100.0%) |
| 12 to 14 Years | 29 (100.0%) | 4 (100.0%) |
| 15 Years | 12 (100.0%) | 11 (100.0%) |
| 16 and 17 Years | 70 (100.0%) | 63 (100.0%) |
| 18 to 24 Years | 37 (100.0%) | 12 (100.0%) |
| 25 to 34 Years | 111 (98.2%) | 82 (84.5%) |
| 35 to 44 Years | 34 (91.9%) | 94 (100.0%) |
| 45 to 54 Years | 98 (100.0%) | 60 (100.0%) |
| 55 to 64 Years | 33 (100.0%) | 39 (100.0%) |
| 65 to 74 Years | 29 (93.5%) | 48 (100.0%) |
| 75 Years and over | 11 (100.0%) | 17 (100.0%) |
| Total | 524 (98.7%) | 517 (97.2%) |
Income Below Poverty Among Married-Couple Families in Greene
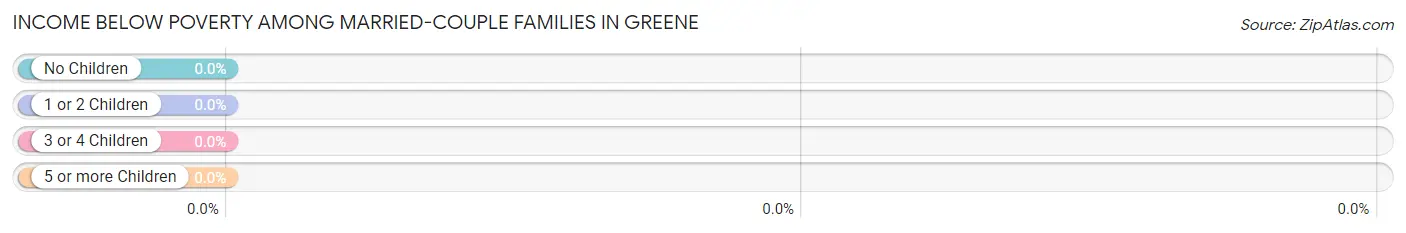
| Children | Above Poverty | Below Poverty |
| No Children | 68 (100.0%) | 0 (0.0%) |
| 1 or 2 Children | 103 (100.0%) | 0 (0.0%) |
| 3 or 4 Children | 30 (100.0%) | 0 (0.0%) |
| 5 or more Children | 0 (0.0%) | 0 (0.0%) |
| Total | 201 (100.0%) | 0 (0.0%) |
Income Below Poverty Among Single-Parent Households in Greene
| Children | Single Father | Single Mother |
| No Children | 0 (0.0%) | 0 (0.0%) |
| 1 or 2 Children | 0 (0.0%) | 0 (0.0%) |
| 3 or 4 Children | 0 (0.0%) | 0 (0.0%) |
| 5 or more Children | 0 (0.0%) | 0 (0.0%) |
| Total | 0 (0.0%) | 0 (0.0%) |
Income Below Poverty Among Married-Couple vs Single-Parent Households in Greene
| Children | Married-Couple Families | Single-Parent Households |
| No Children | 0 (0.0%) | 0 (0.0%) |
| 1 or 2 Children | 0 (0.0%) | 0 (0.0%) |
| 3 or 4 Children | 0 (0.0%) | 0 (0.0%) |
| 5 or more Children | 0 (0.0%) | 0 (0.0%) |
| Total | 0 (0.0%) | 0 (0.0%) |
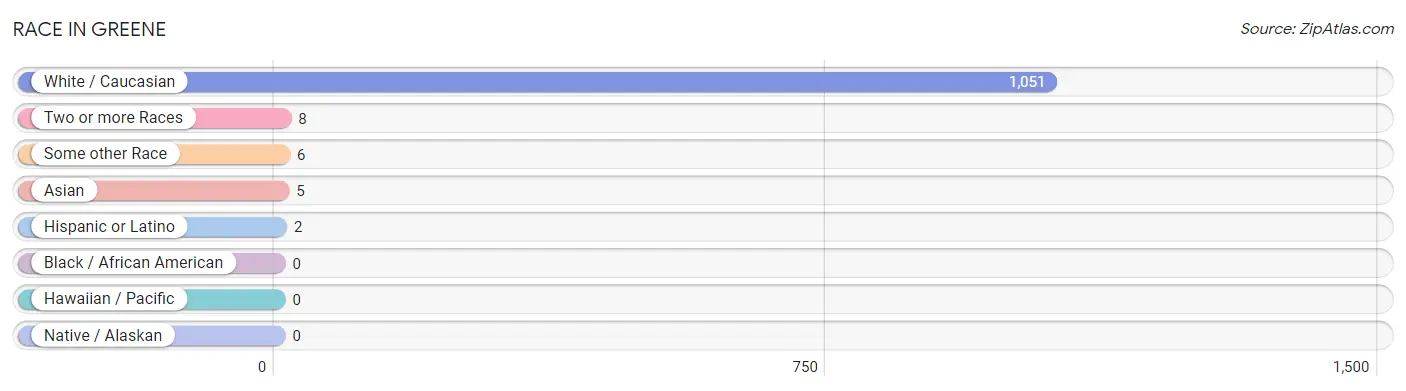
Race in Greene
The most populous races in Greene are White / Caucasian (1,051 | 98.2%), Two or more Races (8 | 0.7%), and Some other Race (6 | 0.6%).
| Race | # Population | % Population |
| Asian | 5 | 0.5% |
| Black / African American | 0 | 0.0% |
| Hawaiian / Pacific | 0 | 0.0% |
| Hispanic or Latino | 2 | 0.2% |
| Native / Alaskan | 0 | 0.0% |
| White / Caucasian | 1,051 | 98.2% |
| Two or more Races | 8 | 0.7% |
| Some other Race | 6 | 0.6% |
| Total | 1,070 | 100.0% |
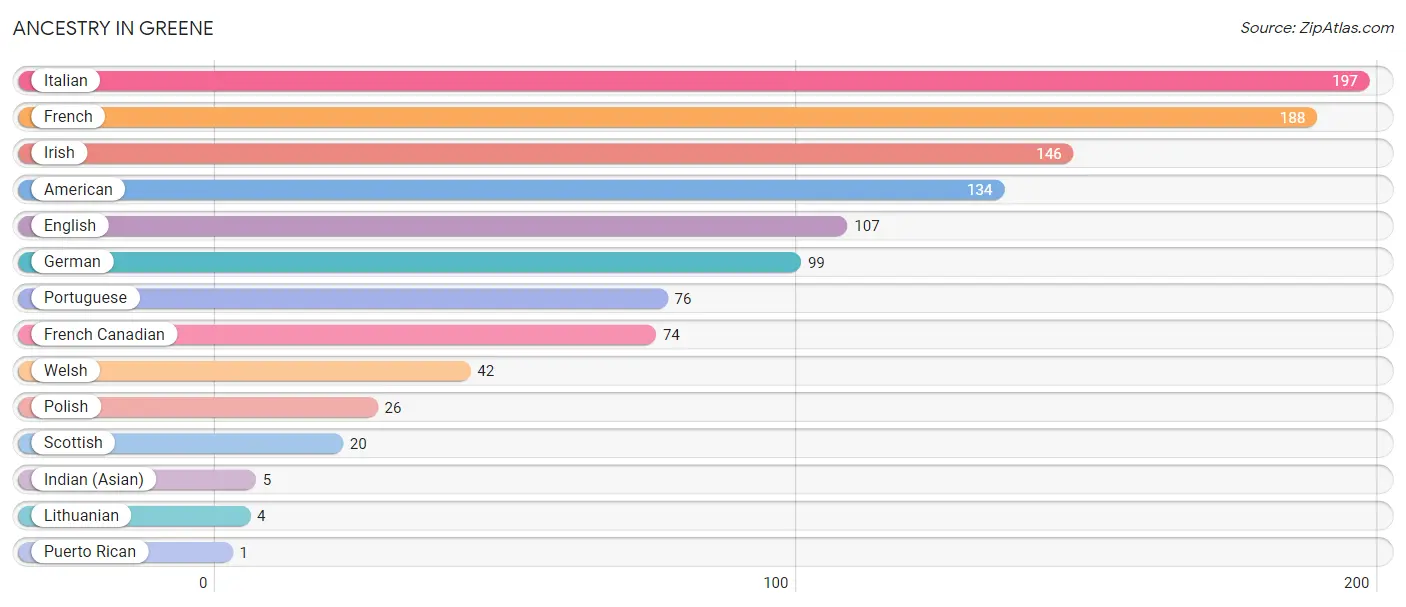
Ancestry in Greene
The most populous ancestries reported in Greene are Italian (197 | 18.4%), French (188 | 17.6%), Irish (146 | 13.6%), American (134 | 12.5%), and English (107 | 10.0%), together accounting for 72.1% of all Greene residents.
| Ancestry | # Population | % Population |
| American | 134 | 12.5% |
| English | 107 | 10.0% |
| French | 188 | 17.6% |
| French Canadian | 74 | 6.9% |
| German | 99 | 9.2% |
| Indian (Asian) | 5 | 0.5% |
| Irish | 146 | 13.6% |
| Italian | 197 | 18.4% |
| Lithuanian | 4 | 0.4% |
| Polish | 26 | 2.4% |
| Portuguese | 76 | 7.1% |
| Puerto Rican | 1 | 0.1% |
| Scottish | 20 | 1.9% |
| Welsh | 42 | 3.9% | View All 14 Rows |
Immigrants in Greene
The most numerous immigrant groups reported in Greene came from Europe (21 | 2.0%), Germany (13 | 1.2%), Western Europe (13 | 1.2%), Azores (8 | 0.7%), and Portugal (8 | 0.7%), together accounting for 5.9% of all Greene residents.
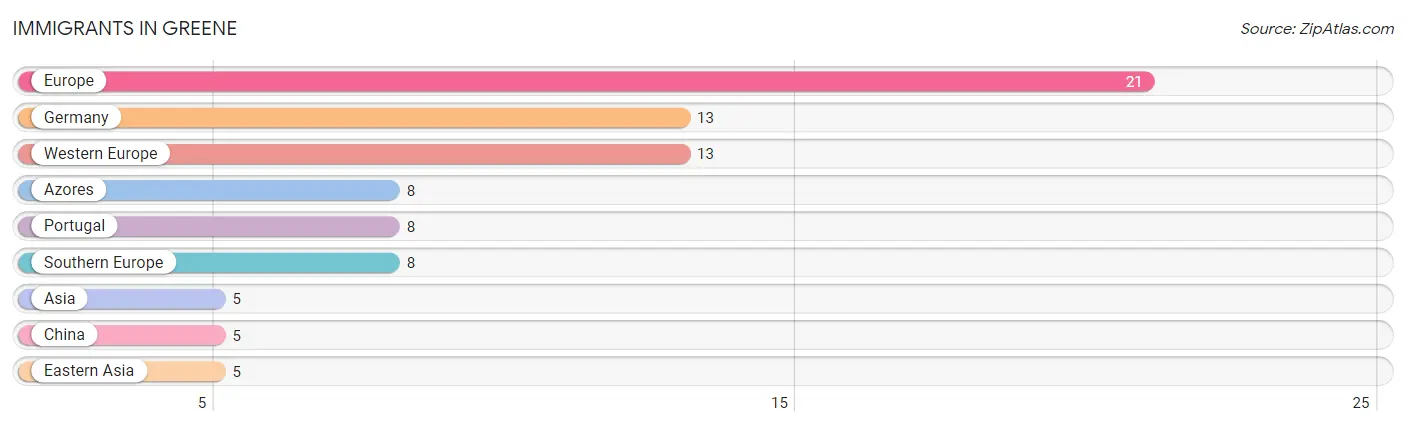
| Immigration Origin | # Population | % Population |
| Asia | 5 | 0.5% |
| Azores | 8 | 0.7% |
| China | 5 | 0.5% |
| Eastern Asia | 5 | 0.5% |
| Europe | 21 | 2.0% |
| Germany | 13 | 1.2% |
| Portugal | 8 | 0.7% |
| Southern Europe | 8 | 0.7% |
| Western Europe | 13 | 1.2% | View All 9 Rows |
Sex and Age in Greene
Sex and Age in Greene
The most populous age groups in Greene are 15 to 19 Years (89 | 16.8%) for men and 15 to 19 Years (74 | 13.7%) for women.
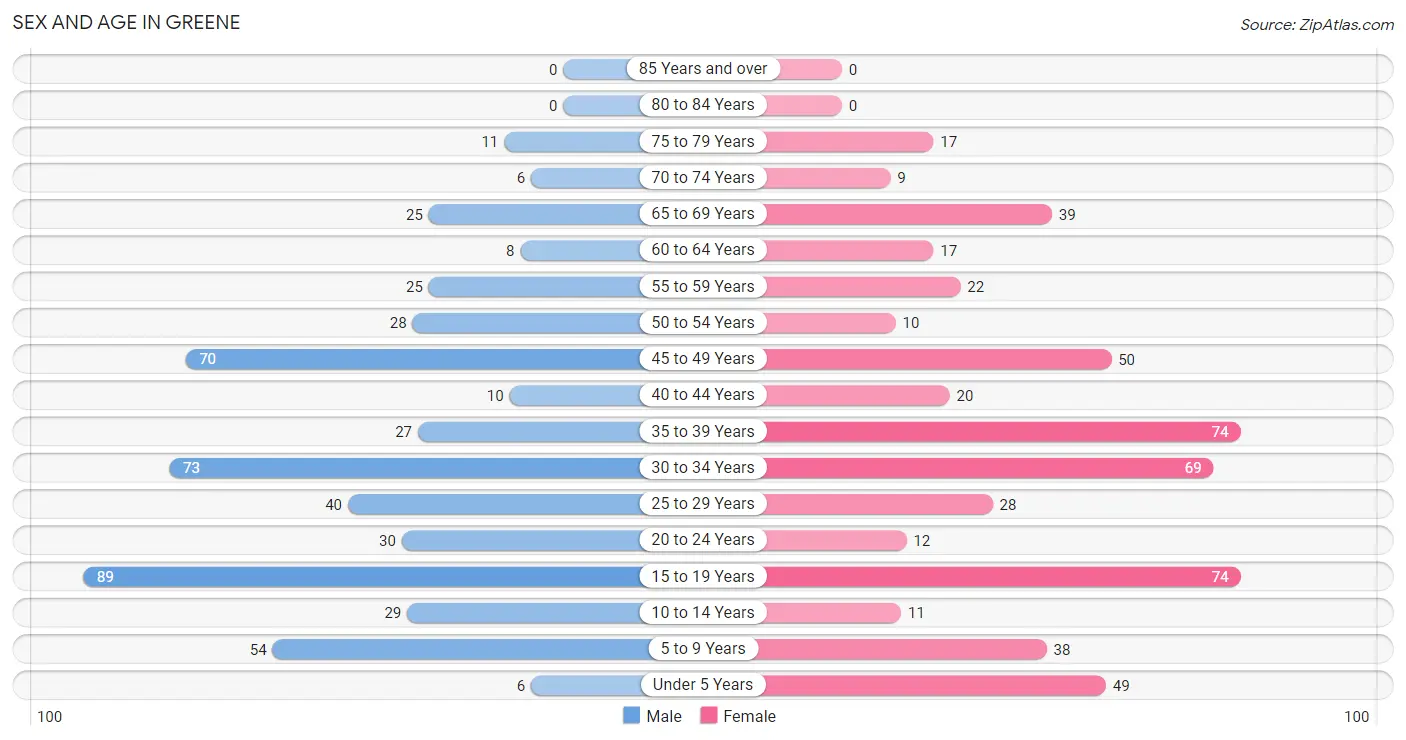
| Age Bracket | Male | Female |
| Under 5 Years | 6 (1.1%) | 49 (9.1%) |
| 5 to 9 Years | 54 (10.2%) | 38 (7.0%) |
| 10 to 14 Years | 29 (5.5%) | 11 (2.0%) |
| 15 to 19 Years | 89 (16.8%) | 74 (13.7%) |
| 20 to 24 Years | 30 (5.7%) | 12 (2.2%) |
| 25 to 29 Years | 40 (7.5%) | 28 (5.2%) |
| 30 to 34 Years | 73 (13.8%) | 69 (12.8%) |
| 35 to 39 Years | 27 (5.1%) | 74 (13.7%) |
| 40 to 44 Years | 10 (1.9%) | 20 (3.7%) |
| 45 to 49 Years | 70 (13.2%) | 50 (9.3%) |
| 50 to 54 Years | 28 (5.3%) | 10 (1.9%) |
| 55 to 59 Years | 25 (4.7%) | 22 (4.1%) |
| 60 to 64 Years | 8 (1.5%) | 17 (3.2%) |
| 65 to 69 Years | 25 (4.7%) | 39 (7.2%) |
| 70 to 74 Years | 6 (1.1%) | 9 (1.7%) |
| 75 to 79 Years | 11 (2.1%) | 17 (3.2%) |
| 80 to 84 Years | 0 (0.0%) | 0 (0.0%) |
| 85 Years and over | 0 (0.0%) | 0 (0.0%) |
| Total | 531 (100.0%) | 539 (100.0%) |
Families and Households in Greene
Median Family Size in Greene
The median family size in Greene is 3.59 persons per family, with married-couple families (201 | 75.0%) accounting for the largest median family size of 3.64 persons per family. On the other hand, single male/father families (17 | 6.3%) represent the smallest median family size with 3.06 persons per family.
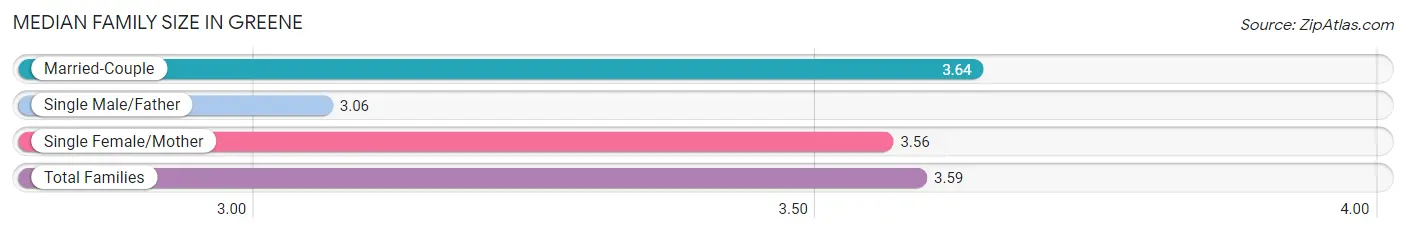
| Family Type | # Families | Family Size |
| Married-Couple | 201 (75.0%) | 3.64 |
| Single Male/Father | 17 (6.3%) | 3.06 |
| Single Female/Mother | 50 (18.7%) | 3.56 |
| Total Families | 268 (100.0%) | 3.59 |
Median Household Size in Greene
The median household size in Greene is 3.22 persons per household, with single female/mother households (50 | 15.1%) accounting for the largest median household size of 3.68 persons per household. non-family households (62 | 18.8%) represent the smallest median household size with 1.47 persons per household.
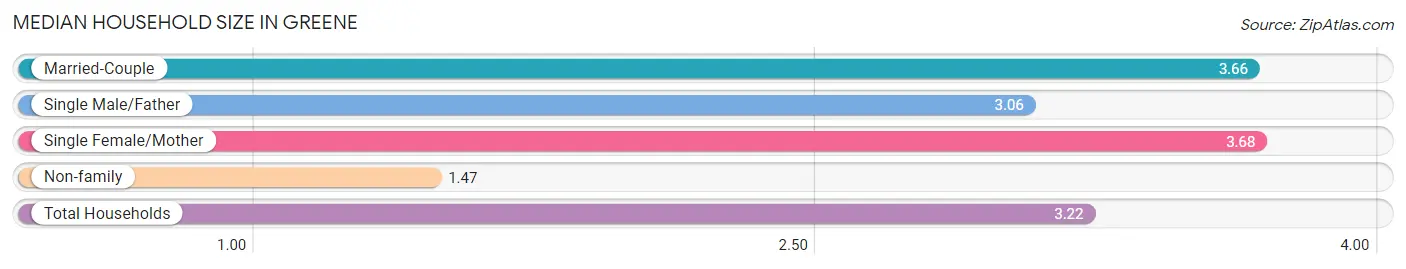
| Household Type | # Households | Household Size |
| Married-Couple | 201 (60.9%) | 3.66 |
| Single Male/Father | 17 (5.1%) | 3.06 |
| Single Female/Mother | 50 (15.1%) | 3.68 |
| Non-family | 62 (18.8%) | 1.47 |
| Total Households | 330 (100.0%) | 3.22 |
Household Size by Marriage Status in Greene
Out of a total of 330 households in Greene, 268 (81.2%) are family households, while 62 (18.8%) are nonfamily households. The most numerous type of family households are 4-person households, comprising 101, and the most common type of nonfamily households are 1-person households, comprising 39.
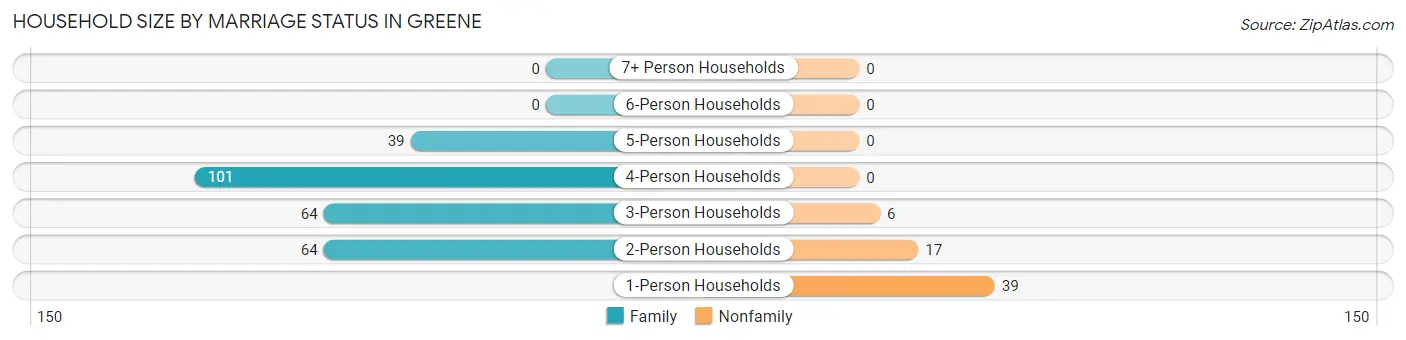
| Household Size | Family Households | Nonfamily Households |
| 1-Person Households | - | 39 (11.8%) |
| 2-Person Households | 64 (19.4%) | 17 (5.1%) |
| 3-Person Households | 64 (19.4%) | 6 (1.8%) |
| 4-Person Households | 101 (30.6%) | 0 (0.0%) |
| 5-Person Households | 39 (11.8%) | 0 (0.0%) |
| 6-Person Households | 0 (0.0%) | 0 (0.0%) |
| 7+ Person Households | 0 (0.0%) | 0 (0.0%) |
| Total | 268 (81.2%) | 62 (18.8%) |
Female Fertility in Greene
Fertility by Age in Greene
Average fertility rate in Greene is 66.0 births per 1,000 women. Women in the age bracket of 20 to 34 years have the highest fertility rate with 202.0 births per 1,000 women. Women in the age bracket of 20 to 34 years acount for 100.0% of all women with births.
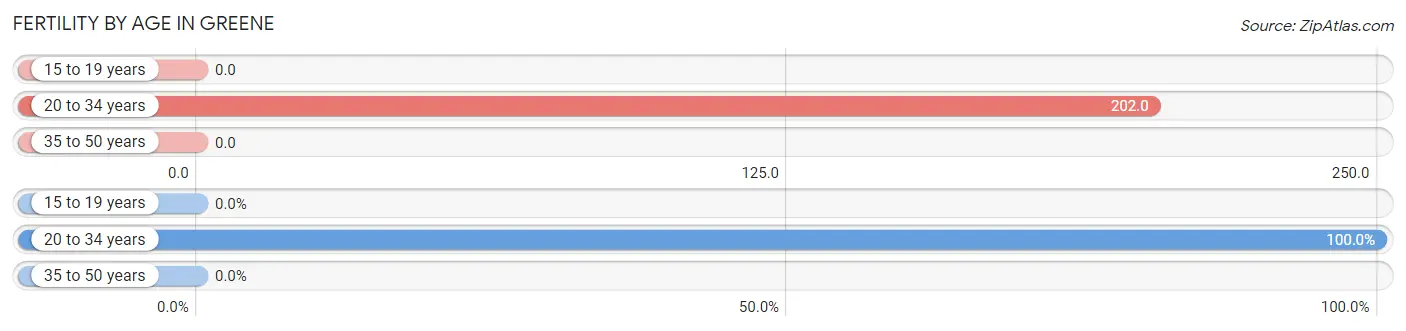
| Age Bracket | Women with Births | Births / 1,000 Women |
| 15 to 19 years | 0 (0.0%) | 0.0 |
| 20 to 34 years | 22 (100.0%) | 202.0 |
| 35 to 50 years | 0 (0.0%) | 0.0 |
| Total | 22 (100.0%) | 66.0 |
Fertility by Age by Marriage Status in Greene
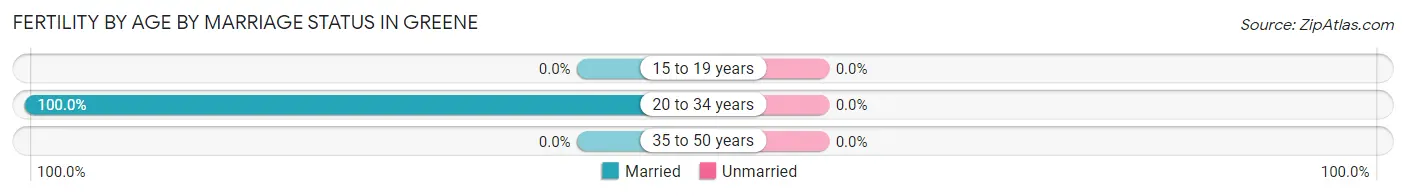
| Age Bracket | Married | Unmarried |
| 15 to 19 years | 0 (0.0%) | 0 (0.0%) |
| 20 to 34 years | 22 (100.0%) | 0 (0.0%) |
| 35 to 50 years | 0 (0.0%) | 0 (0.0%) |
| Total | 22 (100.0%) | 0 (0.0%) |
Fertility by Education in Greene
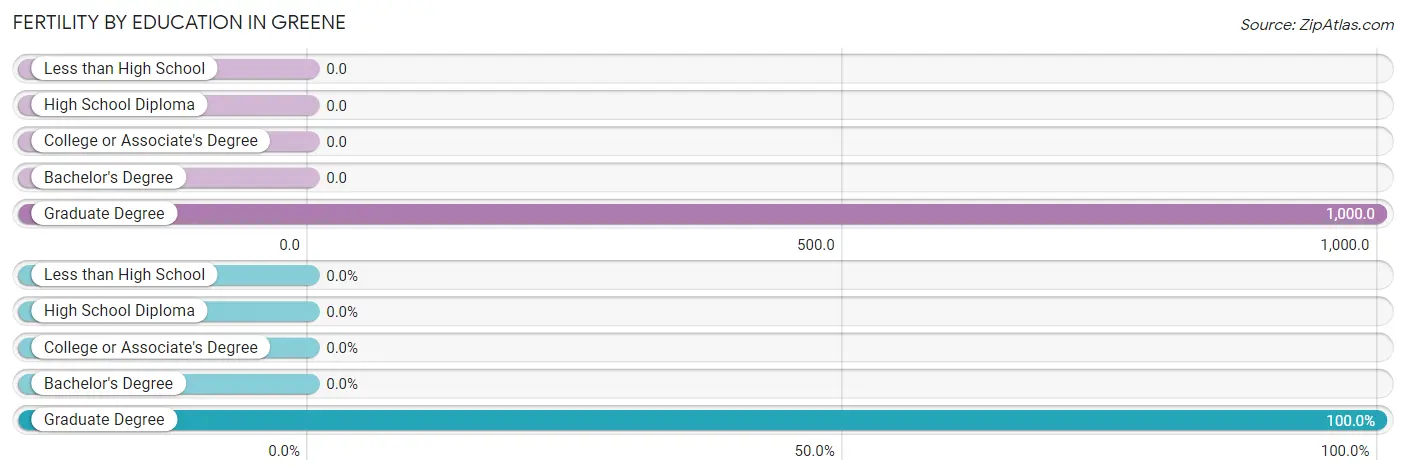
| Educational Attainment | Women with Births | Births / 1,000 Women |
| Less than High School | 0 (0.0%) | 0.0 |
| High School Diploma | 0 (0.0%) | 0.0 |
| College or Associate's Degree | 0 (0.0%) | 0.0 |
| Bachelor's Degree | 0 (0.0%) | 0.0 |
| Graduate Degree | 22 (100.0%) | 1,000.0 |
| Total | 22 (100.0%) | 66.0 |
Fertility by Education by Marriage Status in Greene
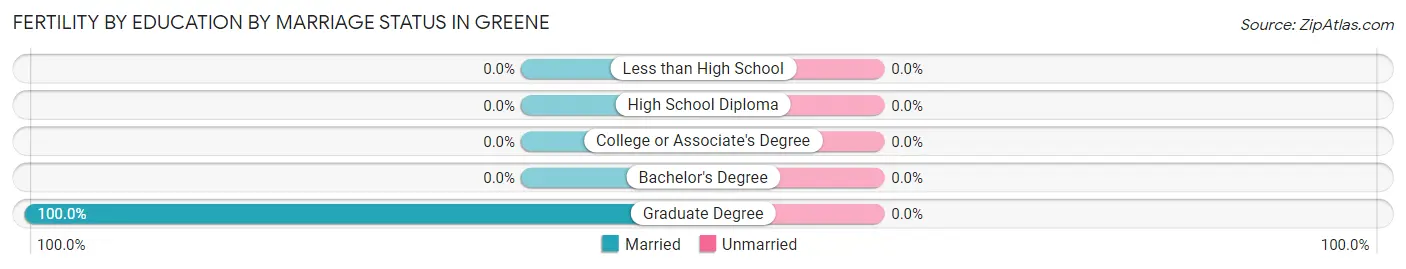
| Educational Attainment | Married | Unmarried |
| Less than High School | 0 (0.0%) | 0 (0.0%) |
| High School Diploma | 0 (0.0%) | 0 (0.0%) |
| College or Associate's Degree | 0 (0.0%) | 0 (0.0%) |
| Bachelor's Degree | 0 (0.0%) | 0 (0.0%) |
| Graduate Degree | 22 (100.0%) | 0 (0.0%) |
| Total | 22 (100.0%) | 0 (0.0%) |
Employment Characteristics in Greene
Employment by Class of Employer in Greene
Among the 452 employed individuals in Greene, private company employees (253 | 56.0%), state government employees (98 | 21.7%), and local government employees (36 | 8.0%) make up the most common classes of employment.
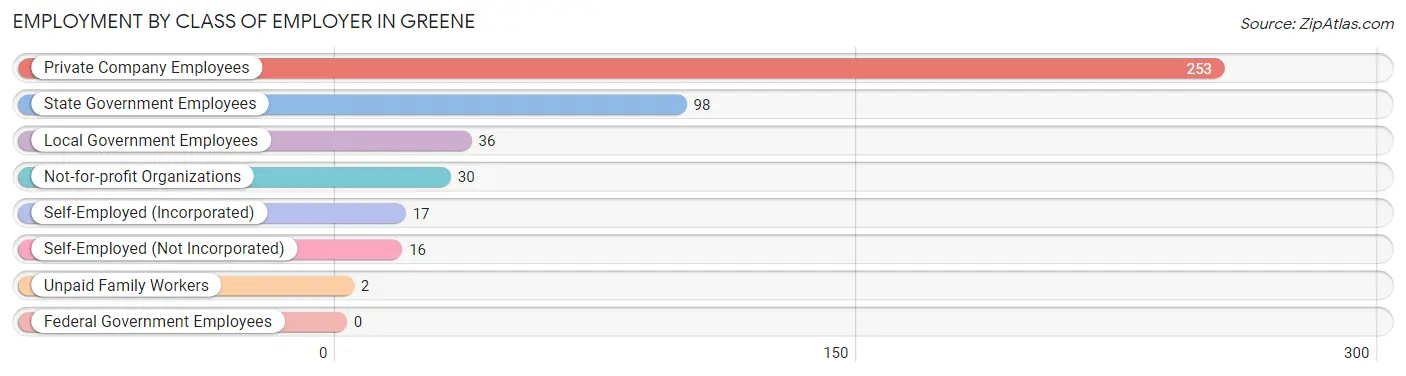
| Employer Class | # Employees | % Employees |
| Private Company Employees | 253 | 56.0% |
| Self-Employed (Incorporated) | 17 | 3.8% |
| Self-Employed (Not Incorporated) | 16 | 3.5% |
| Not-for-profit Organizations | 30 | 6.6% |
| Local Government Employees | 36 | 8.0% |
| State Government Employees | 98 | 21.7% |
| Federal Government Employees | 0 | 0.0% |
| Unpaid Family Workers | 2 | 0.4% |
| Total | 452 | 100.0% |
Employment Status by Age in Greene
According to the labor force statistics for Greene, out of the total population over 16 years of age (860), 54.5% or 469 individuals are in the labor force, with 2.8% or 13 of them unemployed. The age group with the highest labor force participation rate is 60 to 64 years, with 100.0% or 25 individuals in the labor force. Within the labor force, the 35 to 44 years age range has the highest percentage of unemployed individuals, with 12.3% or 9 of them being unemployed.
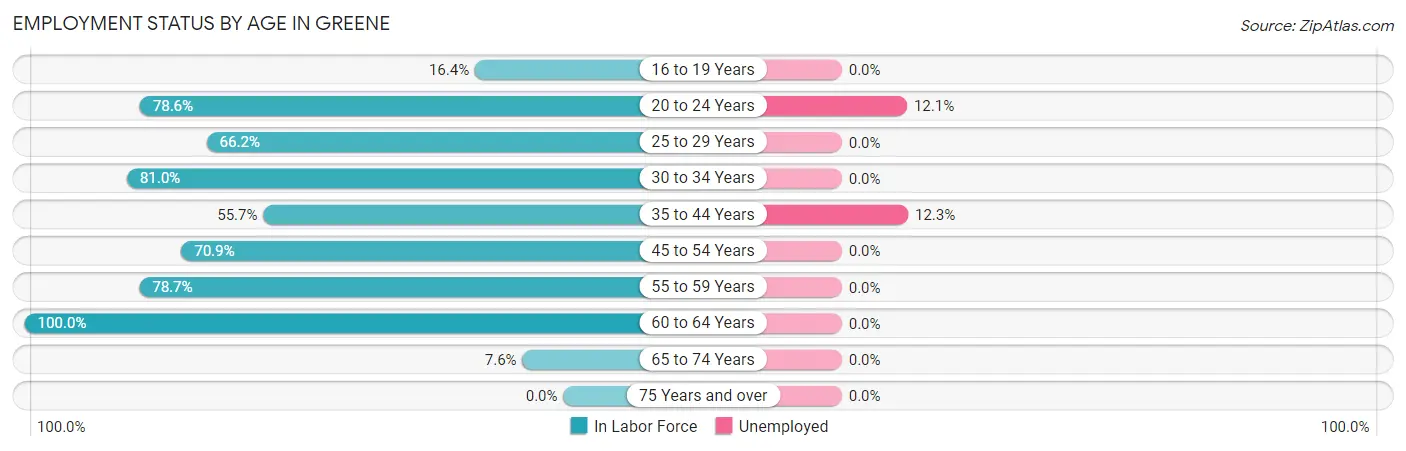
| Age Bracket | In Labor Force | Unemployed |
| 16 to 19 Years | 23 (16.4%) | 0 (0.0%) |
| 20 to 24 Years | 33 (78.6%) | 4 (12.1%) |
| 25 to 29 Years | 45 (66.2%) | 0 (0.0%) |
| 30 to 34 Years | 115 (81.0%) | 0 (0.0%) |
| 35 to 44 Years | 73 (55.7%) | 9 (12.3%) |
| 45 to 54 Years | 112 (70.9%) | 0 (0.0%) |
| 55 to 59 Years | 37 (78.7%) | 0 (0.0%) |
| 60 to 64 Years | 25 (100.0%) | 0 (0.0%) |
| 65 to 74 Years | 6 (7.6%) | 0 (0.0%) |
| 75 Years and over | 0 (0.0%) | 0 (0.0%) |
| Total | 469 (54.5%) | 13 (2.8%) |
Employment Status by Educational Attainment in Greene
According to labor force statistics for Greene, 71.3% of individuals (407) out of the total population between 25 and 64 years of age (571) are in the labor force, with 2.2% or 9 of them being unemployed. The group with the highest labor force participation rate are those with the educational attainment of college / associate degree, with 92.9% or 184 individuals in the labor force. Within the labor force, individuals with college / associate degree education have the highest percentage of unemployment, with 4.9% or 9 of them being unemployed.
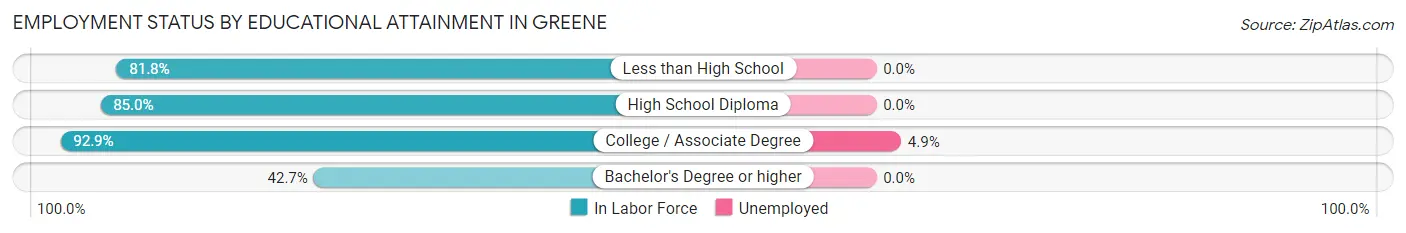
| Educational Attainment | In Labor Force | Unemployed |
| Less than High School | 27 (81.8%) | 0 (0.0%) |
| High School Diploma | 102 (85.0%) | 0 (0.0%) |
| College / Associate Degree | 184 (92.9%) | 10 (4.9%) |
| Bachelor's Degree or higher | 94 (42.7%) | 0 (0.0%) |
| Total | 407 (71.3%) | 13 (2.2%) |
Employment Occupations by Sex in Greene
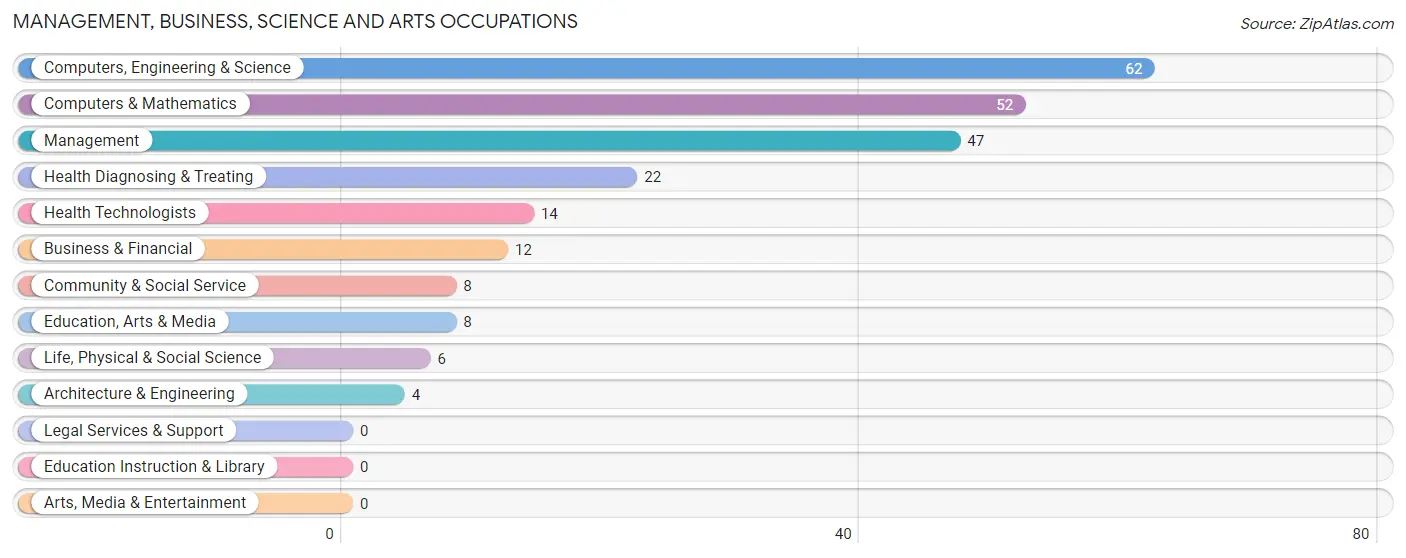
Management, Business, Science and Arts Occupations
The most common Management, Business, Science and Arts occupations in Greene are Computers, Engineering & Science (62 | 13.6%), Computers & Mathematics (52 | 11.4%), Management (47 | 10.3%), Health Diagnosing & Treating (22 | 4.8%), and Health Technologists (14 | 3.1%).
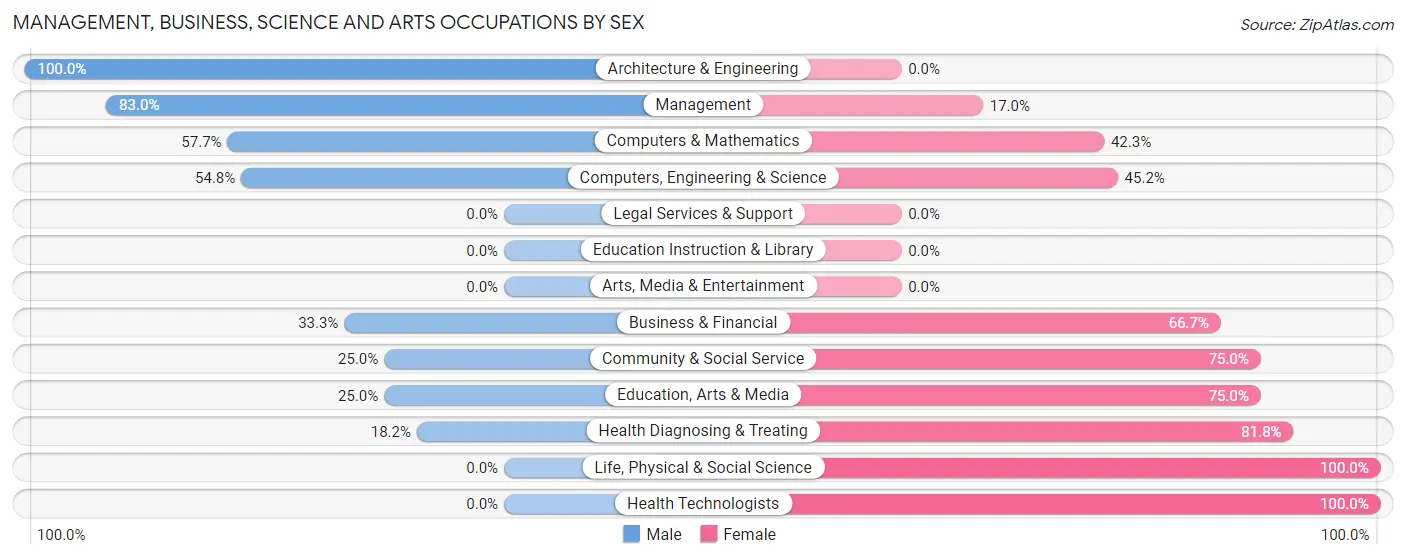
Management, Business, Science and Arts Occupations by Sex
Within the Management, Business, Science and Arts occupations in Greene, the most male-oriented occupations are Architecture & Engineering (100.0%), Management (83.0%), and Computers & Mathematics (57.7%), while the most female-oriented occupations are Life, Physical & Social Science (100.0%), Health Technologists (100.0%), and Health Diagnosing & Treating (81.8%).
| Occupation | Male | Female |
| Management | 39 (83.0%) | 8 (17.0%) |
| Business & Financial | 4 (33.3%) | 8 (66.7%) |
| Computers, Engineering & Science | 34 (54.8%) | 28 (45.2%) |
| Computers & Mathematics | 30 (57.7%) | 22 (42.3%) |
| Architecture & Engineering | 4 (100.0%) | 0 (0.0%) |
| Life, Physical & Social Science | 0 (0.0%) | 6 (100.0%) |
| Community & Social Service | 2 (25.0%) | 6 (75.0%) |
| Education, Arts & Media | 2 (25.0%) | 6 (75.0%) |
| Legal Services & Support | 0 (0.0%) | 0 (0.0%) |
| Education Instruction & Library | 0 (0.0%) | 0 (0.0%) |
| Arts, Media & Entertainment | 0 (0.0%) | 0 (0.0%) |
| Health Diagnosing & Treating | 4 (18.2%) | 18 (81.8%) |
| Health Technologists | 0 (0.0%) | 14 (100.0%) |
| Total (Category) | 83 (55.0%) | 68 (45.0%) |
| Total (Overall) | 279 (61.2%) | 177 (38.8%) |
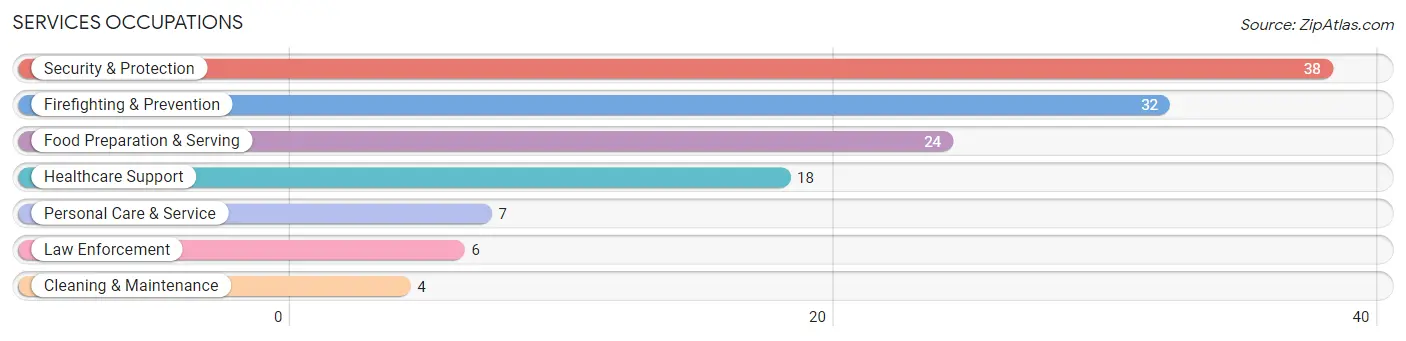
Services Occupations
The most common Services occupations in Greene are Security & Protection (38 | 8.3%), Firefighting & Prevention (32 | 7.0%), Food Preparation & Serving (24 | 5.3%), Healthcare Support (18 | 4.0%), and Personal Care & Service (7 | 1.5%).
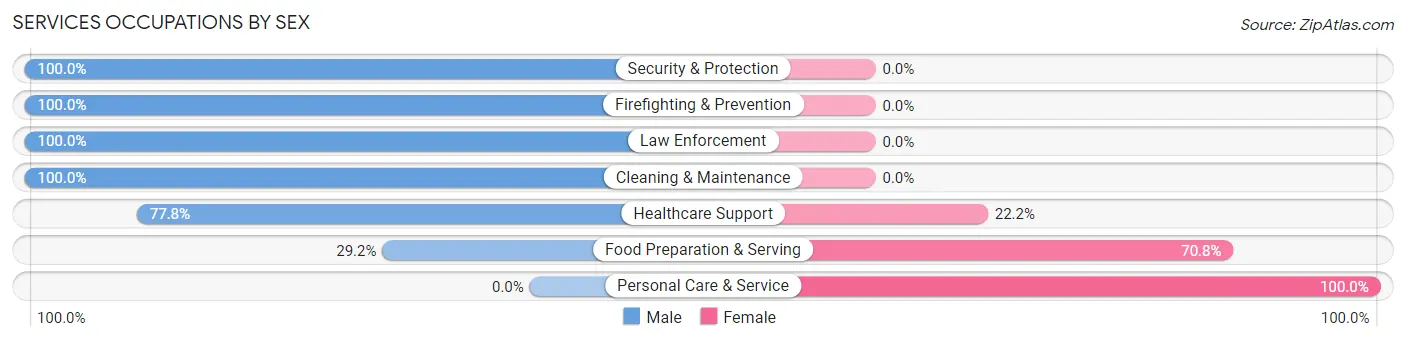
Services Occupations by Sex
Within the Services occupations in Greene, the most male-oriented occupations are Security & Protection (100.0%), Firefighting & Prevention (100.0%), and Law Enforcement (100.0%), while the most female-oriented occupations are Personal Care & Service (100.0%), Food Preparation & Serving (70.8%), and Healthcare Support (22.2%).
| Occupation | Male | Female |
| Healthcare Support | 14 (77.8%) | 4 (22.2%) |
| Security & Protection | 38 (100.0%) | 0 (0.0%) |
| Firefighting & Prevention | 32 (100.0%) | 0 (0.0%) |
| Law Enforcement | 6 (100.0%) | 0 (0.0%) |
| Food Preparation & Serving | 7 (29.2%) | 17 (70.8%) |
| Cleaning & Maintenance | 4 (100.0%) | 0 (0.0%) |
| Personal Care & Service | 0 (0.0%) | 7 (100.0%) |
| Total (Category) | 63 (69.2%) | 28 (30.8%) |
| Total (Overall) | 279 (61.2%) | 177 (38.8%) |
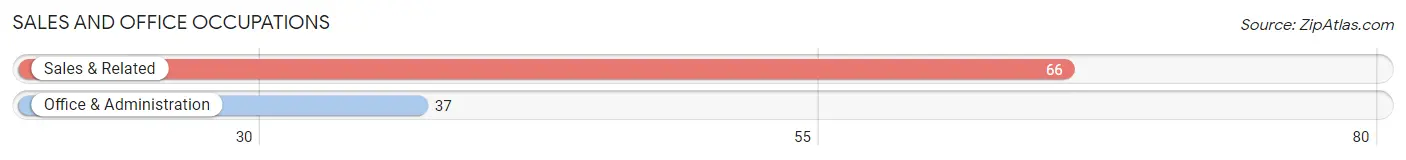
Sales and Office Occupations
The most common Sales and Office occupations in Greene are Sales & Related (66 | 14.5%), and Office & Administration (37 | 8.1%).
Sales and Office Occupations by Sex
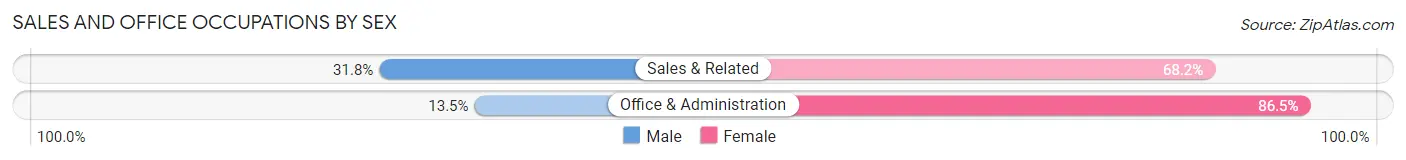
| Occupation | Male | Female |
| Sales & Related | 21 (31.8%) | 45 (68.2%) |
| Office & Administration | 5 (13.5%) | 32 (86.5%) |
| Total (Category) | 26 (25.2%) | 77 (74.8%) |
| Total (Overall) | 279 (61.2%) | 177 (38.8%) |
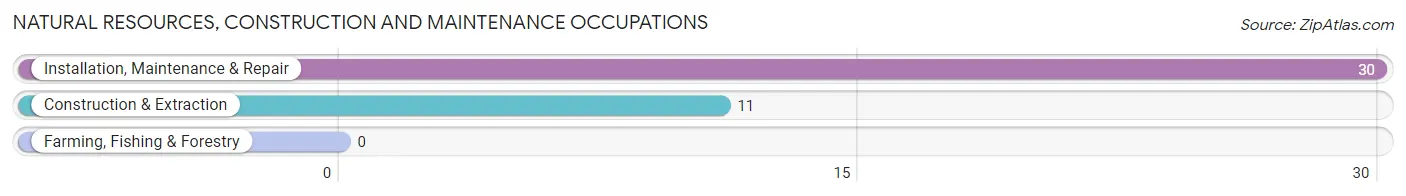
Natural Resources, Construction and Maintenance Occupations
The most common Natural Resources, Construction and Maintenance occupations in Greene are Installation, Maintenance & Repair (30 | 6.6%), and Construction & Extraction (11 | 2.4%).
Natural Resources, Construction and Maintenance Occupations by Sex
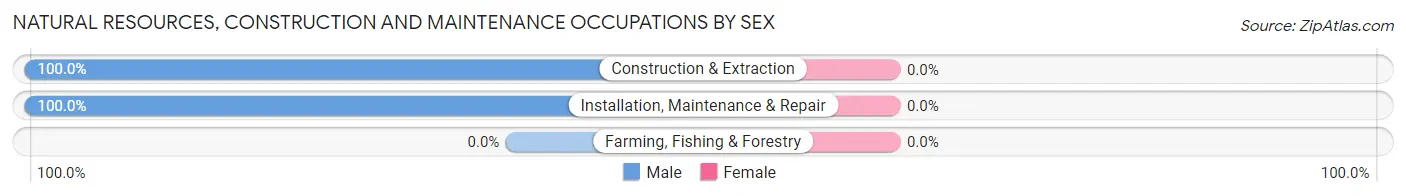
| Occupation | Male | Female |
| Farming, Fishing & Forestry | 0 (0.0%) | 0 (0.0%) |
| Construction & Extraction | 11 (100.0%) | 0 (0.0%) |
| Installation, Maintenance & Repair | 30 (100.0%) | 0 (0.0%) |
| Total (Category) | 41 (100.0%) | 0 (0.0%) |
| Total (Overall) | 279 (61.2%) | 177 (38.8%) |
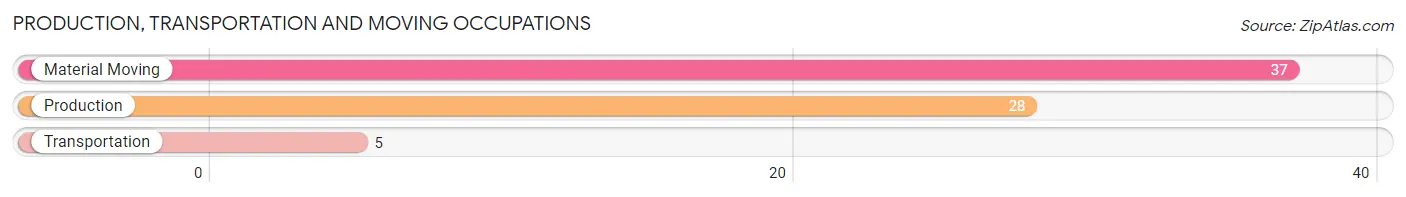
Production, Transportation and Moving Occupations
The most common Production, Transportation and Moving occupations in Greene are Material Moving (37 | 8.1%), Production (28 | 6.1%), and Transportation (5 | 1.1%).
Production, Transportation and Moving Occupations by Sex
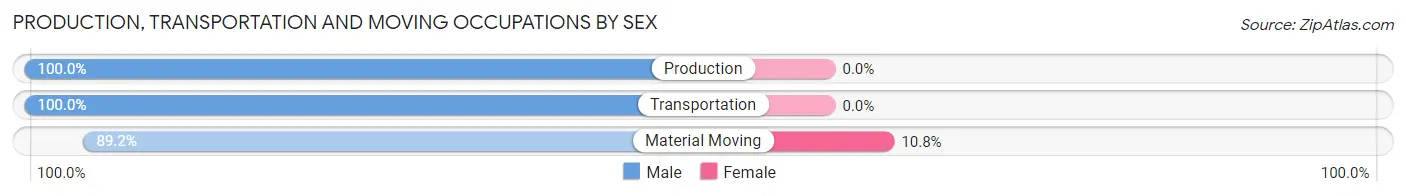
| Occupation | Male | Female |
| Production | 28 (100.0%) | 0 (0.0%) |
| Transportation | 5 (100.0%) | 0 (0.0%) |
| Material Moving | 33 (89.2%) | 4 (10.8%) |
| Total (Category) | 66 (94.3%) | 4 (5.7%) |
| Total (Overall) | 279 (61.2%) | 177 (38.8%) |
Employment Industries by Sex in Greene
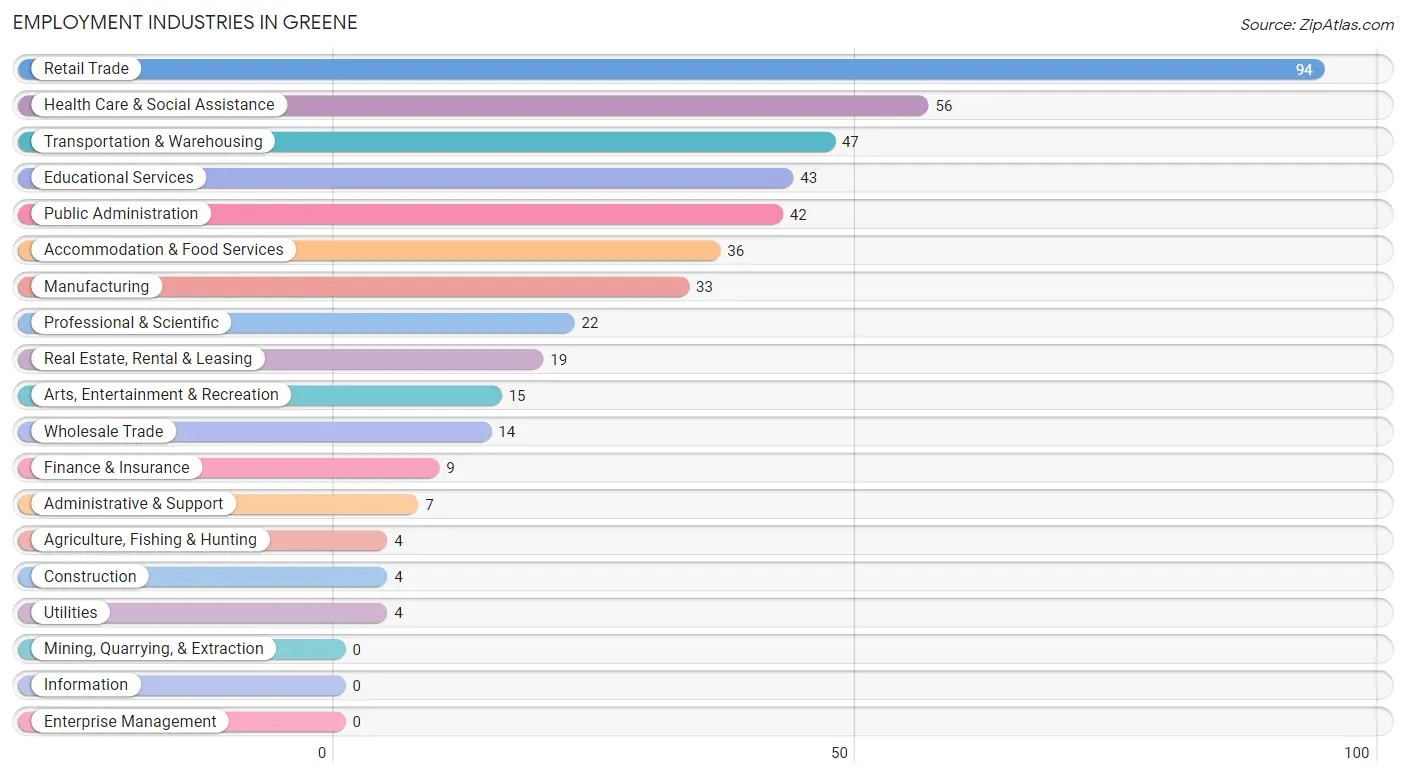
Employment Industries in Greene
The major employment industries in Greene include Retail Trade (94 | 20.6%), Health Care & Social Assistance (56 | 12.3%), Transportation & Warehousing (47 | 10.3%), Educational Services (43 | 9.4%), and Public Administration (42 | 9.2%).
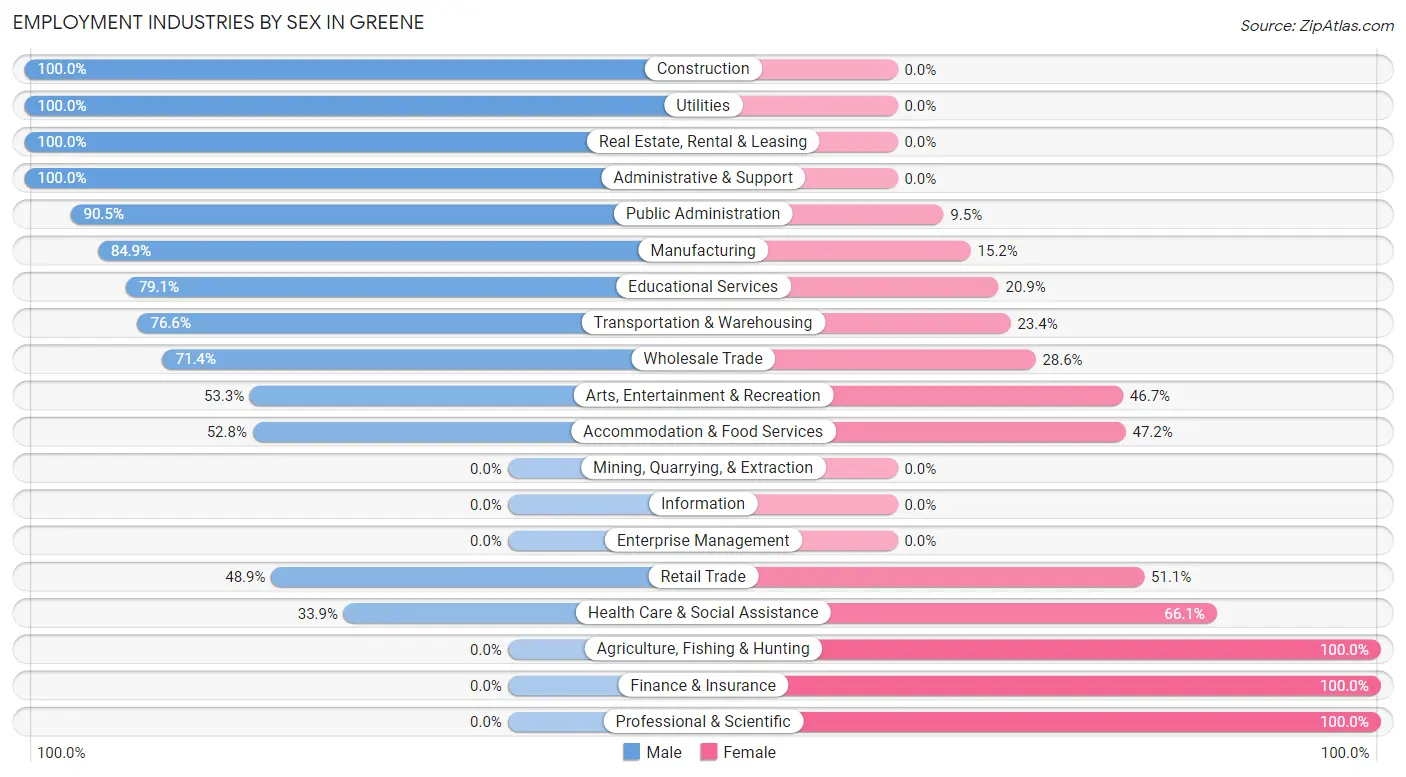
Employment Industries by Sex in Greene
The Greene industries that see more men than women are Construction (100.0%), Utilities (100.0%), and Real Estate, Rental & Leasing (100.0%), whereas the industries that tend to have a higher number of women are Agriculture, Fishing & Hunting (100.0%), Finance & Insurance (100.0%), and Professional & Scientific (100.0%).
| Industry | Male | Female |
| Agriculture, Fishing & Hunting | 0 (0.0%) | 4 (100.0%) |
| Mining, Quarrying, & Extraction | 0 (0.0%) | 0 (0.0%) |
| Construction | 4 (100.0%) | 0 (0.0%) |
| Manufacturing | 28 (84.9%) | 5 (15.1%) |
| Wholesale Trade | 10 (71.4%) | 4 (28.6%) |
| Retail Trade | 46 (48.9%) | 48 (51.1%) |
| Transportation & Warehousing | 36 (76.6%) | 11 (23.4%) |
| Utilities | 4 (100.0%) | 0 (0.0%) |
| Information | 0 (0.0%) | 0 (0.0%) |
| Finance & Insurance | 0 (0.0%) | 9 (100.0%) |
| Real Estate, Rental & Leasing | 19 (100.0%) | 0 (0.0%) |
| Professional & Scientific | 0 (0.0%) | 22 (100.0%) |
| Enterprise Management | 0 (0.0%) | 0 (0.0%) |
| Administrative & Support | 7 (100.0%) | 0 (0.0%) |
| Educational Services | 34 (79.1%) | 9 (20.9%) |
| Health Care & Social Assistance | 19 (33.9%) | 37 (66.1%) |
| Arts, Entertainment & Recreation | 8 (53.3%) | 7 (46.7%) |
| Accommodation & Food Services | 19 (52.8%) | 17 (47.2%) |
| Public Administration | 38 (90.5%) | 4 (9.5%) |
| Total | 279 (61.2%) | 177 (38.8%) |
Education in Greene
School Enrollment in Greene
The most common levels of schooling among the 282 students in Greene are high school (156 | 55.3%), middle school (40 | 14.2%), and elementary school (32 | 11.4%).
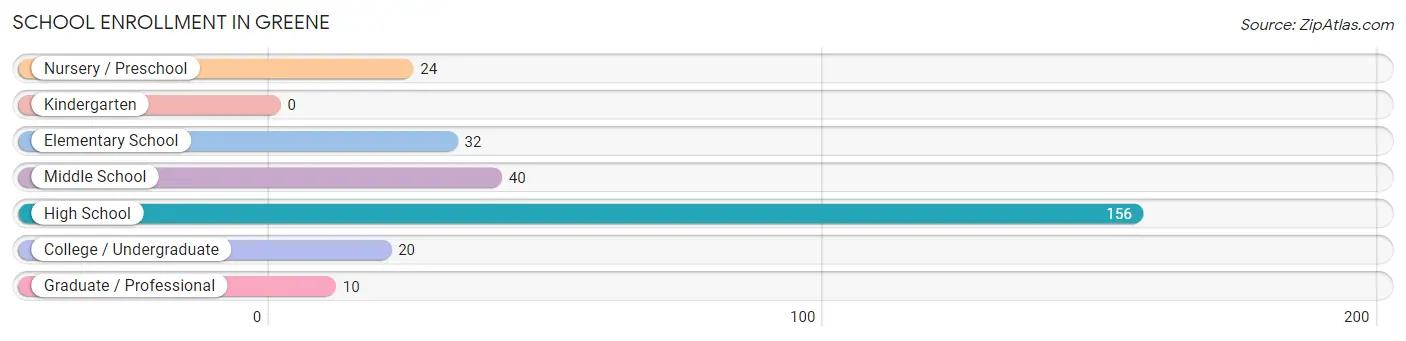
| School Level | # Students | % Students |
| Nursery / Preschool | 24 | 8.5% |
| Kindergarten | 0 | 0.0% |
| Elementary School | 32 | 11.4% |
| Middle School | 40 | 14.2% |
| High School | 156 | 55.3% |
| College / Undergraduate | 20 | 7.1% |
| Graduate / Professional | 10 | 3.5% |
| Total | 282 | 100.0% |
School Enrollment by Age by Funding Source in Greene
Out of a total of 282 students who are enrolled in schools in Greene, 4 (1.4%) attend a private institution, while the remaining 278 (98.6%) are enrolled in public schools. The age group of 35 years and over has the highest likelihood of being enrolled in private schools, with 4 (40.0% in the age bracket) enrolled. Conversely, the age group of 5 to 9 year old has the lowest likelihood of being enrolled in a private school, with 56 (100.0% in the age bracket) attending a public institution.
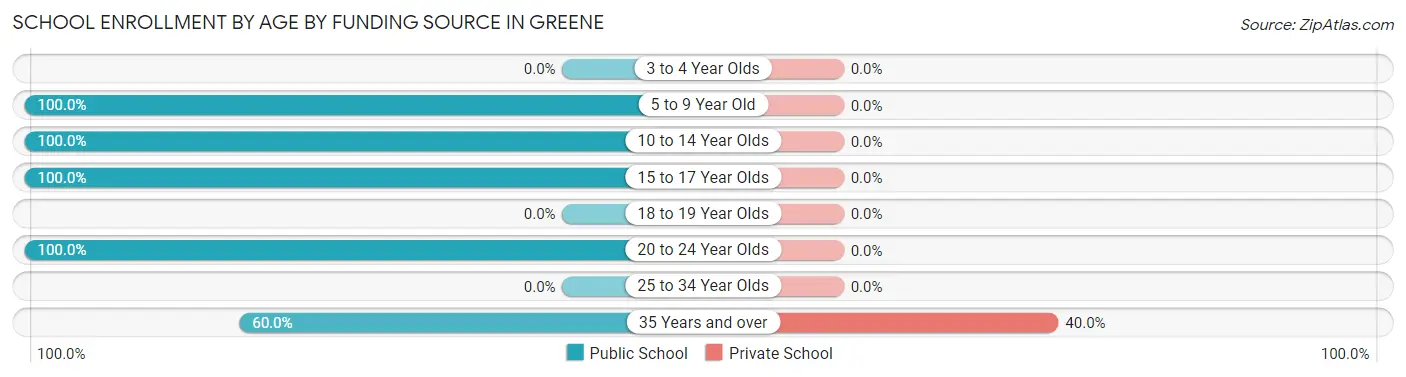
| Age Bracket | Public School | Private School |
| 3 to 4 Year Olds | 0 (0.0%) | 0 (0.0%) |
| 5 to 9 Year Old | 56 (100.0%) | 0 (0.0%) |
| 10 to 14 Year Olds | 40 (100.0%) | 0 (0.0%) |
| 15 to 17 Year Olds | 156 (100.0%) | 0 (0.0%) |
| 18 to 19 Year Olds | 0 (0.0%) | 0 (0.0%) |
| 20 to 24 Year Olds | 20 (100.0%) | 0 (0.0%) |
| 25 to 34 Year Olds | 0 (0.0%) | 0 (0.0%) |
| 35 Years and over | 6 (60.0%) | 4 (40.0%) |
| Total | 278 (98.6%) | 4 (1.4%) |
Educational Attainment by Field of Study in Greene
Education (74 | 28.0%), visual & performing arts (74 | 28.0%), science & technology (35 | 13.3%), bio, nature & agricultural (32 | 12.1%), and business (23 | 8.7%) are the most common fields of study among 264 individuals in Greene who have obtained a bachelor's degree or higher.
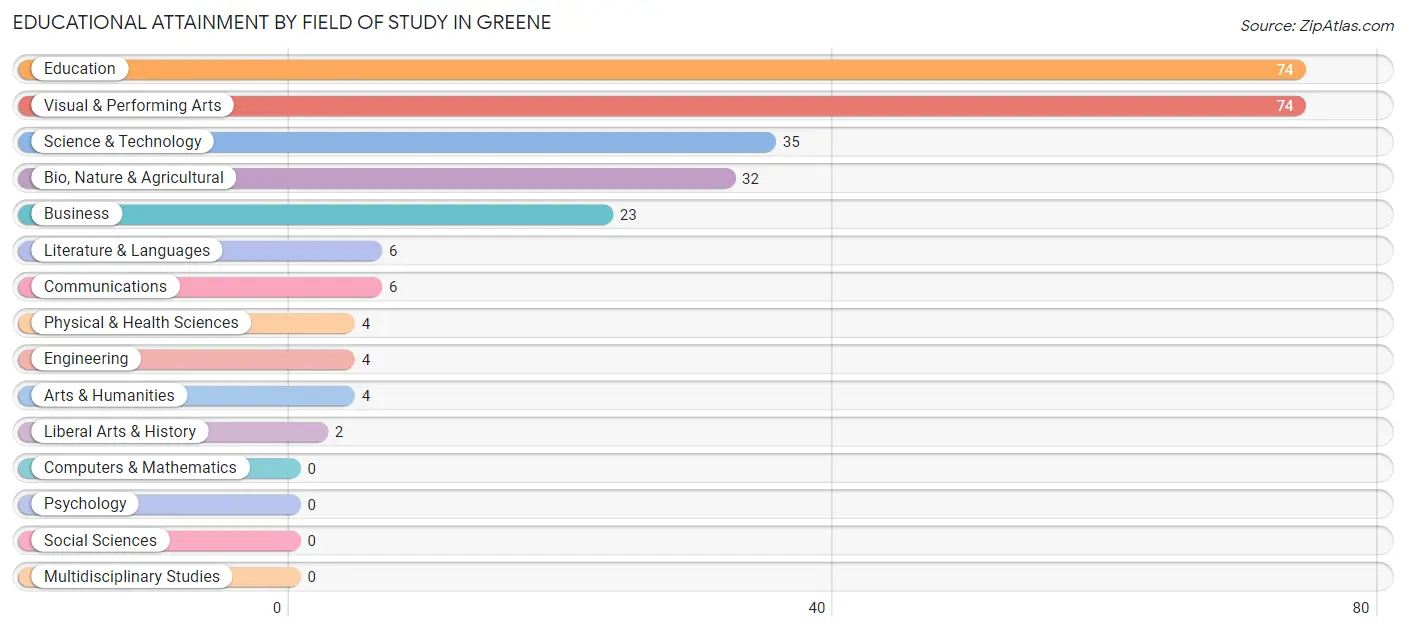
| Field of Study | # Graduates | % Graduates |
| Computers & Mathematics | 0 | 0.0% |
| Bio, Nature & Agricultural | 32 | 12.1% |
| Physical & Health Sciences | 4 | 1.5% |
| Psychology | 0 | 0.0% |
| Social Sciences | 0 | 0.0% |
| Engineering | 4 | 1.5% |
| Multidisciplinary Studies | 0 | 0.0% |
| Science & Technology | 35 | 13.3% |
| Business | 23 | 8.7% |
| Education | 74 | 28.0% |
| Literature & Languages | 6 | 2.3% |
| Liberal Arts & History | 2 | 0.8% |
| Visual & Performing Arts | 74 | 28.0% |
| Communications | 6 | 2.3% |
| Arts & Humanities | 4 | 1.5% |
| Total | 264 | 100.0% |
Transportation & Commute in Greene
Vehicle Availability by Sex in Greene
The most prevalent vehicle ownership categories in Greene are males with 2 vehicles (105, accounting for 38.3%) and females with 2 vehicles (60, making up 60.7%).
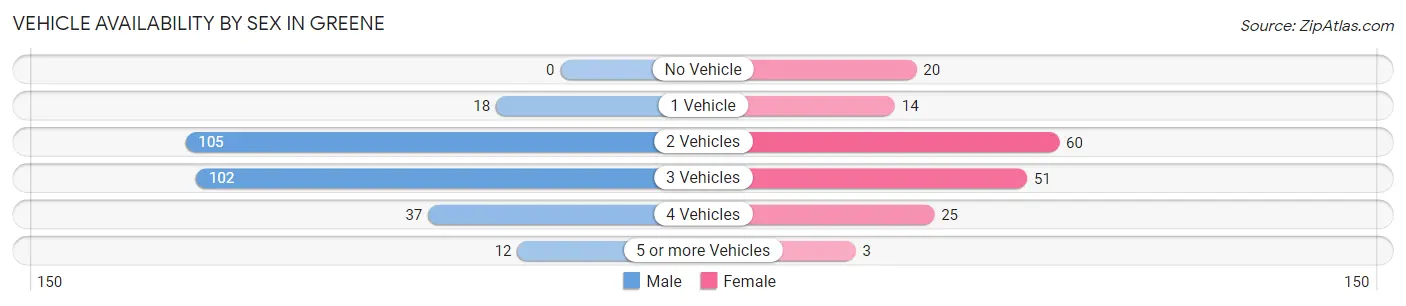
| Vehicles Available | Male | Female |
| No Vehicle | 0 (0.0%) | 20 (11.6%) |
| 1 Vehicle | 18 (6.6%) | 14 (8.1%) |
| 2 Vehicles | 105 (38.3%) | 60 (34.7%) |
| 3 Vehicles | 102 (37.2%) | 51 (29.5%) |
| 4 Vehicles | 37 (13.5%) | 25 (14.4%) |
| 5 or more Vehicles | 12 (4.4%) | 3 (1.7%) |
| Total | 274 (100.0%) | 173 (100.0%) |
Commute Time in Greene
The most frequently occuring commute durations in Greene are 45 to 59 minutes (85 commuters, 19.5%), 30 to 34 minutes (81 commuters, 18.6%), and 25 to 29 minutes (80 commuters, 18.3%).
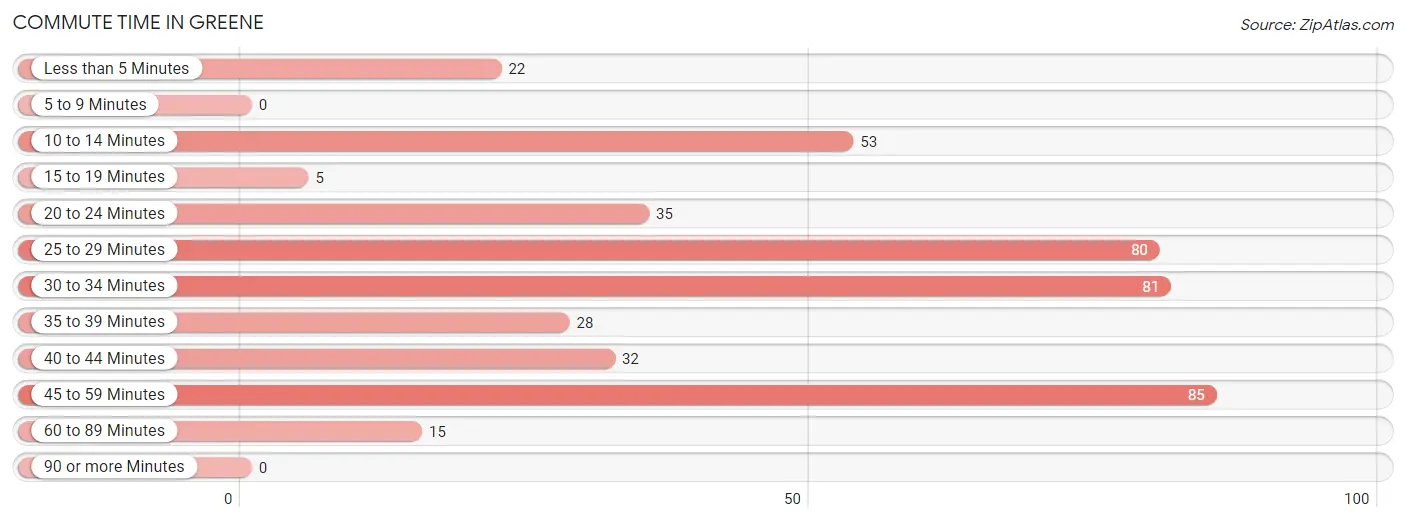
| Commute Time | # Commuters | % Commuters |
| Less than 5 Minutes | 22 | 5.1% |
| 5 to 9 Minutes | 0 | 0.0% |
| 10 to 14 Minutes | 53 | 12.2% |
| 15 to 19 Minutes | 5 | 1.1% |
| 20 to 24 Minutes | 35 | 8.0% |
| 25 to 29 Minutes | 80 | 18.3% |
| 30 to 34 Minutes | 81 | 18.6% |
| 35 to 39 Minutes | 28 | 6.4% |
| 40 to 44 Minutes | 32 | 7.3% |
| 45 to 59 Minutes | 85 | 19.5% |
| 60 to 89 Minutes | 15 | 3.4% |
| 90 or more Minutes | 0 | 0.0% |
Commute Time by Sex in Greene
The most common commute times in Greene are 45 to 59 minutes (72 commuters, 27.0%) for males and 30 to 34 minutes (42 commuters, 24.8%) for females.
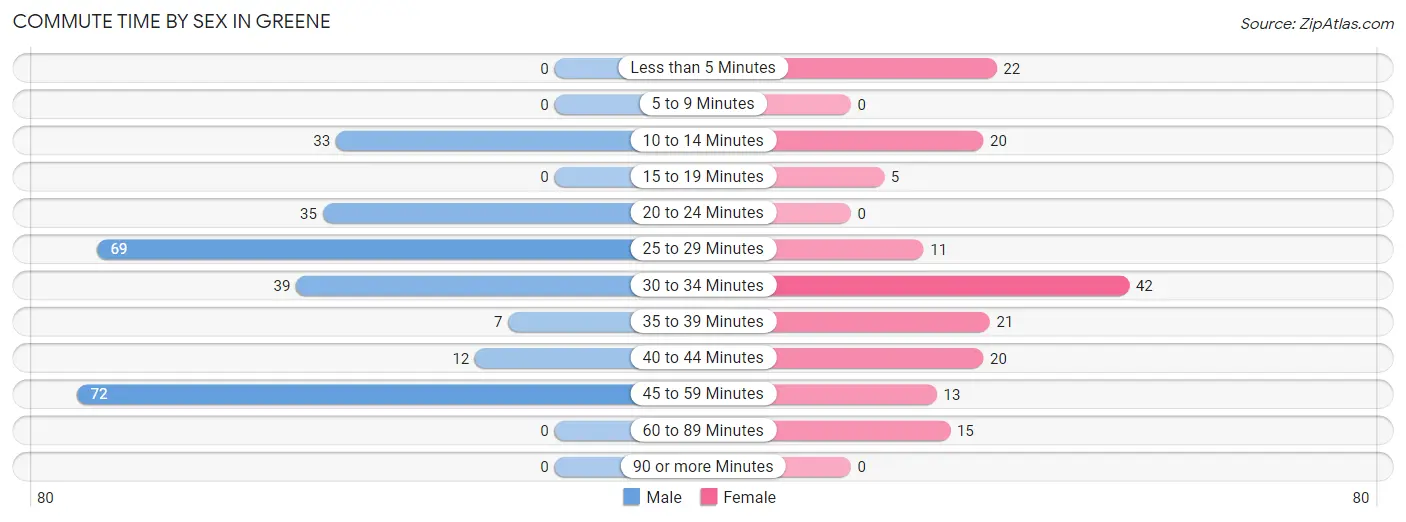
| Commute Time | Male | Female |
| Less than 5 Minutes | 0 (0.0%) | 22 (13.0%) |
| 5 to 9 Minutes | 0 (0.0%) | 0 (0.0%) |
| 10 to 14 Minutes | 33 (12.4%) | 20 (11.8%) |
| 15 to 19 Minutes | 0 (0.0%) | 5 (3.0%) |
| 20 to 24 Minutes | 35 (13.1%) | 0 (0.0%) |
| 25 to 29 Minutes | 69 (25.8%) | 11 (6.5%) |
| 30 to 34 Minutes | 39 (14.6%) | 42 (24.8%) |
| 35 to 39 Minutes | 7 (2.6%) | 21 (12.4%) |
| 40 to 44 Minutes | 12 (4.5%) | 20 (11.8%) |
| 45 to 59 Minutes | 72 (27.0%) | 13 (7.7%) |
| 60 to 89 Minutes | 0 (0.0%) | 15 (8.9%) |
| 90 or more Minutes | 0 (0.0%) | 0 (0.0%) |
Time of Departure to Work by Sex in Greene
The most frequent times of departure to work in Greene are 6:00 AM to 6:29 AM (58, 21.7%) for males and 7:00 AM to 7:29 AM (34, 20.1%) for females.
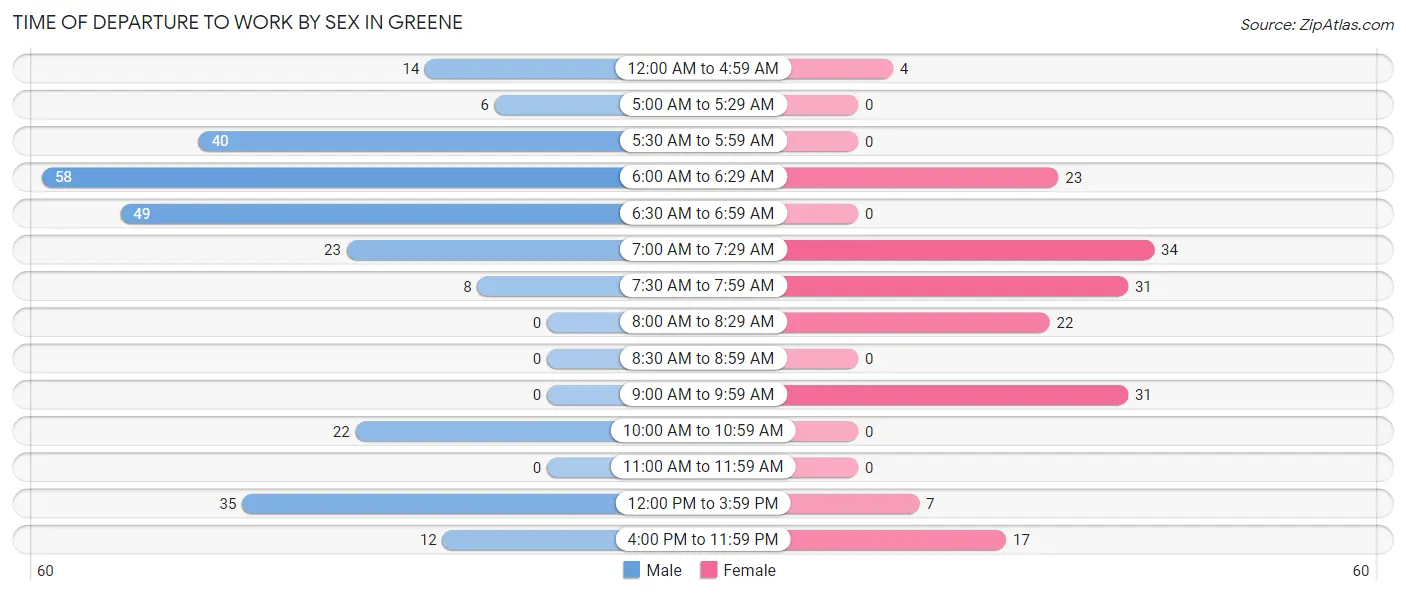
| Time of Departure | Male | Female |
| 12:00 AM to 4:59 AM | 14 (5.2%) | 4 (2.4%) |
| 5:00 AM to 5:29 AM | 6 (2.2%) | 0 (0.0%) |
| 5:30 AM to 5:59 AM | 40 (15.0%) | 0 (0.0%) |
| 6:00 AM to 6:29 AM | 58 (21.7%) | 23 (13.6%) |
| 6:30 AM to 6:59 AM | 49 (18.3%) | 0 (0.0%) |
| 7:00 AM to 7:29 AM | 23 (8.6%) | 34 (20.1%) |
| 7:30 AM to 7:59 AM | 8 (3.0%) | 31 (18.3%) |
| 8:00 AM to 8:29 AM | 0 (0.0%) | 22 (13.0%) |
| 8:30 AM to 8:59 AM | 0 (0.0%) | 0 (0.0%) |
| 9:00 AM to 9:59 AM | 0 (0.0%) | 31 (18.3%) |
| 10:00 AM to 10:59 AM | 22 (8.2%) | 0 (0.0%) |
| 11:00 AM to 11:59 AM | 0 (0.0%) | 0 (0.0%) |
| 12:00 PM to 3:59 PM | 35 (13.1%) | 7 (4.1%) |
| 4:00 PM to 11:59 PM | 12 (4.5%) | 17 (10.1%) |
| Total | 267 (100.0%) | 169 (100.0%) |
Housing Occupancy in Greene
Occupancy by Ownership in Greene
Of the total 330 dwellings in Greene, owner-occupied units account for 330 (100.0%), while renter-occupied units make up 0 (0.0%).
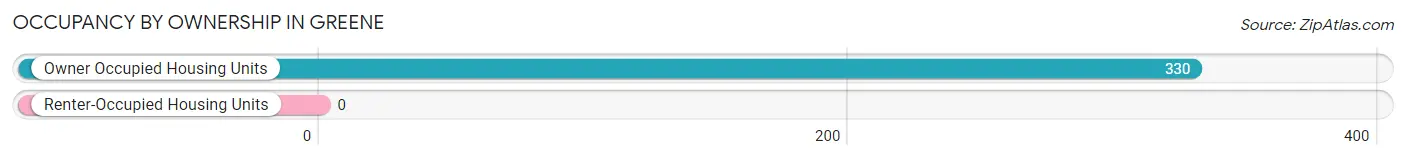
| Occupancy | # Housing Units | % Housing Units |
| Owner Occupied Housing Units | 330 | 100.0% |
| Renter-Occupied Housing Units | 0 | 0.0% |
| Total Occupied Housing Units | 330 | 100.0% |
Occupancy by Household Size in Greene
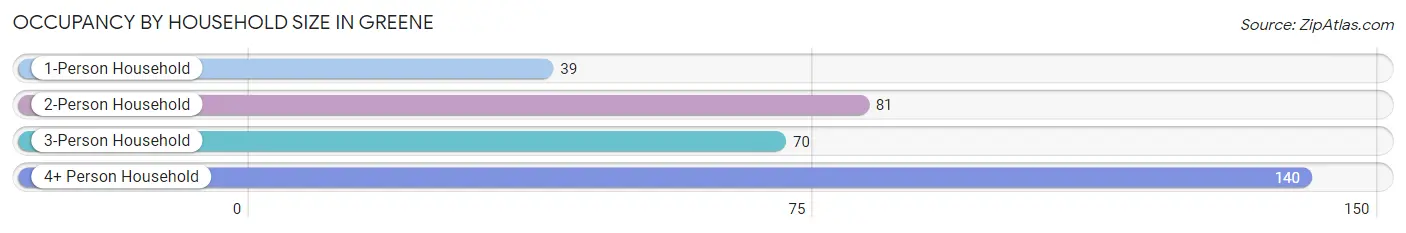
| Household Size | # Housing Units | % Housing Units |
| 1-Person Household | 39 | 11.8% |
| 2-Person Household | 81 | 24.5% |
| 3-Person Household | 70 | 21.2% |
| 4+ Person Household | 140 | 42.4% |
| Total Housing Units | 330 | 100.0% |
Occupancy by Ownership by Household Size in Greene
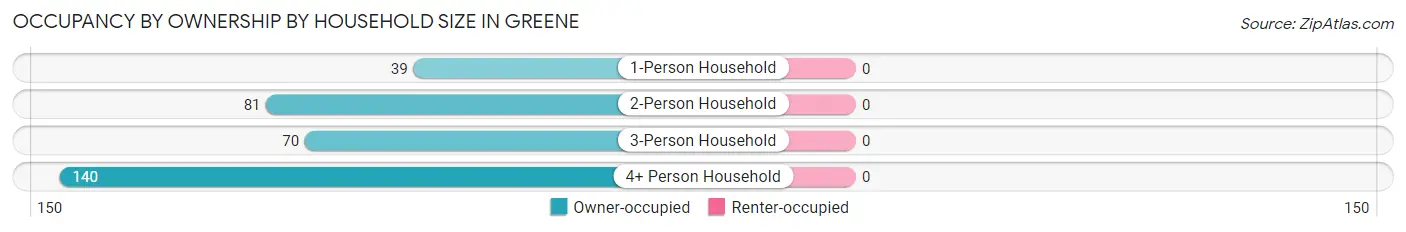
| Household Size | Owner-occupied | Renter-occupied |
| 1-Person Household | 39 (100.0%) | 0 (0.0%) |
| 2-Person Household | 81 (100.0%) | 0 (0.0%) |
| 3-Person Household | 70 (100.0%) | 0 (0.0%) |
| 4+ Person Household | 140 (100.0%) | 0 (0.0%) |
| Total Housing Units | 330 (100.0%) | 0 (0.0%) |
Occupancy by Educational Attainment in Greene
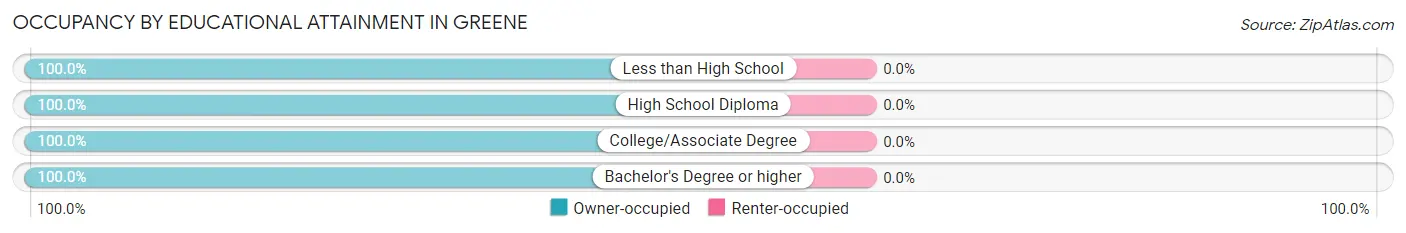
| Household Size | Owner-occupied | Renter-occupied |
| Less than High School | 19 (100.0%) | 0 (0.0%) |
| High School Diploma | 79 (100.0%) | 0 (0.0%) |
| College/Associate Degree | 120 (100.0%) | 0 (0.0%) |
| Bachelor's Degree or higher | 112 (100.0%) | 0 (0.0%) |
Occupancy by Age of Householder in Greene
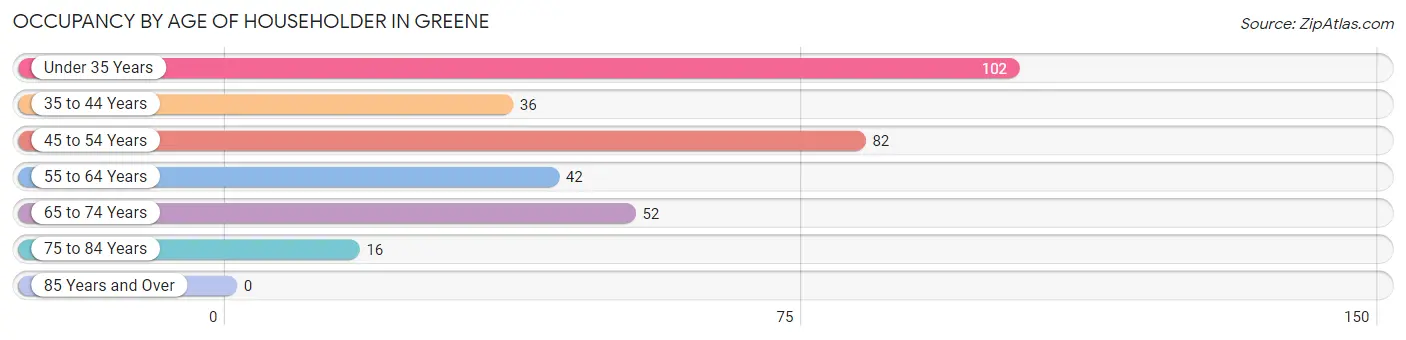
| Age Bracket | # Households | % Households |
| Under 35 Years | 102 | 30.9% |
| 35 to 44 Years | 36 | 10.9% |
| 45 to 54 Years | 82 | 24.8% |
| 55 to 64 Years | 42 | 12.7% |
| 65 to 74 Years | 52 | 15.8% |
| 75 to 84 Years | 16 | 4.9% |
| 85 Years and Over | 0 | 0.0% |
| Total | 330 | 100.0% |
Housing Finances in Greene
Median Income by Occupancy in Greene
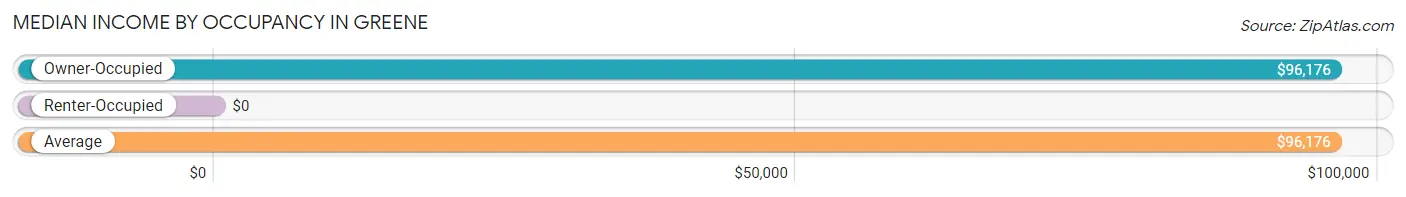
| Occupancy Type | # Households | Median Income |
| Owner-Occupied | 330 (100.0%) | $96,176 |
| Renter-Occupied | 0 (0.0%) | $0 |
| Average | 330 (100.0%) | $96,176 |
Occupancy by Householder Income Bracket in Greene
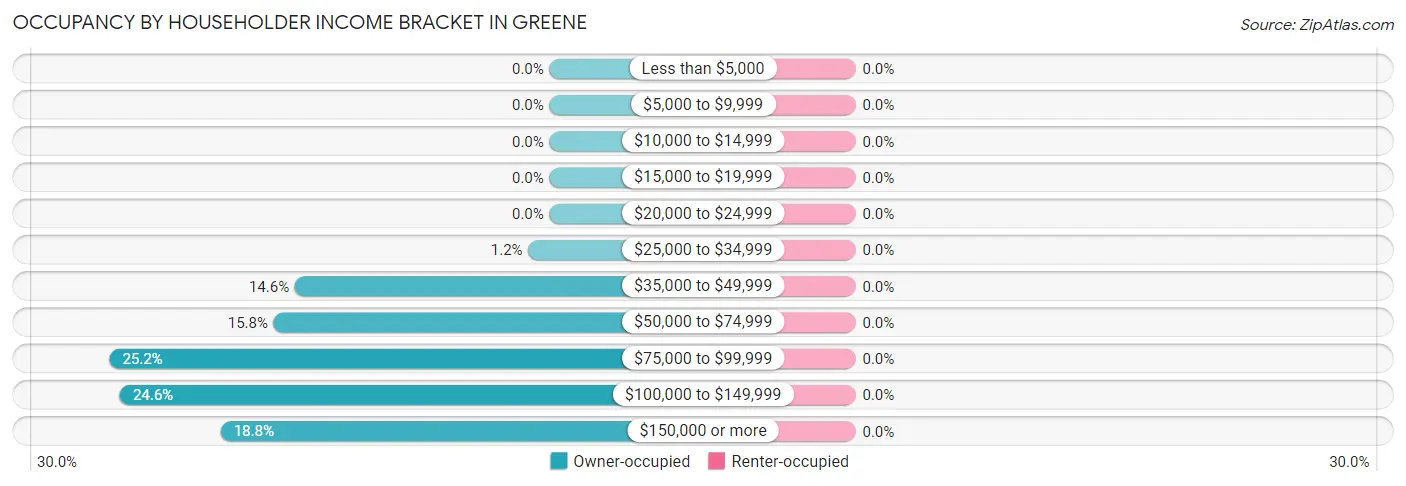
| Income Bracket | Owner-occupied | Renter-occupied |
| Less than $5,000 | 0 (0.0%) | 0 (0.0%) |
| $5,000 to $9,999 | 0 (0.0%) | 0 (0.0%) |
| $10,000 to $14,999 | 0 (0.0%) | 0 (0.0%) |
| $15,000 to $19,999 | 0 (0.0%) | 0 (0.0%) |
| $20,000 to $24,999 | 0 (0.0%) | 0 (0.0%) |
| $25,000 to $34,999 | 4 (1.2%) | 0 (0.0%) |
| $35,000 to $49,999 | 48 (14.5%) | 0 (0.0%) |
| $50,000 to $74,999 | 52 (15.8%) | 0 (0.0%) |
| $75,000 to $99,999 | 83 (25.2%) | 0 (0.0%) |
| $100,000 to $149,999 | 81 (24.5%) | 0 (0.0%) |
| $150,000 or more | 62 (18.8%) | 0 (0.0%) |
| Total | 330 (100.0%) | 0 (0.0%) |
Monthly Housing Cost Tiers in Greene
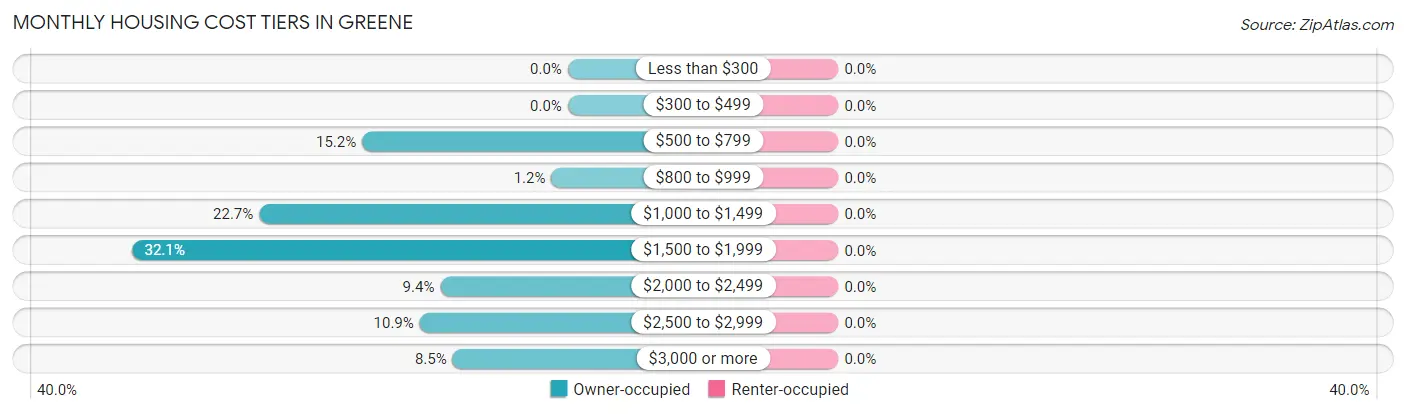
| Monthly Cost | Owner-occupied | Renter-occupied |
| Less than $300 | 0 (0.0%) | 0 (0.0%) |
| $300 to $499 | 0 (0.0%) | 0 (0.0%) |
| $500 to $799 | 50 (15.1%) | 0 (0.0%) |
| $800 to $999 | 4 (1.2%) | 0 (0.0%) |
| $1,000 to $1,499 | 75 (22.7%) | 0 (0.0%) |
| $1,500 to $1,999 | 106 (32.1%) | 0 (0.0%) |
| $2,000 to $2,499 | 31 (9.4%) | 0 (0.0%) |
| $2,500 to $2,999 | 36 (10.9%) | 0 (0.0%) |
| $3,000 or more | 28 (8.5%) | 0 (0.0%) |
| Total | 330 (100.0%) | 0 (0.0%) |
Physical Housing Characteristics in Greene
Housing Structures in Greene
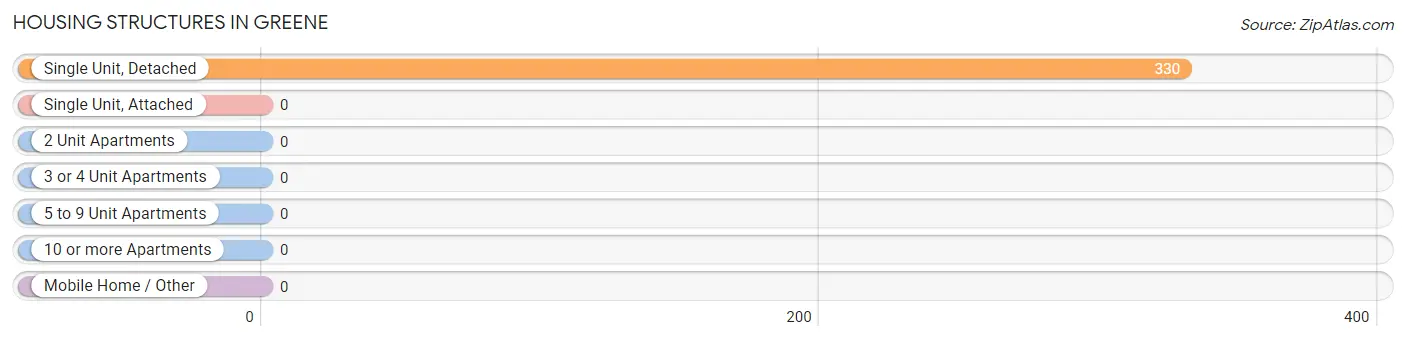
| Structure Type | # Housing Units | % Housing Units |
| Single Unit, Detached | 330 | 100.0% |
| Single Unit, Attached | 0 | 0.0% |
| 2 Unit Apartments | 0 | 0.0% |
| 3 or 4 Unit Apartments | 0 | 0.0% |
| 5 to 9 Unit Apartments | 0 | 0.0% |
| 10 or more Apartments | 0 | 0.0% |
| Mobile Home / Other | 0 | 0.0% |
| Total | 330 | 100.0% |
Housing Structures by Occupancy in Greene
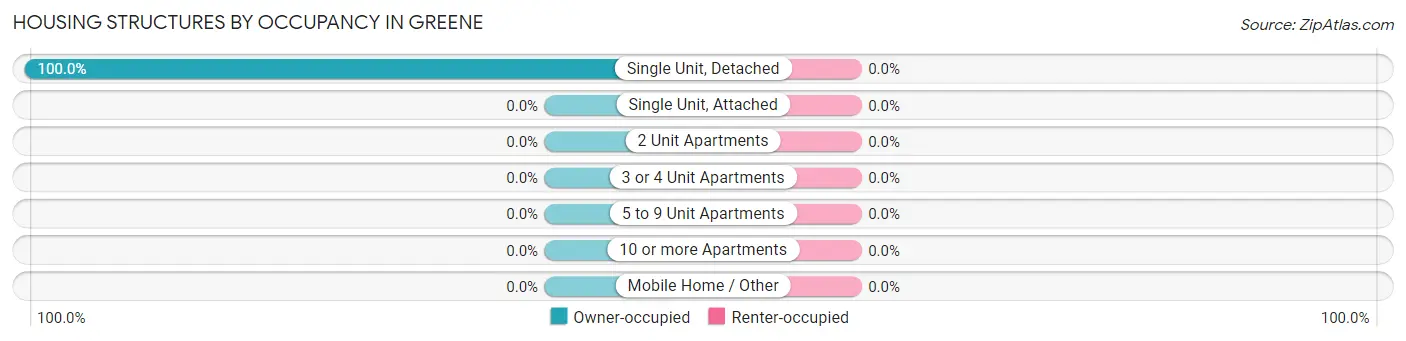
| Structure Type | Owner-occupied | Renter-occupied |
| Single Unit, Detached | 330 (100.0%) | 0 (0.0%) |
| Single Unit, Attached | 0 (0.0%) | 0 (0.0%) |
| 2 Unit Apartments | 0 (0.0%) | 0 (0.0%) |
| 3 or 4 Unit Apartments | 0 (0.0%) | 0 (0.0%) |
| 5 to 9 Unit Apartments | 0 (0.0%) | 0 (0.0%) |
| 10 or more Apartments | 0 (0.0%) | 0 (0.0%) |
| Mobile Home / Other | 0 (0.0%) | 0 (0.0%) |
| Total | 330 (100.0%) | 0 (0.0%) |
Housing Structures by Number of Rooms in Greene
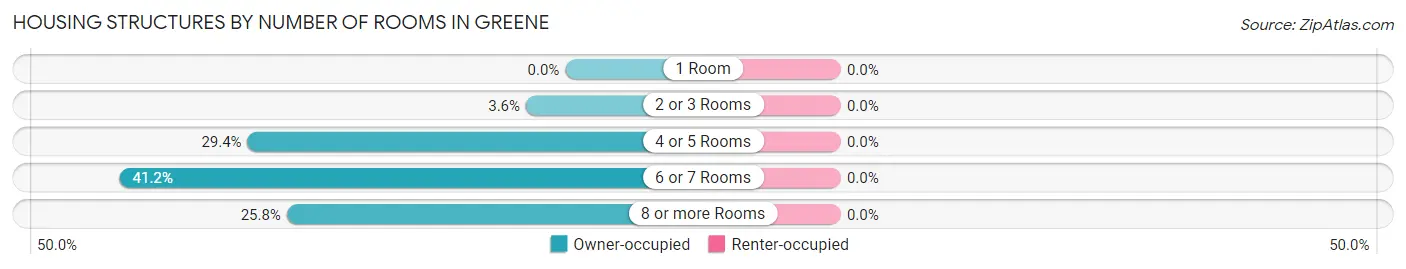
| Number of Rooms | Owner-occupied | Renter-occupied |
| 1 Room | 0 (0.0%) | 0 (0.0%) |
| 2 or 3 Rooms | 12 (3.6%) | 0 (0.0%) |
| 4 or 5 Rooms | 97 (29.4%) | 0 (0.0%) |
| 6 or 7 Rooms | 136 (41.2%) | 0 (0.0%) |
| 8 or more Rooms | 85 (25.8%) | 0 (0.0%) |
| Total | 330 (100.0%) | 0 (0.0%) |
Housing Structure by Heating Type in Greene
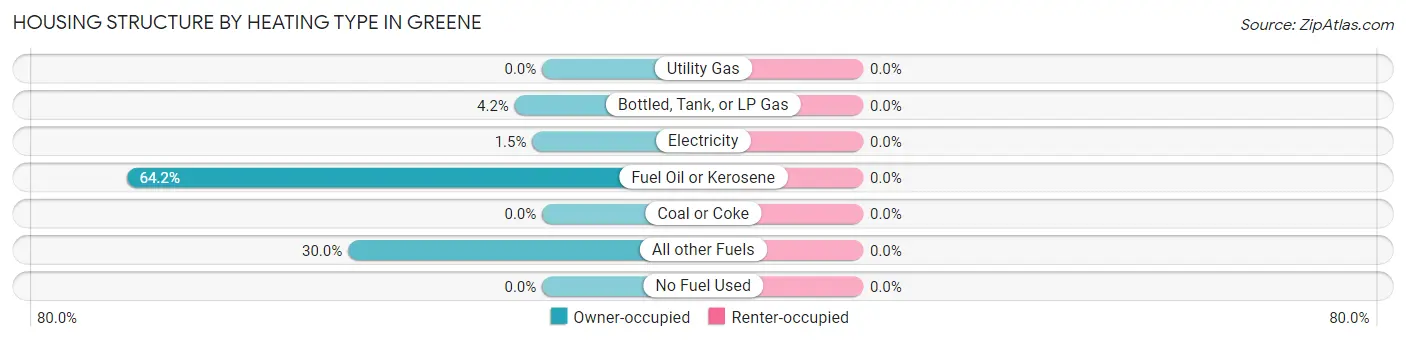
| Heating Type | Owner-occupied | Renter-occupied |
| Utility Gas | 0 (0.0%) | 0 (0.0%) |
| Bottled, Tank, or LP Gas | 14 (4.2%) | 0 (0.0%) |
| Electricity | 5 (1.5%) | 0 (0.0%) |
| Fuel Oil or Kerosene | 212 (64.2%) | 0 (0.0%) |
| Coal or Coke | 0 (0.0%) | 0 (0.0%) |
| All other Fuels | 99 (30.0%) | 0 (0.0%) |
| No Fuel Used | 0 (0.0%) | 0 (0.0%) |
| Total | 330 (100.0%) | 0 (0.0%) |
Household Vehicle Usage in Greene
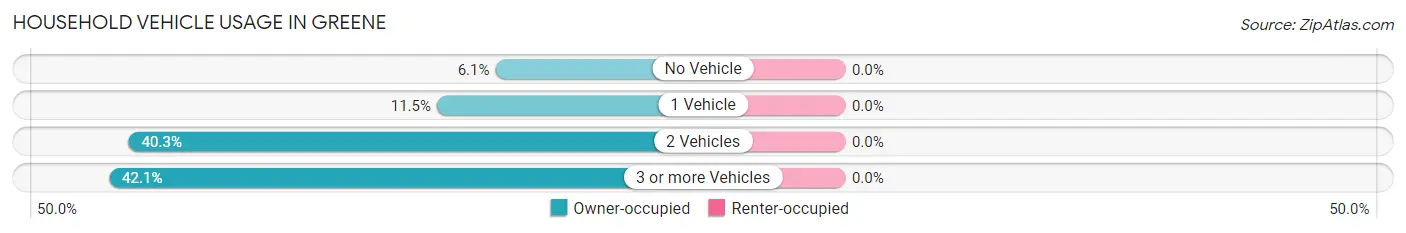
| Vehicles per Household | Owner-occupied | Renter-occupied |
| No Vehicle | 20 (6.1%) | 0 (0.0%) |
| 1 Vehicle | 38 (11.5%) | 0 (0.0%) |
| 2 Vehicles | 133 (40.3%) | 0 (0.0%) |
| 3 or more Vehicles | 139 (42.1%) | 0 (0.0%) |
| Total | 330 (100.0%) | 0 (0.0%) |
Real Estate & Mortgages in Greene
Real Estate and Mortgage Overview in Greene
| Characteristic | Without Mortgage | With Mortgage |
| Housing Units | 88 | 242 |
| Median Property Value | $275,800 | $361,600 |
| Median Household Income | $55,417 | $58 |
| Monthly Housing Costs | $760 | $28 |
| Real Estate Taxes | $6,193 | $0 |
Property Value by Mortgage Status in Greene
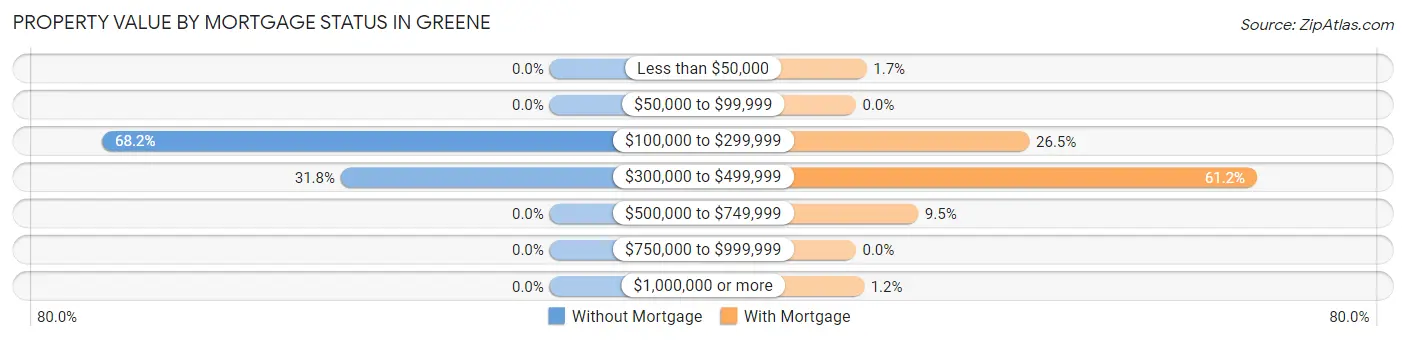
| Property Value | Without Mortgage | With Mortgage |
| Less than $50,000 | 0 (0.0%) | 4 (1.7%) |
| $50,000 to $99,999 | 0 (0.0%) | 0 (0.0%) |
| $100,000 to $299,999 | 60 (68.2%) | 64 (26.5%) |
| $300,000 to $499,999 | 28 (31.8%) | 148 (61.2%) |
| $500,000 to $749,999 | 0 (0.0%) | 23 (9.5%) |
| $750,000 to $999,999 | 0 (0.0%) | 0 (0.0%) |
| $1,000,000 or more | 0 (0.0%) | 3 (1.2%) |
| Total | 88 (100.0%) | 242 (100.0%) |
Household Income by Mortgage Status in Greene
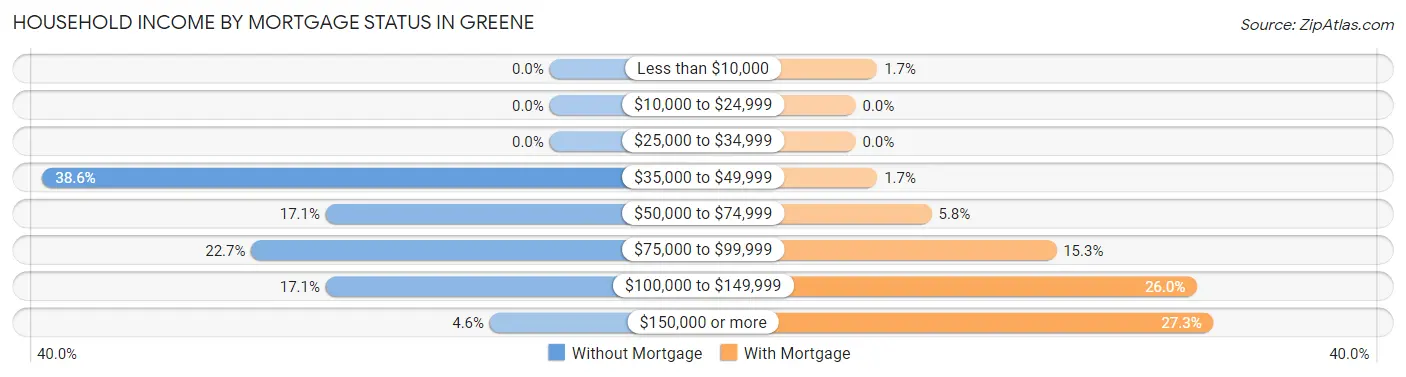
| Household Income | Without Mortgage | With Mortgage |
| Less than $10,000 | 0 (0.0%) | 4 (1.7%) |
| $10,000 to $24,999 | 0 (0.0%) | 0 (0.0%) |
| $25,000 to $34,999 | 0 (0.0%) | 0 (0.0%) |
| $35,000 to $49,999 | 34 (38.6%) | 4 (1.7%) |
| $50,000 to $74,999 | 15 (17.1%) | 14 (5.8%) |
| $75,000 to $99,999 | 20 (22.7%) | 37 (15.3%) |
| $100,000 to $149,999 | 15 (17.1%) | 63 (26.0%) |
| $150,000 or more | 4 (4.5%) | 66 (27.3%) |
| Total | 88 (100.0%) | 242 (100.0%) |
Property Value to Household Income Ratio in Greene
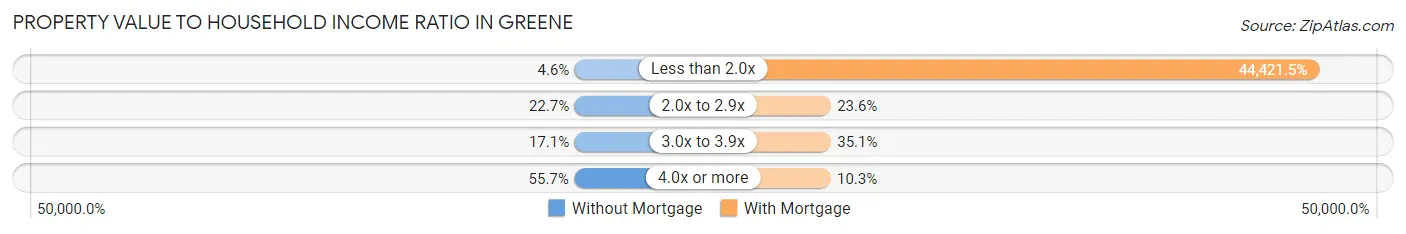
| Value-to-Income Ratio | Without Mortgage | With Mortgage |
| Less than 2.0x | 4 (4.5%) | 107,500 (44,421.5%) |
| 2.0x to 2.9x | 20 (22.7%) | 57 (23.5%) |
| 3.0x to 3.9x | 15 (17.1%) | 85 (35.1%) |
| 4.0x or more | 49 (55.7%) | 25 (10.3%) |
| Total | 88 (100.0%) | 242 (100.0%) |
Real Estate Taxes by Mortgage Status in Greene
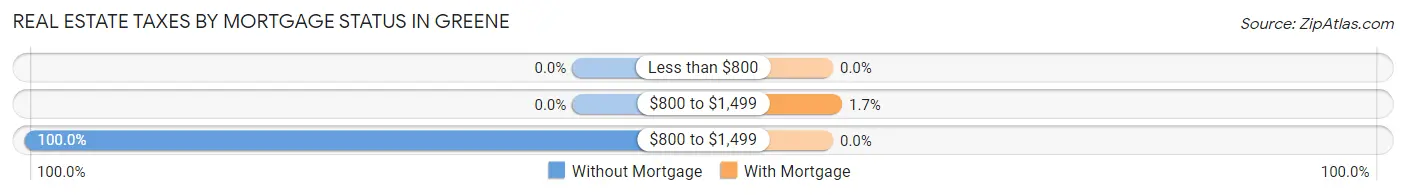
| Property Taxes | Without Mortgage | With Mortgage |
| Less than $800 | 0 (0.0%) | 0 (0.0%) |
| $800 to $1,499 | 0 (0.0%) | 4 (1.7%) |
| $800 to $1,499 | 88 (100.0%) | 0 (0.0%) |
| Total | 88 (100.0%) | 242 (100.0%) |
Health & Disability in Greene
Health Insurance Coverage by Age in Greene
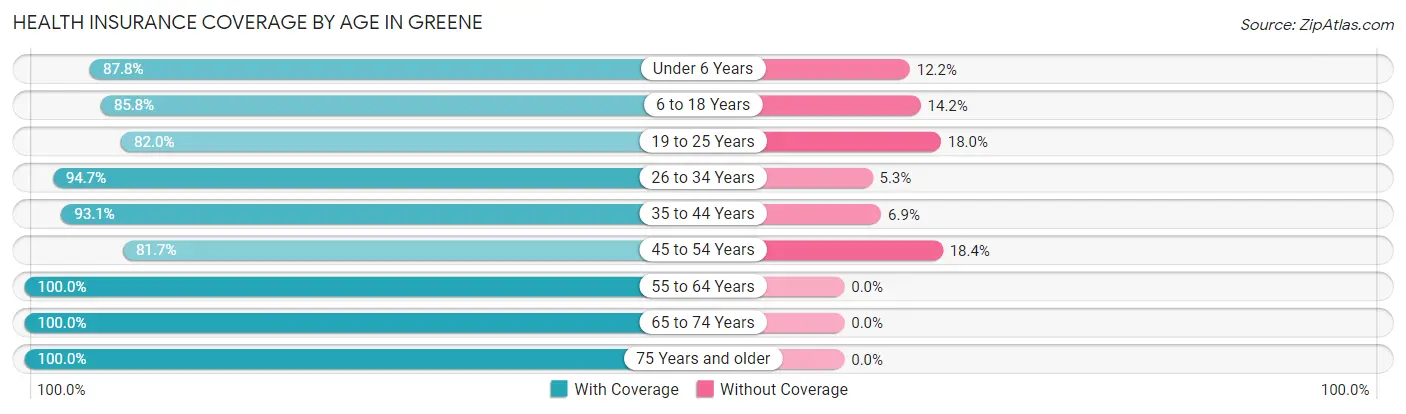
| Age Bracket | With Coverage | Without Coverage |
| Under 6 Years | 79 (87.8%) | 11 (12.2%) |
| 6 to 18 Years | 217 (85.8%) | 36 (14.2%) |
| 19 to 25 Years | 41 (82.0%) | 9 (18.0%) |
| 26 to 34 Years | 198 (94.7%) | 11 (5.3%) |
| 35 to 44 Years | 122 (93.1%) | 9 (6.9%) |
| 45 to 54 Years | 129 (81.7%) | 29 (18.3%) |
| 55 to 64 Years | 72 (100.0%) | 0 (0.0%) |
| 65 to 74 Years | 79 (100.0%) | 0 (0.0%) |
| 75 Years and older | 28 (100.0%) | 0 (0.0%) |
| Total | 965 (90.2%) | 105 (9.8%) |
Health Insurance Coverage by Citizenship Status in Greene
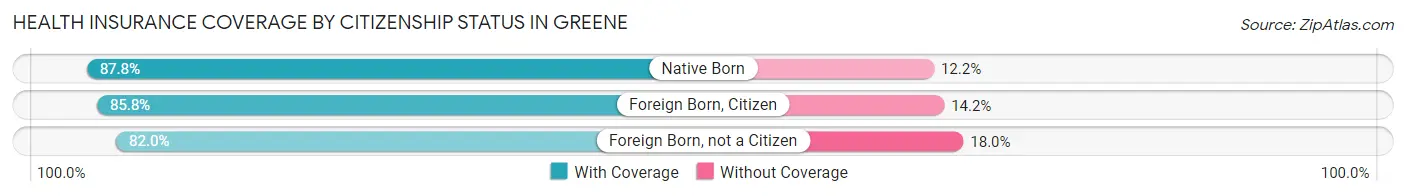
| Citizenship Status | With Coverage | Without Coverage |
| Native Born | 79 (87.8%) | 11 (12.2%) |
| Foreign Born, Citizen | 217 (85.8%) | 36 (14.2%) |
| Foreign Born, not a Citizen | 41 (82.0%) | 9 (18.0%) |
Health Insurance Coverage by Household Income in Greene
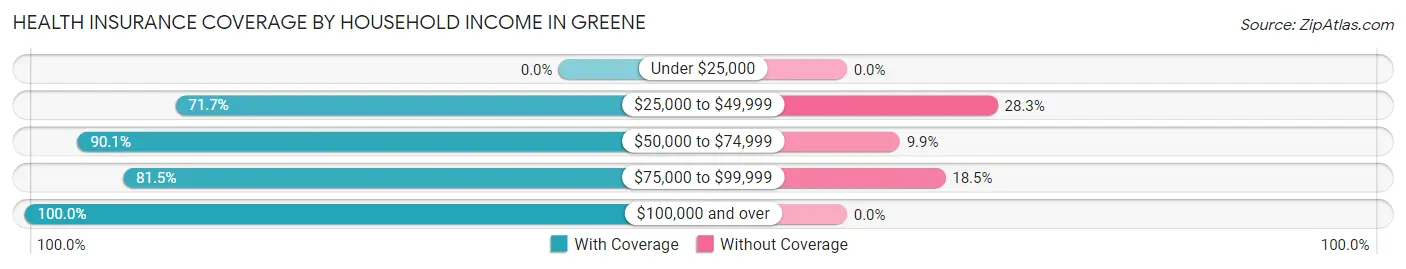
| Household Income | With Coverage | Without Coverage |
| Under $25,000 | 0 (0.0%) | 0 (0.0%) |
| $25,000 to $49,999 | 99 (71.7%) | 39 (28.3%) |
| $50,000 to $74,999 | 100 (90.1%) | 11 (9.9%) |
| $75,000 to $99,999 | 243 (81.5%) | 55 (18.5%) |
| $100,000 and over | 515 (100.0%) | 0 (0.0%) |
Public vs Private Health Insurance Coverage by Age in Greene
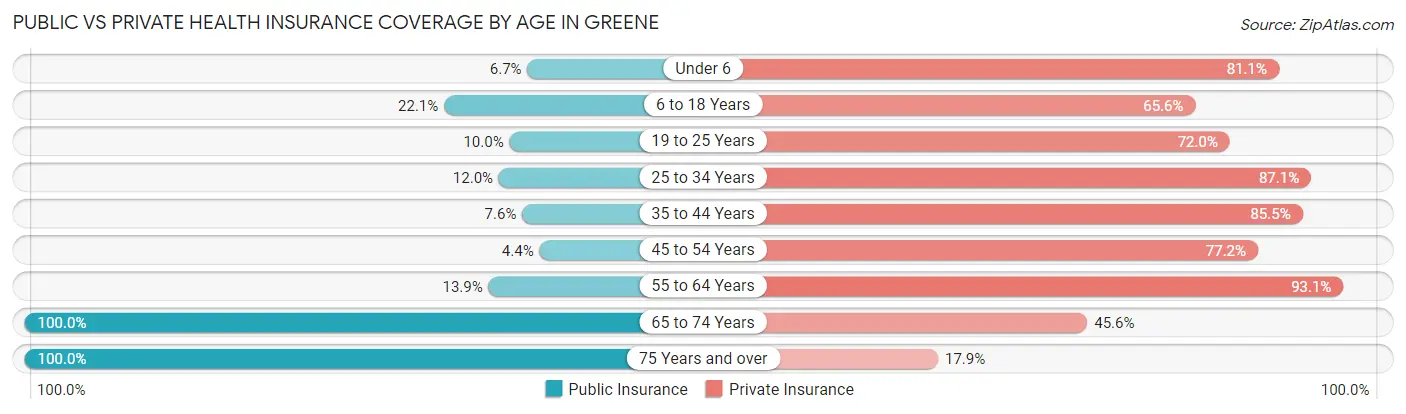
| Age Bracket | Public Insurance | Private Insurance |
| Under 6 | 6 (6.7%) | 73 (81.1%) |
| 6 to 18 Years | 56 (22.1%) | 166 (65.6%) |
| 19 to 25 Years | 5 (10.0%) | 36 (72.0%) |
| 25 to 34 Years | 25 (12.0%) | 182 (87.1%) |
| 35 to 44 Years | 10 (7.6%) | 112 (85.5%) |
| 45 to 54 Years | 7 (4.4%) | 122 (77.2%) |
| 55 to 64 Years | 10 (13.9%) | 67 (93.1%) |
| 65 to 74 Years | 79 (100.0%) | 36 (45.6%) |
| 75 Years and over | 28 (100.0%) | 5 (17.9%) |
| Total | 226 (21.1%) | 799 (74.7%) |
Disability Status by Sex by Age in Greene
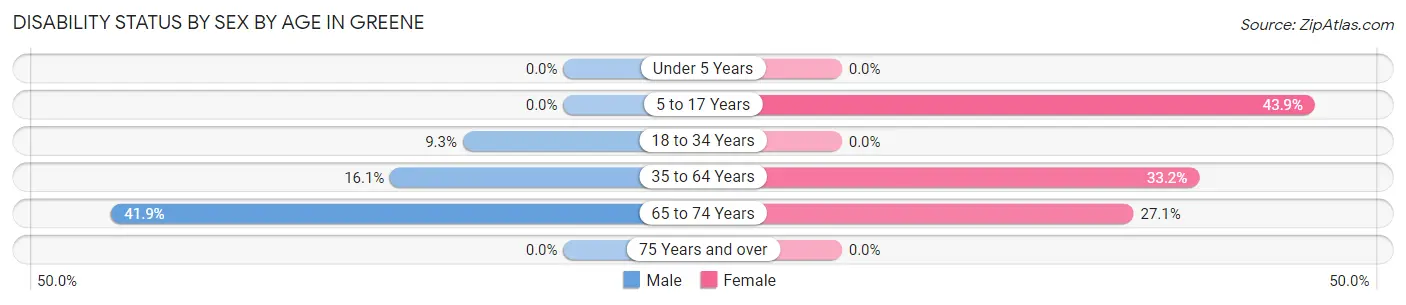
| Age Bracket | Male | Female |
| Under 5 Years | 0 (0.0%) | 0 (0.0%) |
| 5 to 17 Years | 0 (0.0%) | 54 (43.9%) |
| 18 to 34 Years | 14 (9.3%) | 0 (0.0%) |
| 35 to 64 Years | 27 (16.1%) | 64 (33.2%) |
| 65 to 74 Years | 13 (41.9%) | 13 (27.1%) |
| 75 Years and over | 0 (0.0%) | 0 (0.0%) |
Disability Class by Sex by Age in Greene
Disability Class: Hearing Difficulty
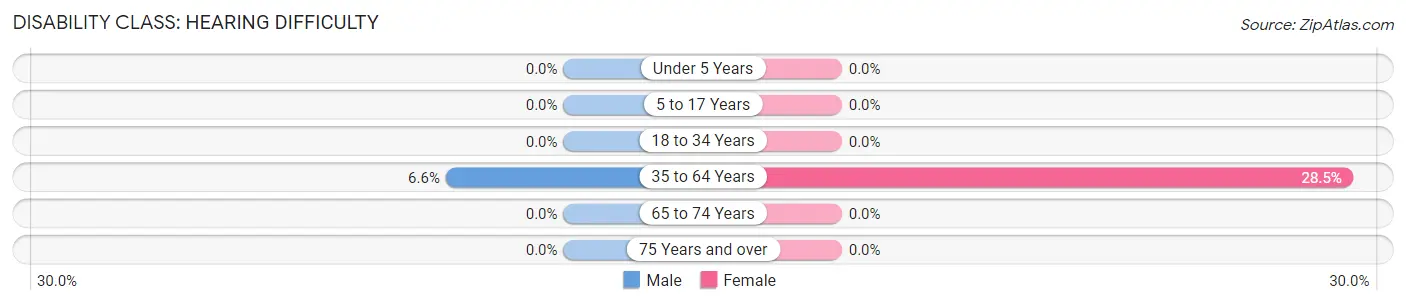
| Age Bracket | Male | Female |
| Under 5 Years | 0 (0.0%) | 0 (0.0%) |
| 5 to 17 Years | 0 (0.0%) | 0 (0.0%) |
| 18 to 34 Years | 0 (0.0%) | 0 (0.0%) |
| 35 to 64 Years | 11 (6.6%) | 55 (28.5%) |
| 65 to 74 Years | 0 (0.0%) | 0 (0.0%) |
| 75 Years and over | 0 (0.0%) | 0 (0.0%) |
Disability Class: Vision Difficulty
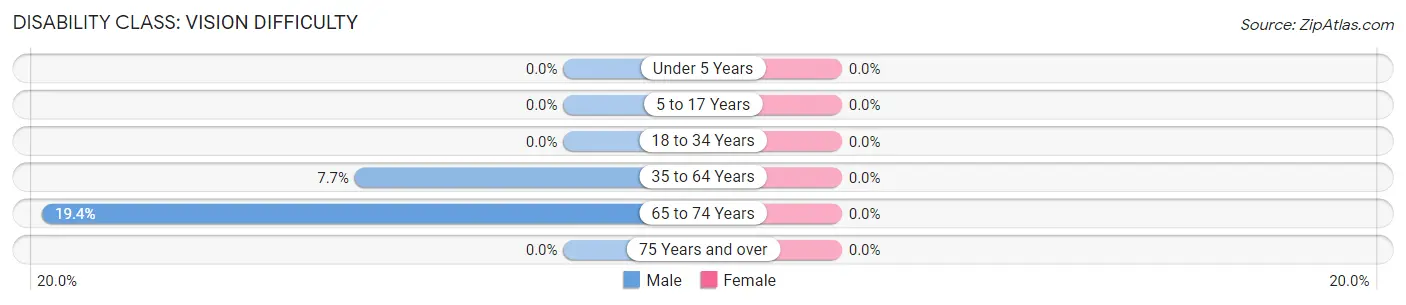
| Age Bracket | Male | Female |
| Under 5 Years | 0 (0.0%) | 0 (0.0%) |
| 5 to 17 Years | 0 (0.0%) | 0 (0.0%) |
| 18 to 34 Years | 0 (0.0%) | 0 (0.0%) |
| 35 to 64 Years | 13 (7.7%) | 0 (0.0%) |
| 65 to 74 Years | 6 (19.4%) | 0 (0.0%) |
| 75 Years and over | 0 (0.0%) | 0 (0.0%) |
Disability Class: Cognitive Difficulty
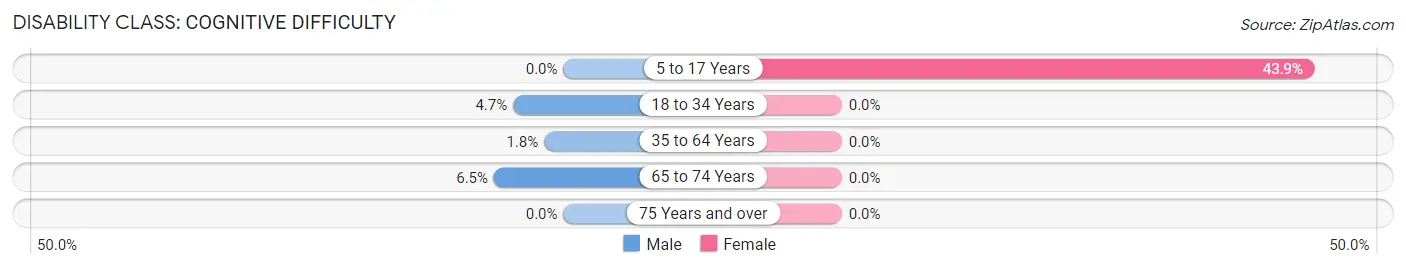
| Age Bracket | Male | Female |
| 5 to 17 Years | 0 (0.0%) | 54 (43.9%) |
| 18 to 34 Years | 7 (4.7%) | 0 (0.0%) |
| 35 to 64 Years | 3 (1.8%) | 0 (0.0%) |
| 65 to 74 Years | 2 (6.5%) | 0 (0.0%) |
| 75 Years and over | 0 (0.0%) | 0 (0.0%) |
Disability Class: Ambulatory Difficulty
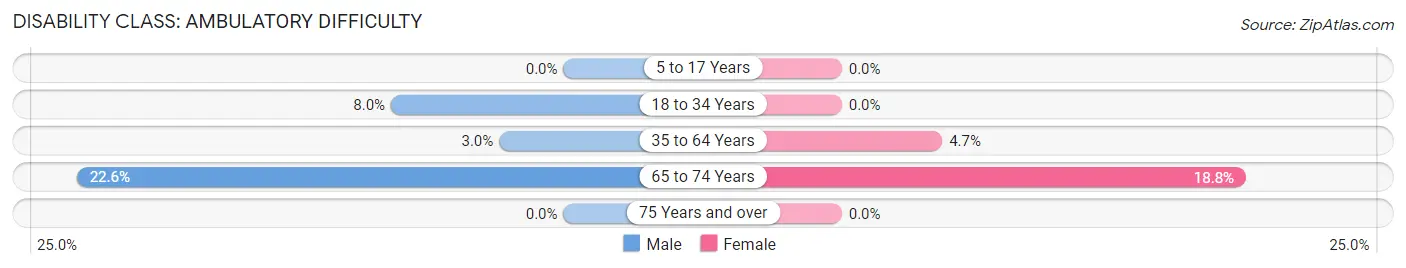
| Age Bracket | Male | Female |
| 5 to 17 Years | 0 (0.0%) | 0 (0.0%) |
| 18 to 34 Years | 12 (8.0%) | 0 (0.0%) |
| 35 to 64 Years | 5 (3.0%) | 9 (4.7%) |
| 65 to 74 Years | 7 (22.6%) | 9 (18.8%) |
| 75 Years and over | 0 (0.0%) | 0 (0.0%) |
Disability Class: Self-Care Difficulty
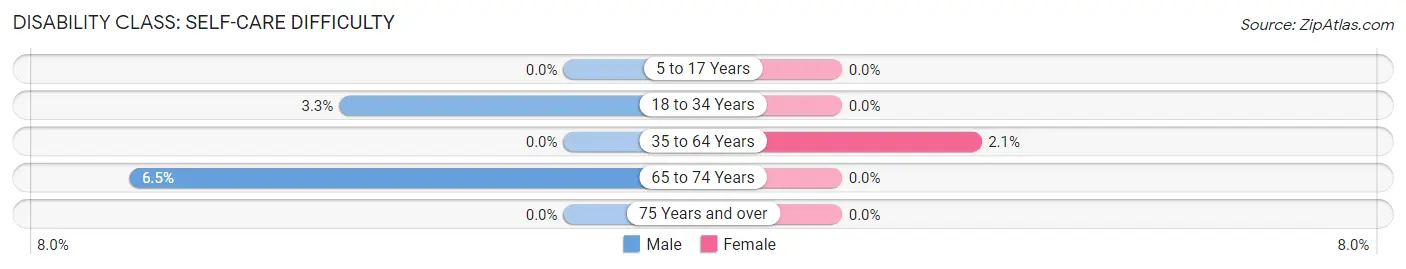
| Age Bracket | Male | Female |
| 5 to 17 Years | 0 (0.0%) | 0 (0.0%) |
| 18 to 34 Years | 5 (3.3%) | 0 (0.0%) |
| 35 to 64 Years | 0 (0.0%) | 4 (2.1%) |
| 65 to 74 Years | 2 (6.5%) | 0 (0.0%) |
| 75 Years and over | 0 (0.0%) | 0 (0.0%) |
Technology Access in Greene
Computing Device Access in Greene
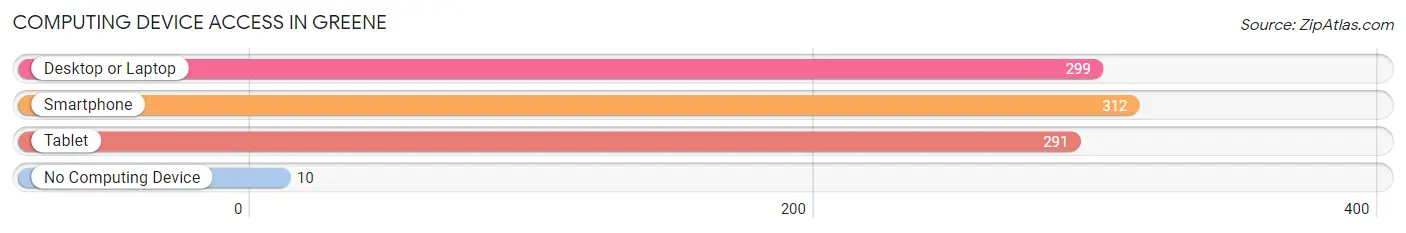
| Device Type | # Households | % Households |
| Desktop or Laptop | 299 | 90.6% |
| Smartphone | 312 | 94.6% |
| Tablet | 291 | 88.2% |
| No Computing Device | 10 | 3.0% |
| Total | 330 | 100.0% |
Internet Access in Greene
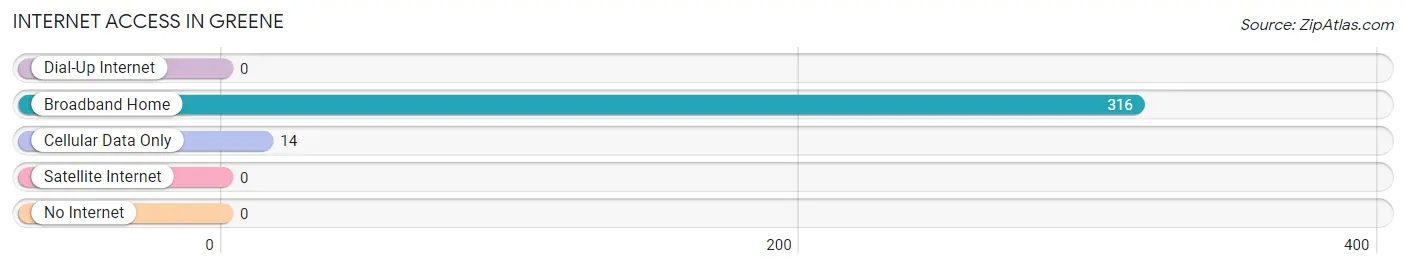
| Internet Type | # Households | % Households |
| Dial-Up Internet | 0 | 0.0% |
| Broadband Home | 316 | 95.8% |
| Cellular Data Only | 14 | 4.2% |
| Satellite Internet | 0 | 0.0% |
| No Internet | 0 | 0.0% |
| Total | 330 | 100.0% |
Greene Summary
Greene, Rhode Island is a small town located in the southwestern part of the state. It is part of the Providence metropolitan area and is bordered by the towns of Coventry, West Greenwich, and North Kingstown. The town has a population of approximately 5,000 people and covers an area of about 11 square miles.
Geography
Greene is located in the southwestern part of Rhode Island, about 10 miles south of Providence. It is bordered by the towns of Coventry, West Greenwich, and North Kingstown. The town is situated on the banks of the Pawcatuck River, which forms the border between Rhode Island and Connecticut. The town is mostly rural, with a few small villages and hamlets scattered throughout. The terrain is mostly flat, with some rolling hills in the northern part of town.
Economy
Greene’s economy is largely based on agriculture and tourism. The town is home to several farms, which produce a variety of crops, including corn, hay, and vegetables. The town also has several small businesses, including a few restaurants, a grocery store, and a few retail stores. Tourism is also an important part of the local economy, with many visitors coming to the area to enjoy the natural beauty of the area.
Demographics
As of the 2010 census, Greene had a population of 5,072 people. The racial makeup of the town was 94.3% White, 1.3% African American, 0.3% Native American, 1.2% Asian, 0.1% Pacific Islander, 1.2% from other races, and 1.7% from two or more races. Hispanic or Latino of any race were 3.2% of the population.
The median income for a household in Greene was $50,938, and the median income for a family was $60,938. The per capita income for the town was $25,938. About 5.3% of families and 7.2% of the population were below the poverty line, including 8.3% of those under age 18 and 5.2% of those age 65 or over.
Conclusion
Greene, Rhode Island is a small town located in the southwestern part of the state. It is part of the Providence metropolitan area and is bordered by the towns of Coventry, West Greenwich, and North Kingstown. The town has a population of approximately 5,000 people and covers an area of about 11 square miles. The economy of Greene is largely based on agriculture and tourism, and the town has a diverse population with a median income of $50,938. Greene is a great place to live, work, and visit, and offers a unique blend of rural and urban life.
Common Questions
What is Per Capita Income in Greene?
Per Capita income in Greene is $35,774.
What is the Median Family Income in Greene?
Median Family Income in Greene is $97,167.
What is the Median Household income in Greene?
Median Household Income in Greene is $96,176.
What is Income or Wage Gap in Greene?
Income or Wage Gap in Greene is 45.0%.
Women in Greene earn 55.0 cents for every dollar earned by a man.
What is Inequality or Gini Index in Greene?
Inequality or Gini Index in Greene is 0.31.
What is the Total Population of Greene?
Total Population of Greene is 1,070.
What is the Total Male Population of Greene?
Total Male Population of Greene is 531.
What is the Total Female Population of Greene?
Total Female Population of Greene is 539.
What is the Ratio of Males per 100 Females in Greene?
There are 98.52 Males per 100 Females in Greene.
What is the Ratio of Females per 100 Males in Greene?
There are 101.51 Females per 100 Males in Greene.
What is the Median Population Age in Greene?
Median Population Age in Greene is 34.2 Years.
What is the Average Family Size in Greene
Average Family Size in Greene is 3.6 People.
What is the Average Household Size in Greene
Average Household Size in Greene is 3.2 People.
How Large is the Labor Force in Greene?
There are 469 People in the Labor Forcein in Greene.
What is the Percentage of People in the Labor Force in Greene?
54.5% of People are in the Labor Force in Greene.
What is the Unemployment Rate in Greene?
Unemployment Rate in Greene is 2.8%.