West Indian 1 or more Vehicles in Household

COMPARE

West Indian
Race
Ancestry
AfghanAfricanAlaska NativeAlaskan AthabascanAlbanianAleutAlsatianAmericanApacheArabArapahoArgentineanArmenianAssyrian/Chaldean/SyriacAustralianAustrianBahamianBangladeshiBarbadianBasqueBelgianBelizeanBermudanBhutaneseBlackfeetBolivianBrazilianBritishBritish West IndianBulgarianBurmeseCajunCambodianCanadianCape VerdeanCarpatho RusynCelticCentral AmericanCentral American IndianCherokeeCheyenneChickasawChileanChineseChippewaChoctawColombianColvilleComancheCosta RicanCreeCreekCroatianCrowCubanCypriotCzechCzechoslovakianDanishDelawareDominicanDutchDutch West IndianEastern EuropeanEcuadorianEgyptianEnglishEstonianEthiopianEuropeanFijianFilipinoFinnishFrenchFrench American IndianFrench CanadianGermanGerman RussianGhanaianGreekGuamanian/ChamorroGuatemalanGuyaneseHaitianHmongHonduranHopiHoumaHungarianIcelanderIndian (Asian)IndonesianInupiatIranianIraqiIrishIroquoisIsraeliItalianJamaicanJapaneseJordanianKenyanKiowaKoreanLaotianLatvianLebaneseLiberianLithuanianLumbeeLuxembourgerMacedonianMalaysianMalteseMarshalleseMenomineeMexicanMexican American IndianMongolianMoroccanNative HawaiianNavajoNepaleseNew ZealanderNicaraguanNigerianNorthern EuropeanNorwegianOkinawanOsageOttawaPaiutePakistaniPalestinianPanamanianParaguayanPennsylvania GermanPeruvianPimaPolishPortuguesePotawatomiPuebloPuerto RicanPuget Sound SalishRomanianRussianSalvadoranSamoanScandinavianScotch-IrishScottishSeminoleSenegaleseSerbianShoshoneSierra LeoneanSiouxSlavicSlovakSloveneSomaliSouth AfricanSouth AmericanSouth American IndianSoviet UnionSpaniardSpanishSpanish AmericanSpanish American IndianSri LankanSubsaharan AfricanSudaneseSwedishSwissSyrianTaiwaneseThaiTlingit-HaidaTohono O'OdhamTonganTrinidadian and TobagonianTsimshianTurkishU.S. Virgin IslanderUgandanUkrainianUruguayanUteVenezuelanVietnameseWelshWest IndianYakamaYaquiYugoslavianYumanYup'ikZimbabwean
Immigration
NonimmigrantsImmigrantsAfghanistanAfricaAlbaniaArgentinaArmeniaAsiaAustraliaAustriaBahamasBangladeshBarbadosBelarusBelgiumBelizeBoliviaBosnia and HerzegovinaBrazilBulgariaBurma/MyanmarCabo VerdeCambodiaCameroonCanadaCaribbeanCentral AmericaChileChinaColombiaCongoCosta RicaCroatiaCubaCzechoslovakiaDenmarkDominicaDominican RepublicEastern AfricaEastern AsiaEastern EuropeEcuadorEgyptEl SalvadorEnglandEritreaEthiopiaEuropeFijiFranceGermanyGhanaGreeceGrenadaGuatemalaGuyanaHaitiHondurasHong KongHungaryIndiaIndonesiaIranIraqIrelandIsraelItalyJamaicaJapanJordanKazakhstanKenyaKoreaKuwaitLaosLatin AmericaLatviaLebanonLiberiaLithuaniaMalaysiaMexicoMicronesiaMiddle AfricaMoldovaMoroccoNepalNetherlandsNicaraguaNigeriaNorth AmericaNorth MacedoniaNorthern AfricaNorthern EuropeNorwayOceaniaPakistanPanamaPeruPhilippinesPolandPortugalRomaniaRussiaSaudi ArabiaScotlandSenegalSerbiaSierra LeoneSingaporeSomaliaSouth AfricaSouth AmericaSouth Central AsiaSouth Eastern AsiaSouthern EuropeSpainSri LankaSt. Vincent and the GrenadinesSudanSwedenSwitzerlandSyriaTaiwanThailandTrinidad and TobagoTurkeyUgandaUkraineUruguayUzbekistanVenezuelaVietnamWest IndiesWestern AfricaWestern AsiaWestern EuropeYemenZaireZimbabweAzores
Select to Compare
Race
Ancestry
AfghanAfricanAlaska NativeAlaskan AthabascanAlbanianAleutAlsatianAmericanApacheArabArapahoArgentineanArmenianAssyrian/Chaldean/SyriacAustralianAustrianBahamianBangladeshiBarbadianBasqueBelgianBelizeanBermudanBhutaneseBlackfeetBolivianBrazilianBritishBritish West IndianBulgarianBurmeseCajunCambodianCanadianCape VerdeanCarpatho RusynCelticCentral AmericanCentral American IndianCherokeeCheyenneChickasawChileanChineseChippewaChoctawColombianColvilleComancheCosta RicanCreeCreekCroatianCrowCubanCypriotCzechCzechoslovakianDanishDelawareDominicanDutchDutch West IndianEastern EuropeanEcuadorianEgyptianEnglishEstonianEthiopianEuropeanFijianFilipinoFinnishFrenchFrench American IndianFrench CanadianGermanGerman RussianGhanaianGreekGuamanian/ChamorroGuatemalanGuyaneseHaitianHmongHonduranHopiHoumaHungarianIcelanderIndian (Asian)IndonesianInupiatIranianIraqiIrishIroquoisIsraeliItalianJamaicanJapaneseJordanianKenyanKiowaKoreanLaotianLatvianLebaneseLiberianLithuanianLumbeeLuxembourgerMacedonianMalaysianMalteseMarshalleseMenomineeMexicanMexican American IndianMongolianMoroccanNative HawaiianNavajoNepaleseNew ZealanderNicaraguanNigerianNorthern EuropeanNorwegianOkinawanOsageOttawaPaiutePakistaniPalestinianPanamanianParaguayanPennsylvania GermanPeruvianPimaPolishPortuguesePotawatomiPuebloPuerto RicanPuget Sound SalishRomanianRussianSalvadoranSamoanScandinavianScotch-IrishScottishSeminoleSenegaleseSerbianShoshoneSierra LeoneanSiouxSlavicSlovakSloveneSomaliSouth AfricanSouth AmericanSouth American IndianSoviet UnionSpaniardSpanishSpanish AmericanSpanish American IndianSri LankanSubsaharan AfricanSudaneseSwedishSwissSyrianTaiwaneseThaiTlingit-HaidaTohono O'OdhamTonganTrinidadian and TobagonianTsimshianTurkishU.S. Virgin IslanderUgandanUkrainianUruguayanUteVenezuelanVietnameseWelshYakamaYaquiYugoslavianYumanYup'ikZimbabwean
Immigration
NonimmigrantsImmigrantsAfghanistanAfricaAlbaniaArgentinaArmeniaAsiaAustraliaAustriaBahamasBangladeshBarbadosBelarusBelgiumBelizeBoliviaBosnia and HerzegovinaBrazilBulgariaBurma/MyanmarCabo VerdeCambodiaCameroonCanadaCaribbeanCentral AmericaChileChinaColombiaCongoCosta RicaCroatiaCubaCzechoslovakiaDenmarkDominicaDominican RepublicEastern AfricaEastern AsiaEastern EuropeEcuadorEgyptEl SalvadorEnglandEritreaEthiopiaEuropeFijiFranceGermanyGhanaGreeceGrenadaGuatemalaGuyanaHaitiHondurasHong KongHungaryIndiaIndonesiaIranIraqIrelandIsraelItalyJamaicaJapanJordanKazakhstanKenyaKoreaKuwaitLaosLatin AmericaLatviaLebanonLiberiaLithuaniaMalaysiaMexicoMicronesiaMiddle AfricaMoldovaMoroccoNepalNetherlandsNicaraguaNigeriaNorth AmericaNorth MacedoniaNorthern AfricaNorthern EuropeNorwayOceaniaPakistanPanamaPeruPhilippinesPolandPortugalRomaniaRussiaSaudi ArabiaScotlandSenegalSerbiaSierra LeoneSingaporeSomaliaSouth AfricaSouth AmericaSouth Central AsiaSouth Eastern AsiaSouthern EuropeSpainSri LankaSt. Vincent and the GrenadinesSudanSwedenSwitzerlandSyriaTaiwanThailandTrinidad and TobagoTurkeyUgandaUkraineUruguayUzbekistanVenezuelaVietnamWest IndiesWestern AfricaWestern AsiaWestern EuropeYemenZaireZimbabweAzores
1 or more Vehicles in Household
Income
Poverty
Unemployment
Labor Participation
Family Structure
Vehicle Availability
Education Level
Disability

West Indian 1 or more Vehicles in Household
Tragic

76.4%
1+ VEHICLES AVAILABLE
0.0/ 100
METRIC RATING
331st/ 347
METRIC RANK

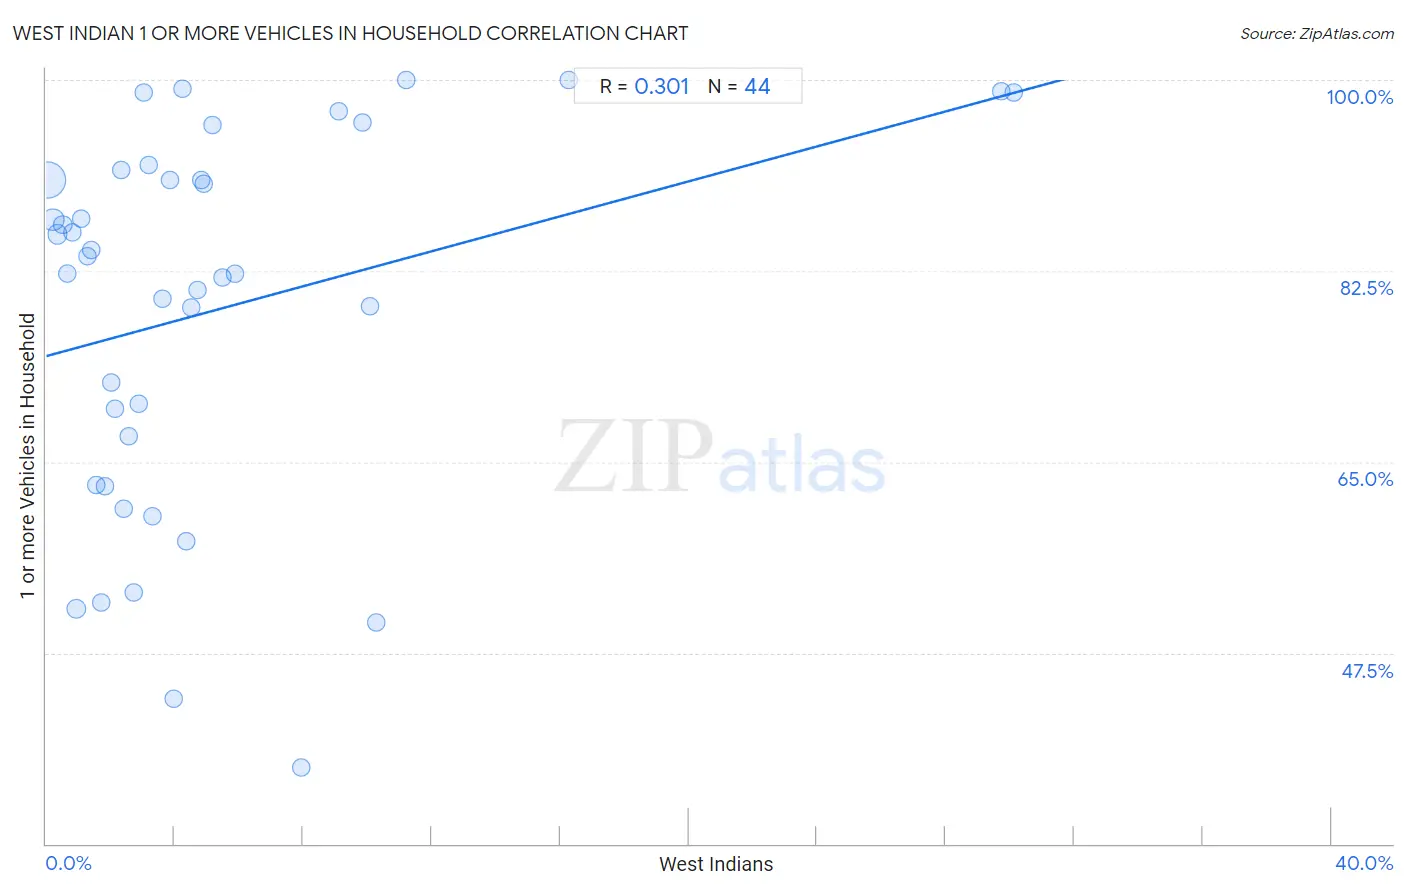
West Indian 1 or more Vehicles in Household Correlation Chart

The statistical analysis conducted on geographies consisting of 253,892,207 people shows a mild positive correlation between the proportion of West Indians and percentage of households with 1 or more vehicles available in the United States with a correlation coefficient (R) of 0.301 and weighted average of 76.4%. On average, for every 1% (one percent) increase in West Indians within a typical geography, there is an increase of 0.80% in percentage of households with 1 or more vehicles available.
West Indian 1 or more Vehicles in Household
It is essential to understand that the correlation between the percentage of West Indians and percentage of households with 1 or more vehicles available does not imply a direct cause-and-effect relationship. It remains uncertain whether the presence of West Indians influences an upward or downward trend in the level of percentage of households with 1 or more vehicles available within an area, or if West Indians simply ended up residing in those areas with higher or lower levels of percentage of households with 1 or more vehicles available due to other factors.

Demographics Similar to West Indians by 1 or more Vehicles in Household

In terms of 1 or more vehicles in household, the demographic groups most similar to West Indians are Trinidadian and Tobagonian (76.3%, a difference of 0.080%), Immigrants from Ecuador (76.2%, a difference of 0.18%), Immigrants from Trinidad and Tobago (76.8%, a difference of 0.55%), Immigrants from Dominica (77.8%, a difference of 1.9%), and Ecuadorian (77.9%, a difference of 2.1%).
DemographicsRating | Rank1 or more Vehicles in Household
Immigrants from Caribbean
0.0
/100
|
#324
Tragic
80.4%
Senegalese
0.0
/100
|
#325
Tragic
80.4%
Immigrants from West Indies
0.0
/100
|
#326
Tragic
79.5%
Immigrants from Senegal
0.0
/100
|
#327
Tragic
79.0%
Ecuadorians
0.0
/100
|
#328
Tragic
77.9%
Immigrants from Dominica
0.0
/100
|
#329
Tragic
77.8%
Immigrants from Trinidad and Tobago
0.0
/100
|
#330
Tragic
76.8%
West Indians
0.0
/100
|
#331
Tragic
76.4%
Trinidadians and Tobagonians
0.0
/100
|
#332
Tragic
76.3%
Immigrants from Ecuador
0.0
/100
|
#333
Tragic
76.2%
Immigrants from Bangladesh
0.0
/100
|
#334
Tragic
74.3%
Barbadians
0.0
/100
|
#335
Tragic
74.0%
Vietnamese
0.0
/100
|
#336
Tragic
73.8%
Immigrants from Uzbekistan
0.0
/100
|
#337
Tragic
73.4%
Inupiat
0.0
/100
|
#338
Tragic
71.5%

West Indian 1 or more Vehicles in Household Correlation Summary

MeasurementWest Indian Data1 or more Vehicles in Household Data
Minimum0.054%37.0%
Maximum30.1%100.0%
Range30.1%63.0%
Mean5.2%78.9%
Median3.3%83.1%
Interquartile 25% (IQ1)1.6%65.1%
Interquartile 75% (IQ3)5.3%91.3%
Interquartile Range (IQR)3.7%26.2%
Standard Deviation (Sample)6.4%17.2%
Standard Deviation (Population)6.4%17.0%

Correlation Details

West Indian PercentileSample Size1 or more Vehicles in Household
[
0.0%
-
0.5%
]
0.054%
173,574,73590.9%
[
0.0%
-
0.5%
]
0.21%
39,754,84487.2%
[
0.0%
-
0.5%
]
0.35%
13,164,55685.9%
[
0.5%
-
1.0%
]
0.51%
6,145,02586.7%
[
0.5%
-
1.0%
]
0.66%
4,080,91782.2%
[
0.5%
-
1.0%
]
0.82%
2,015,75786.0%
[
0.5%
-
1.0%
]
0.95%
10,357,03551.5%
[
1.0%
-
1.5%
]
1.09%
1,094,10587.2%
[
1.0%
-
1.5%
]
1.28%
569,92583.9%
[
1.0%
-
1.5%
]
1.41%
306,16584.4%
[
1.5%
-
2.0%
]
1.56%
435,01062.8%
[
1.5%
-
2.0%
]
1.71%
334,89252.1%
[
1.5%
-
2.0%
]
1.85%
181,37162.8%
[
2.0%
-
2.5%
]
2.03%
136,52872.3%
[
2.0%
-
2.5%
]
2.15%
201,31269.9%
[
2.0%
-
2.5%
]
2.32%
142,29491.8%
[
2.0%
-
2.5%
]
2.42%
208,85560.7%
[
2.5%
-
3.0%
]
2.59%
150,46367.3%
[
2.5%
-
3.0%
]
2.73%
286,76053.0%
[
2.5%
-
3.0%
]
2.88%
48,10770.3%
[
3.0%
-
3.5%
]
3.05%
5,34498.9%
[
3.0%
-
3.5%
]
3.19%
14,76392.2%
[
3.0%
-
3.5%
]
3.32%
190,47460.1%
[
3.5%
-
4.0%
]
3.61%
75,72580.0%
[
3.5%
-
4.0%
]
3.85%
4,64890.8%
[
3.5%
-
4.0%
]
3.98%
69,37543.3%
[
4.0%
-
4.5%
]
4.23%
1,15899.2%
[
4.0%
-
4.5%
]
4.36%
8,16457.8%
[
4.5%
-
5.0%
]
4.52%
22,12279.1%
[
4.5%
-
5.0%
]
4.71%
91280.8%
[
4.5%
-
5.0%
]
4.81%
3,18190.8%
[
4.5%
-
5.0%
]
4.91%
3,11490.5%
[
5.0%
-
5.5%
]
5.17%
6,85195.9%
[
5.0%
-
5.5%
]
5.50%
32,29681.9%
[
5.5%
-
6.0%
]
5.88%
85,42582.3%
[
7.5%
-
8.0%
]
7.93%
83,12537.0%
[
9.0%
-
9.5%
]
9.09%
28697.2%
[
9.5%
-
10.0%
]
9.85%
3,11796.1%
[
10.0%
-
10.5%
]
10.06%
10,52679.3%
[
10.0%
-
10.5%
]
10.27%
78,50650.3%
[
11.0%
-
11.5%
]
11.21%
571100.0%
[
16.0%
-
16.5%
]
16.26%
326100.0%
[
29.5%
-
30.0%
]
29.74%
1,78299.0%
[
30.0%
-
30.5%
]
30.11%
1,76098.9%