West Indian 4 or more Vehicles in Household

COMPARE

West Indian
Race
Ancestry
AfghanAfricanAlaska NativeAlaskan AthabascanAlbanianAleutAlsatianAmericanApacheArabArapahoArgentineanArmenianAssyrian/Chaldean/SyriacAustralianAustrianBahamianBangladeshiBarbadianBasqueBelgianBelizeanBermudanBhutaneseBlackfeetBolivianBrazilianBritishBritish West IndianBulgarianBurmeseCajunCambodianCanadianCape VerdeanCarpatho RusynCelticCentral AmericanCentral American IndianCherokeeCheyenneChickasawChileanChineseChippewaChoctawColombianColvilleComancheCosta RicanCreeCreekCroatianCrowCubanCypriotCzechCzechoslovakianDanishDelawareDominicanDutchDutch West IndianEastern EuropeanEcuadorianEgyptianEnglishEstonianEthiopianEuropeanFijianFilipinoFinnishFrenchFrench American IndianFrench CanadianGermanGerman RussianGhanaianGreekGuamanian/ChamorroGuatemalanGuyaneseHaitianHmongHonduranHopiHoumaHungarianIcelanderIndian (Asian)IndonesianInupiatIranianIraqiIrishIroquoisIsraeliItalianJamaicanJapaneseJordanianKenyanKiowaKoreanLaotianLatvianLebaneseLiberianLithuanianLumbeeLuxembourgerMacedonianMalaysianMalteseMarshalleseMenomineeMexicanMexican American IndianMongolianMoroccanNative HawaiianNavajoNepaleseNew ZealanderNicaraguanNigerianNorthern EuropeanNorwegianOkinawanOsageOttawaPaiutePakistaniPalestinianPanamanianParaguayanPennsylvania GermanPeruvianPimaPolishPortuguesePotawatomiPuebloPuerto RicanPuget Sound SalishRomanianRussianSalvadoranSamoanScandinavianScotch-IrishScottishSeminoleSenegaleseSerbianShoshoneSierra LeoneanSiouxSlavicSlovakSloveneSomaliSouth AfricanSouth AmericanSouth American IndianSoviet UnionSpaniardSpanishSpanish AmericanSpanish American IndianSri LankanSubsaharan AfricanSudaneseSwedishSwissSyrianTaiwaneseThaiTlingit-HaidaTohono O'OdhamTonganTrinidadian and TobagonianTsimshianTurkishU.S. Virgin IslanderUgandanUkrainianUruguayanUteVenezuelanVietnameseWelshWest IndianYakamaYaquiYugoslavianYumanYup'ikZimbabwean
Immigration
NonimmigrantsImmigrantsAfghanistanAfricaAlbaniaArgentinaArmeniaAsiaAustraliaAustriaBahamasBangladeshBarbadosBelarusBelgiumBelizeBoliviaBosnia and HerzegovinaBrazilBulgariaBurma/MyanmarCabo VerdeCambodiaCameroonCanadaCaribbeanCentral AmericaChileChinaColombiaCongoCosta RicaCroatiaCubaCzechoslovakiaDenmarkDominicaDominican RepublicEastern AfricaEastern AsiaEastern EuropeEcuadorEgyptEl SalvadorEnglandEritreaEthiopiaEuropeFijiFranceGermanyGhanaGreeceGrenadaGuatemalaGuyanaHaitiHondurasHong KongHungaryIndiaIndonesiaIranIraqIrelandIsraelItalyJamaicaJapanJordanKazakhstanKenyaKoreaKuwaitLaosLatin AmericaLatviaLebanonLiberiaLithuaniaMalaysiaMexicoMicronesiaMiddle AfricaMoldovaMoroccoNepalNetherlandsNicaraguaNigeriaNorth AmericaNorth MacedoniaNorthern AfricaNorthern EuropeNorwayOceaniaPakistanPanamaPeruPhilippinesPolandPortugalRomaniaRussiaSaudi ArabiaScotlandSenegalSerbiaSierra LeoneSingaporeSomaliaSouth AfricaSouth AmericaSouth Central AsiaSouth Eastern AsiaSouthern EuropeSpainSri LankaSt. Vincent and the GrenadinesSudanSwedenSwitzerlandSyriaTaiwanThailandTrinidad and TobagoTurkeyUgandaUkraineUruguayUzbekistanVenezuelaVietnamWest IndiesWestern AfricaWestern AsiaWestern EuropeYemenZaireZimbabweAzores
Select to Compare
Race
Ancestry
AfghanAfricanAlaska NativeAlaskan AthabascanAlbanianAleutAlsatianAmericanApacheArabArapahoArgentineanArmenianAssyrian/Chaldean/SyriacAustralianAustrianBahamianBangladeshiBarbadianBasqueBelgianBelizeanBermudanBhutaneseBlackfeetBolivianBrazilianBritishBritish West IndianBulgarianBurmeseCajunCambodianCanadianCape VerdeanCarpatho RusynCelticCentral AmericanCentral American IndianCherokeeCheyenneChickasawChileanChineseChippewaChoctawColombianColvilleComancheCosta RicanCreeCreekCroatianCrowCubanCypriotCzechCzechoslovakianDanishDelawareDominicanDutchDutch West IndianEastern EuropeanEcuadorianEgyptianEnglishEstonianEthiopianEuropeanFijianFilipinoFinnishFrenchFrench American IndianFrench CanadianGermanGerman RussianGhanaianGreekGuamanian/ChamorroGuatemalanGuyaneseHaitianHmongHonduranHopiHoumaHungarianIcelanderIndian (Asian)IndonesianInupiatIranianIraqiIrishIroquoisIsraeliItalianJamaicanJapaneseJordanianKenyanKiowaKoreanLaotianLatvianLebaneseLiberianLithuanianLumbeeLuxembourgerMacedonianMalaysianMalteseMarshalleseMenomineeMexicanMexican American IndianMongolianMoroccanNative HawaiianNavajoNepaleseNew ZealanderNicaraguanNigerianNorthern EuropeanNorwegianOkinawanOsageOttawaPaiutePakistaniPalestinianPanamanianParaguayanPennsylvania GermanPeruvianPimaPolishPortuguesePotawatomiPuebloPuerto RicanPuget Sound SalishRomanianRussianSalvadoranSamoanScandinavianScotch-IrishScottishSeminoleSenegaleseSerbianShoshoneSierra LeoneanSiouxSlavicSlovakSloveneSomaliSouth AfricanSouth AmericanSouth American IndianSoviet UnionSpaniardSpanishSpanish AmericanSpanish American IndianSri LankanSubsaharan AfricanSudaneseSwedishSwissSyrianTaiwaneseThaiTlingit-HaidaTohono O'OdhamTonganTrinidadian and TobagonianTsimshianTurkishU.S. Virgin IslanderUgandanUkrainianUruguayanUteVenezuelanVietnameseWelshYakamaYaquiYugoslavianYumanYup'ikZimbabwean
Immigration
NonimmigrantsImmigrantsAfghanistanAfricaAlbaniaArgentinaArmeniaAsiaAustraliaAustriaBahamasBangladeshBarbadosBelarusBelgiumBelizeBoliviaBosnia and HerzegovinaBrazilBulgariaBurma/MyanmarCabo VerdeCambodiaCameroonCanadaCaribbeanCentral AmericaChileChinaColombiaCongoCosta RicaCroatiaCubaCzechoslovakiaDenmarkDominicaDominican RepublicEastern AfricaEastern AsiaEastern EuropeEcuadorEgyptEl SalvadorEnglandEritreaEthiopiaEuropeFijiFranceGermanyGhanaGreeceGrenadaGuatemalaGuyanaHaitiHondurasHong KongHungaryIndiaIndonesiaIranIraqIrelandIsraelItalyJamaicaJapanJordanKazakhstanKenyaKoreaKuwaitLaosLatin AmericaLatviaLebanonLiberiaLithuaniaMalaysiaMexicoMicronesiaMiddle AfricaMoldovaMoroccoNepalNetherlandsNicaraguaNigeriaNorth AmericaNorth MacedoniaNorthern AfricaNorthern EuropeNorwayOceaniaPakistanPanamaPeruPhilippinesPolandPortugalRomaniaRussiaSaudi ArabiaScotlandSenegalSerbiaSierra LeoneSingaporeSomaliaSouth AfricaSouth AmericaSouth Central AsiaSouth Eastern AsiaSouthern EuropeSpainSri LankaSt. Vincent and the GrenadinesSudanSwedenSwitzerlandSyriaTaiwanThailandTrinidad and TobagoTurkeyUgandaUkraineUruguayUzbekistanVenezuelaVietnamWest IndiesWestern AfricaWestern AsiaWestern EuropeYemenZaireZimbabweAzores
4 or more Vehicles in Household
Income
Poverty
Unemployment
Labor Participation
Family Structure
Vehicle Availability
Education Level
Disability

West Indian 4 or more Vehicles in Household
Tragic

4.2%
4+ VEHICLES AVAILABLE
0.0/ 100
METRIC RATING
331st/ 347
METRIC RANK

West Indian 4 or more Vehicles in Household Correlation Chart

The statistical analysis conducted on geographies consisting of 252,612,993 people shows a slight positive correlation between the proportion of West Indians and percentage of households with 4 or more vehicles available in the United States with a correlation coefficient (R) of 0.086 and weighted average of 4.2%. On average, for every 1% (one percent) increase in West Indians within a typical geography, there is an increase of 0.045% in percentage of households with 4 or more vehicles available.
West Indian 4 or more Vehicles in Household
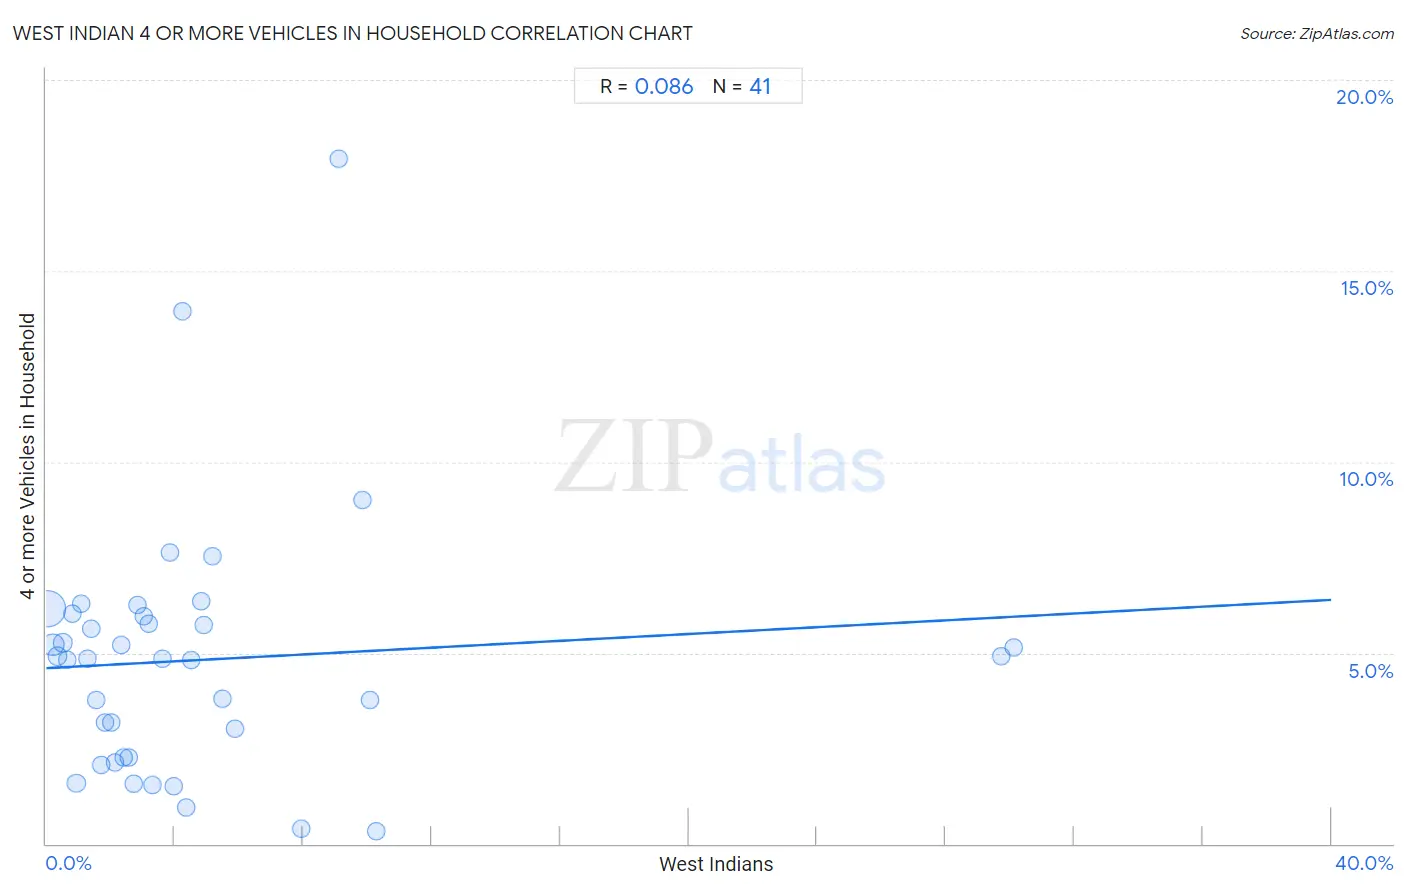
It is essential to understand that the correlation between the percentage of West Indians and percentage of households with 4 or more vehicles available does not imply a direct cause-and-effect relationship. It remains uncertain whether the presence of West Indians influences an upward or downward trend in the level of percentage of households with 4 or more vehicles available within an area, or if West Indians simply ended up residing in those areas with higher or lower levels of percentage of households with 4 or more vehicles available due to other factors.

Demographics Similar to West Indians by 4 or more Vehicles in Household

In terms of 4 or more vehicles in household, the demographic groups most similar to West Indians are Immigrants from Ecuador (4.2%, a difference of 0.26%), Immigrants from Senegal (4.2%, a difference of 0.46%), Trinidadian and Tobagonian (4.3%, a difference of 0.73%), Immigrants from Dominica (4.2%, a difference of 0.90%), and Senegalese (4.3%, a difference of 2.3%).
DemographicsRating | Rank4 or more Vehicles in Household
Soviet Union
0.0
/100
|
#324
Tragic
4.4%
Immigrants from Jamaica
0.0
/100
|
#325
Tragic
4.4%
Cape Verdeans
0.0
/100
|
#326
Tragic
4.4%
Senegalese
0.0
/100
|
#327
Tragic
4.3%
Trinidadians and Tobagonians
0.0
/100
|
#328
Tragic
4.3%
Immigrants from Senegal
0.0
/100
|
#329
Tragic
4.2%
Immigrants from Ecuador
0.0
/100
|
#330
Tragic
4.2%
West Indians
0.0
/100
|
#331
Tragic
4.2%
Immigrants from Dominica
0.0
/100
|
#332
Tragic
4.2%
Immigrants from Albania
0.0
/100
|
#333
Tragic
4.1%
Immigrants from Trinidad and Tobago
0.0
/100
|
#334
Tragic
4.1%
Barbadians
0.0
/100
|
#335
Tragic
3.9%
Immigrants from Bangladesh
0.0
/100
|
#336
Tragic
3.9%
Vietnamese
0.0
/100
|
#337
Tragic
3.9%
Immigrants from Cabo Verde
0.0
/100
|
#338
Tragic
3.8%

West Indian 4 or more Vehicles in Household Correlation Summary

MeasurementWest Indian Data4 or more Vehicles in Household Data
Minimum0.054%0.34%
Maximum30.1%17.9%
Range30.1%17.6%
Mean4.8%4.8%
Median3.1%4.9%
Interquartile 25% (IQ1)1.5%2.3%
Interquartile 75% (IQ3)5.0%6.0%
Interquartile Range (IQR)3.6%3.7%
Standard Deviation (Sample)6.4%3.3%
Standard Deviation (Population)6.3%3.3%

Correlation Details

West Indian PercentileSample Size4 or more Vehicles in Household
[
0.0%
-
0.5%
]
0.054%
173,156,5816.1%
[
0.0%
-
0.5%
]
0.21%
39,509,6575.2%
[
0.0%
-
0.5%
]
0.35%
12,963,9804.9%
[
0.5%
-
1.0%
]
0.51%
5,989,1875.3%
[
0.5%
-
1.0%
]
0.66%
3,943,7604.8%
[
0.5%
-
1.0%
]
0.82%
1,958,0506.0%
[
0.5%
-
1.0%
]
0.95%
10,349,0511.6%
[
1.0%
-
1.5%
]
1.09%
1,079,4856.3%
[
1.0%
-
1.5%
]
1.28%
561,2384.8%
[
1.0%
-
1.5%
]
1.41%
297,3645.6%
[
1.5%
-
2.0%
]
1.56%
433,8733.8%
[
1.5%
-
2.0%
]
1.71%
334,8922.1%
[
1.5%
-
2.0%
]
1.85%
180,2723.2%
[
2.0%
-
2.5%
]
2.03%
135,2383.2%
[
2.0%
-
2.5%
]
2.15%
200,8532.1%
[
2.0%
-
2.5%
]
2.32%
142,0395.2%
[
2.0%
-
2.5%
]
2.42%
208,2132.3%
[
2.5%
-
3.0%
]
2.59%
150,4632.3%
[
2.5%
-
3.0%
]
2.73%
286,7601.6%
[
2.5%
-
3.0%
]
2.85%
31,2996.2%
[
3.0%
-
3.5%
]
3.05%
5,3446.0%
[
3.0%
-
3.5%
]
3.19%
14,5455.8%
[
3.0%
-
3.5%
]
3.32%
190,4741.5%
[
3.5%
-
4.0%
]
3.61%
75,7254.9%
[
3.5%
-
4.0%
]
3.85%
4,6487.6%
[
3.5%
-
4.0%
]
3.98%
68,5891.5%
[
4.0%
-
4.5%
]
4.23%
1,15813.9%
[
4.0%
-
4.5%
]
4.36%
8,1640.94%
[
4.5%
-
5.0%
]
4.52%
22,1224.8%
[
4.5%
-
5.0%
]
4.81%
3,1816.3%
[
4.5%
-
5.0%
]
4.91%
3,1145.7%
[
5.0%
-
5.5%
]
5.17%
6,8517.5%
[
5.0%
-
5.5%
]
5.50%
32,2963.8%
[
5.5%
-
6.0%
]
5.88%
85,4253.0%
[
7.5%
-
8.0%
]
7.93%
83,1250.39%
[
9.0%
-
9.5%
]
9.09%
28617.9%
[
9.5%
-
10.0%
]
9.85%
3,1179.0%
[
10.0%
-
10.5%
]
10.06%
10,5263.7%
[
10.0%
-
10.5%
]
10.27%
78,5060.34%
[
29.5%
-
30.0%
]
29.74%
1,7824.9%
[
30.0%
-
30.5%
]
30.11%
1,7605.1%