West Indian College, Under 1 year
COMPARE
West Indian
Select to Compare
College, Under 1 year
West Indian College, Under 1 year
61.5%
COLLEGE, UNDER 1 YEAR
0.4/ 100
METRIC RATING
252nd/ 347
METRIC RANK
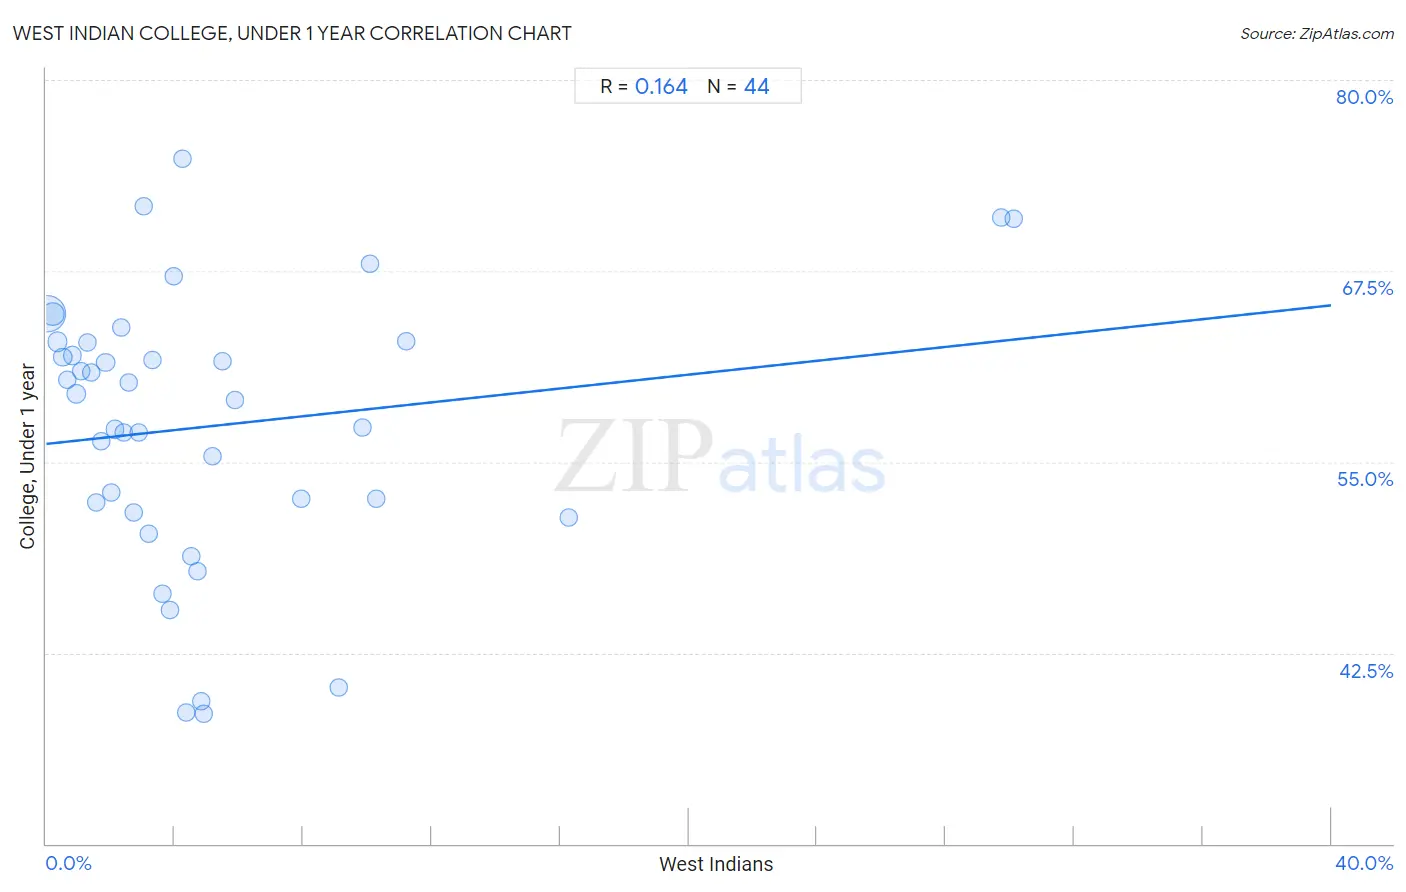
West Indian College, Under 1 year Correlation Chart
The statistical analysis conducted on geographies consisting of 254,063,654 people shows a poor positive correlation between the proportion of West Indians and percentage of population with at least college, under 1 year education in the United States with a correlation coefficient (R) of 0.164 and weighted average of 61.5%. On average, for every 1% (one percent) increase in West Indians within a typical geography, there is an increase of 0.23% in percentage of population with at least college, under 1 year education.
It is essential to understand that the correlation between the percentage of West Indians and percentage of population with at least college, under 1 year education does not imply a direct cause-and-effect relationship. It remains uncertain whether the presence of West Indians influences an upward or downward trend in the level of percentage of population with at least college, under 1 year education within an area, or if West Indians simply ended up residing in those areas with higher or lower levels of percentage of population with at least college, under 1 year education due to other factors.
Demographics Similar to West Indians by College, Under 1 year
In terms of college, under 1 year, the demographic groups most similar to West Indians are Japanese (61.5%, a difference of 0.0%), Immigrants from Cambodia (61.5%, a difference of 0.0%), Immigrants from Micronesia (61.5%, a difference of 0.11%), Comanche (61.4%, a difference of 0.13%), and Bangladeshi (61.4%, a difference of 0.17%).
| Demographics | Rating | Rank | College, Under 1 year |
| Delaware | 0.9 /100 | #245 | Tragic 62.1% |
| Marshallese | 0.8 /100 | #246 | Tragic 61.9% |
| Immigrants from Liberia | 0.8 /100 | #247 | Tragic 61.9% |
| Potawatomi | 0.6 /100 | #248 | Tragic 61.8% |
| Vietnamese | 0.5 /100 | #249 | Tragic 61.7% |
| Immigrants from Congo | 0.5 /100 | #250 | Tragic 61.7% |
| Immigrants from Micronesia | 0.5 /100 | #251 | Tragic 61.5% |
| West Indians | 0.4 /100 | #252 | Tragic 61.5% |
| Japanese | 0.4 /100 | #253 | Tragic 61.5% |
| Immigrants from Cambodia | 0.4 /100 | #254 | Tragic 61.5% |
| Comanche | 0.4 /100 | #255 | Tragic 61.4% |
| Bangladeshis | 0.4 /100 | #256 | Tragic 61.4% |
| Immigrants from Laos | 0.3 /100 | #257 | Tragic 61.3% |
| Immigrants from Bangladesh | 0.3 /100 | #258 | Tragic 61.3% |
| Indonesians | 0.3 /100 | #259 | Tragic 61.2% |
West Indian College, Under 1 year Correlation Summary
| Measurement | West Indian Data | College, Under 1 year Data |
| Minimum | 0.054% | 38.5% |
| Maximum | 30.1% | 74.8% |
| Range | 30.1% | 36.3% |
| Mean | 5.2% | 57.4% |
| Median | 3.3% | 59.2% |
| Interquartile 25% (IQ1) | 1.6% | 52.0% |
| Interquartile 75% (IQ3) | 5.3% | 62.9% |
| Interquartile Range (IQR) | 3.7% | 10.8% |
| Standard Deviation (Sample) | 6.4% | 8.9% |
| Standard Deviation (Population) | 6.4% | 8.8% |
Correlation Details
| West Indian Percentile | Sample Size | College, Under 1 year |
[ 0.0% - 0.5% ] 0.054% | 173,637,912 | 64.7% |
[ 0.0% - 0.5% ] 0.21% | 39,809,179 | 64.7% |
[ 0.0% - 0.5% ] 0.35% | 13,176,722 | 62.9% |
[ 0.5% - 1.0% ] 0.51% | 6,150,799 | 61.8% |
[ 0.5% - 1.0% ] 0.66% | 4,094,748 | 60.4% |
[ 0.5% - 1.0% ] 0.82% | 2,018,534 | 62.0% |
[ 0.5% - 1.0% ] 0.95% | 10,358,686 | 59.4% |
[ 1.0% - 1.5% ] 1.09% | 1,094,105 | 60.9% |
[ 1.0% - 1.5% ] 1.28% | 571,758 | 62.8% |
[ 1.0% - 1.5% ] 1.41% | 307,467 | 60.9% |
[ 1.5% - 2.0% ] 1.56% | 439,174 | 52.3% |
[ 1.5% - 2.0% ] 1.71% | 336,886 | 56.3% |
[ 1.5% - 2.0% ] 1.85% | 188,413 | 61.5% |
[ 2.0% - 2.5% ] 2.02% | 137,340 | 53.0% |
[ 2.0% - 2.5% ] 2.15% | 201,312 | 57.1% |
[ 2.0% - 2.5% ] 2.32% | 142,294 | 63.8% |
[ 2.0% - 2.5% ] 2.42% | 208,855 | 56.9% |
[ 2.5% - 3.0% ] 2.59% | 150,463 | 60.2% |
[ 2.5% - 3.0% ] 2.73% | 287,567 | 51.7% |
[ 2.5% - 3.0% ] 2.88% | 48,107 | 56.9% |
[ 3.0% - 3.5% ] 3.05% | 5,344 | 71.8% |
[ 3.0% - 3.5% ] 3.19% | 14,545 | 50.3% |
[ 3.0% - 3.5% ] 3.32% | 190,474 | 61.6% |
[ 3.5% - 4.0% ] 3.61% | 75,725 | 46.4% |
[ 3.5% - 4.0% ] 3.85% | 4,648 | 45.3% |
[ 3.5% - 4.0% ] 3.98% | 69,375 | 67.1% |
[ 4.0% - 4.5% ] 4.23% | 1,158 | 74.8% |
[ 4.0% - 4.5% ] 4.36% | 8,164 | 38.6% |
[ 4.5% - 5.0% ] 4.52% | 22,122 | 48.8% |
[ 4.5% - 5.0% ] 4.71% | 912 | 47.9% |
[ 4.5% - 5.0% ] 4.81% | 3,181 | 39.4% |
[ 4.5% - 5.0% ] 4.91% | 3,114 | 38.5% |
[ 5.0% - 5.5% ] 5.17% | 6,851 | 55.4% |
[ 5.0% - 5.5% ] 5.50% | 32,296 | 61.6% |
[ 5.5% - 6.0% ] 5.88% | 85,425 | 59.0% |
[ 7.5% - 8.0% ] 7.93% | 83,125 | 52.6% |
[ 9.0% - 9.5% ] 9.09% | 286 | 40.2% |
[ 9.5% - 10.0% ] 9.85% | 3,117 | 57.2% |
[ 10.0% - 10.5% ] 10.06% | 10,526 | 68.0% |
[ 10.0% - 10.5% ] 10.27% | 78,506 | 52.6% |
[ 11.0% - 11.5% ] 11.21% | 571 | 62.9% |
[ 16.0% - 16.5% ] 16.26% | 326 | 51.4% |
[ 29.5% - 30.0% ] 29.74% | 1,782 | 71.0% |
[ 30.0% - 30.5% ] 30.11% | 1,760 | 70.9% |