West Indian vs Colombian Married-Couple Family Poverty
COMPARE
West Indian
Colombian
Married-Couple Family Poverty
Married-Couple Family Poverty Comparison
West Indians
Colombians
6.4%
MARRIED-COUPLE FAMILY POVERTY
0.0/ 100
METRIC RATING
280th/ 347
METRIC RANK
5.6%
MARRIED-COUPLE FAMILY POVERTY
9.2/ 100
METRIC RATING
220th/ 347
METRIC RANK
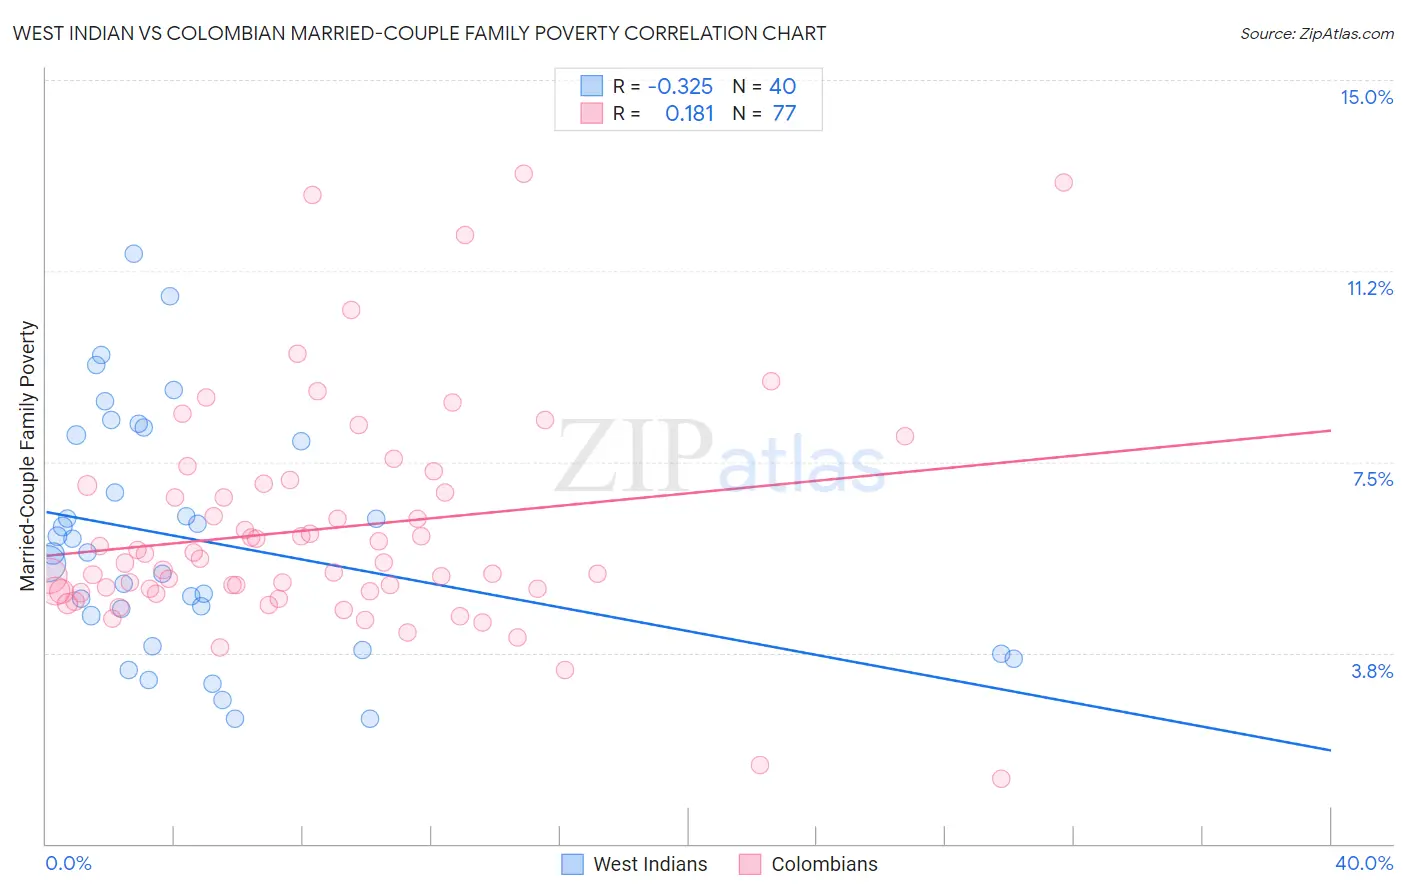
West Indian vs Colombian Married-Couple Family Poverty Correlation Chart
The statistical analysis conducted on geographies consisting of 252,794,442 people shows a mild negative correlation between the proportion of West Indians and poverty level among married-couple families in the United States with a correlation coefficient (R) of -0.325 and weighted average of 6.4%. Similarly, the statistical analysis conducted on geographies consisting of 415,629,712 people shows a poor positive correlation between the proportion of Colombians and poverty level among married-couple families in the United States with a correlation coefficient (R) of 0.181 and weighted average of 5.6%, a difference of 14.6%.
Married-Couple Family Poverty Correlation Summary
| Measurement | West Indian | Colombian |
| Minimum | 2.5% | 1.3% |
| Maximum | 11.6% | 13.2% |
| Range | 9.1% | 11.9% |
| Mean | 6.0% | 6.2% |
| Median | 5.7% | 5.5% |
| Interquartile 25% (IQ1) | 4.2% | 5.0% |
| Interquartile 75% (IQ3) | 8.0% | 7.1% |
| Interquartile Range (IQR) | 3.8% | 2.1% |
| Standard Deviation (Sample) | 2.3% | 2.2% |
| Standard Deviation (Population) | 2.3% | 2.2% |
Similar Demographics by Married-Couple Family Poverty
Demographics Similar to West Indians by Married-Couple Family Poverty
In terms of married-couple family poverty, the demographic groups most similar to West Indians are Houma (6.4%, a difference of 0.050%), Immigrants from Trinidad and Tobago (6.4%, a difference of 0.29%), Mexican American Indian (6.4%, a difference of 0.51%), Seminole (6.4%, a difference of 0.51%), and Indonesian (6.3%, a difference of 0.78%).
| Demographics | Rating | Rank | Married-Couple Family Poverty |
| Colville | 0.1 /100 | #273 | Tragic 6.3% |
| Barbadians | 0.1 /100 | #274 | Tragic 6.3% |
| Choctaw | 0.1 /100 | #275 | Tragic 6.3% |
| Yaqui | 0.1 /100 | #276 | Tragic 6.3% |
| Indonesians | 0.1 /100 | #277 | Tragic 6.3% |
| Immigrants | Trinidad and Tobago | 0.1 /100 | #278 | Tragic 6.4% |
| Houma | 0.0 /100 | #279 | Tragic 6.4% |
| West Indians | 0.0 /100 | #280 | Tragic 6.4% |
| Mexican American Indians | 0.0 /100 | #281 | Tragic 6.4% |
| Seminole | 0.0 /100 | #282 | Tragic 6.4% |
| Ute | 0.0 /100 | #283 | Tragic 6.4% |
| Dutch West Indians | 0.0 /100 | #284 | Tragic 6.4% |
| Blacks/African Americans | 0.0 /100 | #285 | Tragic 6.5% |
| Guyanese | 0.0 /100 | #286 | Tragic 6.5% |
| Ecuadorians | 0.0 /100 | #287 | Tragic 6.5% |
Demographics Similar to Colombians by Married-Couple Family Poverty
In terms of married-couple family poverty, the demographic groups most similar to Colombians are Panamanian (5.6%, a difference of 0.020%), Japanese (5.6%, a difference of 0.19%), Afghan (5.5%, a difference of 0.59%), Immigrants from Nigeria (5.5%, a difference of 0.61%), and Cajun (5.6%, a difference of 0.87%).
| Demographics | Rating | Rank | Married-Couple Family Poverty |
| Immigrants | Liberia | 13.3 /100 | #213 | Poor 5.5% |
| Iroquois | 13.1 /100 | #214 | Poor 5.5% |
| Armenians | 12.8 /100 | #215 | Poor 5.5% |
| Potawatomi | 12.4 /100 | #216 | Poor 5.5% |
| Immigrants | Nigeria | 11.3 /100 | #217 | Poor 5.5% |
| Afghans | 11.2 /100 | #218 | Poor 5.5% |
| Japanese | 9.8 /100 | #219 | Tragic 5.6% |
| Colombians | 9.2 /100 | #220 | Tragic 5.6% |
| Panamanians | 9.2 /100 | #221 | Tragic 5.6% |
| Cajuns | 6.9 /100 | #222 | Tragic 5.6% |
| Immigrants | Fiji | 6.7 /100 | #223 | Tragic 5.6% |
| Sudanese | 6.4 /100 | #224 | Tragic 5.6% |
| Immigrants | Cambodia | 6.1 /100 | #225 | Tragic 5.6% |
| South Americans | 5.7 /100 | #226 | Tragic 5.6% |
| Immigrants | Zaire | 5.6 /100 | #227 | Tragic 5.6% |