West Indian Disability
COMPARE
West Indian
Select to Compare
Disability
West Indian Disability
12.2%
DISABILITY
2.9/ 100
METRIC RATING
228th/ 347
METRIC RANK
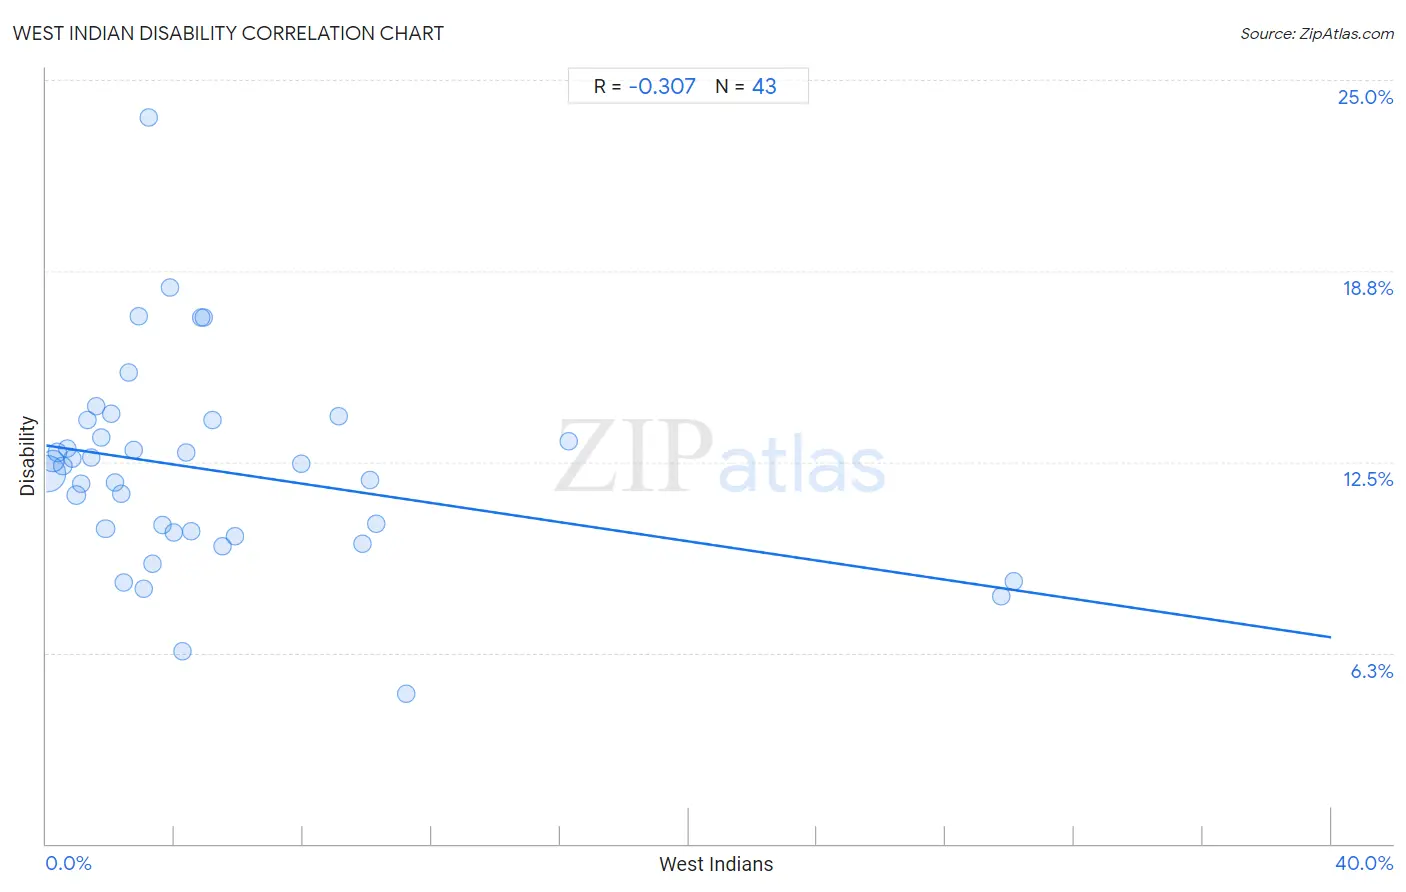
West Indian Disability Correlation Chart
The statistical analysis conducted on geographies consisting of 254,018,929 people shows a mild negative correlation between the proportion of West Indians and percentage of population with a disability in the United States with a correlation coefficient (R) of -0.307 and weighted average of 12.2%. On average, for every 1% (one percent) increase in West Indians within a typical geography, there is a decrease of 0.16% in percentage of population with a disability.

It is essential to understand that the correlation between the percentage of West Indians and percentage of population with a disability does not imply a direct cause-and-effect relationship. It remains uncertain whether the presence of West Indians influences an upward or downward trend in the level of percentage of population with a disability within an area, or if West Indians simply ended up residing in those areas with higher or lower levels of percentage of population with a disability due to other factors.
Demographics Similar to West Indians by Disability
In terms of disability, the demographic groups most similar to West Indians are Inupiat (12.2%, a difference of 0.020%), Samoan (12.2%, a difference of 0.10%), Malaysian (12.2%, a difference of 0.13%), Alsatian (12.1%, a difference of 0.14%), and Italian (12.2%, a difference of 0.14%).
| Demographics | Rating | Rank | Disability |
| Northern Europeans | 4.2 /100 | #221 | Tragic 12.1% |
| Spanish American Indians | 4.1 /100 | #222 | Tragic 12.1% |
| Hispanics or Latinos | 3.9 /100 | #223 | Tragic 12.1% |
| Mexicans | 3.7 /100 | #224 | Tragic 12.1% |
| Senegalese | 3.5 /100 | #225 | Tragic 12.1% |
| Jamaicans | 3.3 /100 | #226 | Tragic 12.1% |
| Alsatians | 3.3 /100 | #227 | Tragic 12.1% |
| West Indians | 2.9 /100 | #228 | Tragic 12.2% |
| Inupiat | 2.8 /100 | #229 | Tragic 12.2% |
| Samoans | 2.6 /100 | #230 | Tragic 12.2% |
| Malaysians | 2.5 /100 | #231 | Tragic 12.2% |
| Italians | 2.5 /100 | #232 | Tragic 12.2% |
| Bahamians | 2.3 /100 | #233 | Tragic 12.2% |
| Japanese | 2.3 /100 | #234 | Tragic 12.2% |
| Yup'ik | 2.2 /100 | #235 | Tragic 12.2% |
West Indian Disability Correlation Summary
| Measurement | West Indian Data | Disability Data |
| Minimum | 0.054% | 4.9% |
| Maximum | 30.1% | 23.8% |
| Range | 30.1% | 18.9% |
| Mean | 5.2% | 12.2% |
| Median | 3.2% | 12.4% |
| Interquartile 25% (IQ1) | 1.6% | 10.2% |
| Interquartile 75% (IQ3) | 5.5% | 13.9% |
| Interquartile Range (IQR) | 3.9% | 3.7% |
| Standard Deviation (Sample) | 6.5% | 3.3% |
| Standard Deviation (Population) | 6.4% | 3.3% |
Correlation Details
| West Indian Percentile | Sample Size | Disability |
[ 0.0% - 0.5% ] 0.054% | 173,629,355 | 12.1% |
[ 0.0% - 0.5% ] 0.21% | 39,798,897 | 12.5% |
[ 0.0% - 0.5% ] 0.35% | 13,177,815 | 12.8% |
[ 0.5% - 1.0% ] 0.51% | 6,143,160 | 12.4% |
[ 0.5% - 1.0% ] 0.66% | 4,081,201 | 12.9% |
[ 0.5% - 1.0% ] 0.82% | 2,016,759 | 12.6% |
[ 0.5% - 1.0% ] 0.95% | 10,358,686 | 11.4% |
[ 1.0% - 1.5% ] 1.09% | 1,094,105 | 11.8% |
[ 1.0% - 1.5% ] 1.28% | 571,758 | 13.9% |
[ 1.0% - 1.5% ] 1.41% | 307,467 | 12.7% |
[ 1.5% - 2.0% ] 1.56% | 439,701 | 14.3% |
[ 1.5% - 2.0% ] 1.71% | 336,886 | 13.3% |
[ 1.5% - 2.0% ] 1.85% | 186,470 | 10.3% |
[ 2.0% - 2.5% ] 2.02% | 137,340 | 14.1% |
[ 2.0% - 2.5% ] 2.15% | 200,853 | 11.8% |
[ 2.0% - 2.5% ] 2.32% | 142,294 | 11.5% |
[ 2.0% - 2.5% ] 2.42% | 208,213 | 8.5% |
[ 2.5% - 3.0% ] 2.59% | 150,463 | 15.4% |
[ 2.5% - 3.0% ] 2.73% | 286,760 | 12.9% |
[ 2.5% - 3.0% ] 2.88% | 48,107 | 17.3% |
[ 3.0% - 3.5% ] 3.05% | 5,344 | 8.3% |
[ 3.0% - 3.5% ] 3.19% | 14,763 | 23.8% |
[ 3.0% - 3.5% ] 3.32% | 190,474 | 9.2% |
[ 3.5% - 4.0% ] 3.61% | 75,725 | 10.4% |
[ 3.5% - 4.0% ] 3.85% | 4,648 | 18.2% |
[ 3.5% - 4.0% ] 3.98% | 69,375 | 10.2% |
[ 4.0% - 4.5% ] 4.23% | 1,158 | 6.3% |
[ 4.0% - 4.5% ] 4.36% | 8,164 | 12.8% |
[ 4.5% - 5.0% ] 4.52% | 22,122 | 10.2% |
[ 4.5% - 5.0% ] 4.81% | 3,181 | 17.2% |
[ 4.5% - 5.0% ] 4.91% | 3,114 | 17.2% |
[ 5.0% - 5.5% ] 5.17% | 6,851 | 13.9% |
[ 5.0% - 5.5% ] 5.50% | 32,296 | 9.7% |
[ 5.5% - 6.0% ] 5.88% | 85,425 | 10.1% |
[ 7.5% - 8.0% ] 7.93% | 83,125 | 12.4% |
[ 9.0% - 9.5% ] 9.09% | 286 | 14.0% |
[ 9.5% - 10.0% ] 9.85% | 3,117 | 9.8% |
[ 10.0% - 10.5% ] 10.06% | 10,526 | 11.9% |
[ 10.0% - 10.5% ] 10.27% | 78,506 | 10.5% |
[ 11.0% - 11.5% ] 11.21% | 571 | 4.9% |
[ 16.0% - 16.5% ] 16.26% | 326 | 13.2% |
[ 29.5% - 30.0% ] 29.74% | 1,782 | 8.1% |
[ 30.0% - 30.5% ] 30.11% | 1,760 | 8.6% |