West Indian Married-couple Households
COMPARE
West Indian
Select to Compare
Married-couple Households
West Indian Married-couple Households
40.3%
MARRIED-COUPLE HOUSEHOLDS
0.0/ 100
METRIC RATING
320th/ 347
METRIC RANK
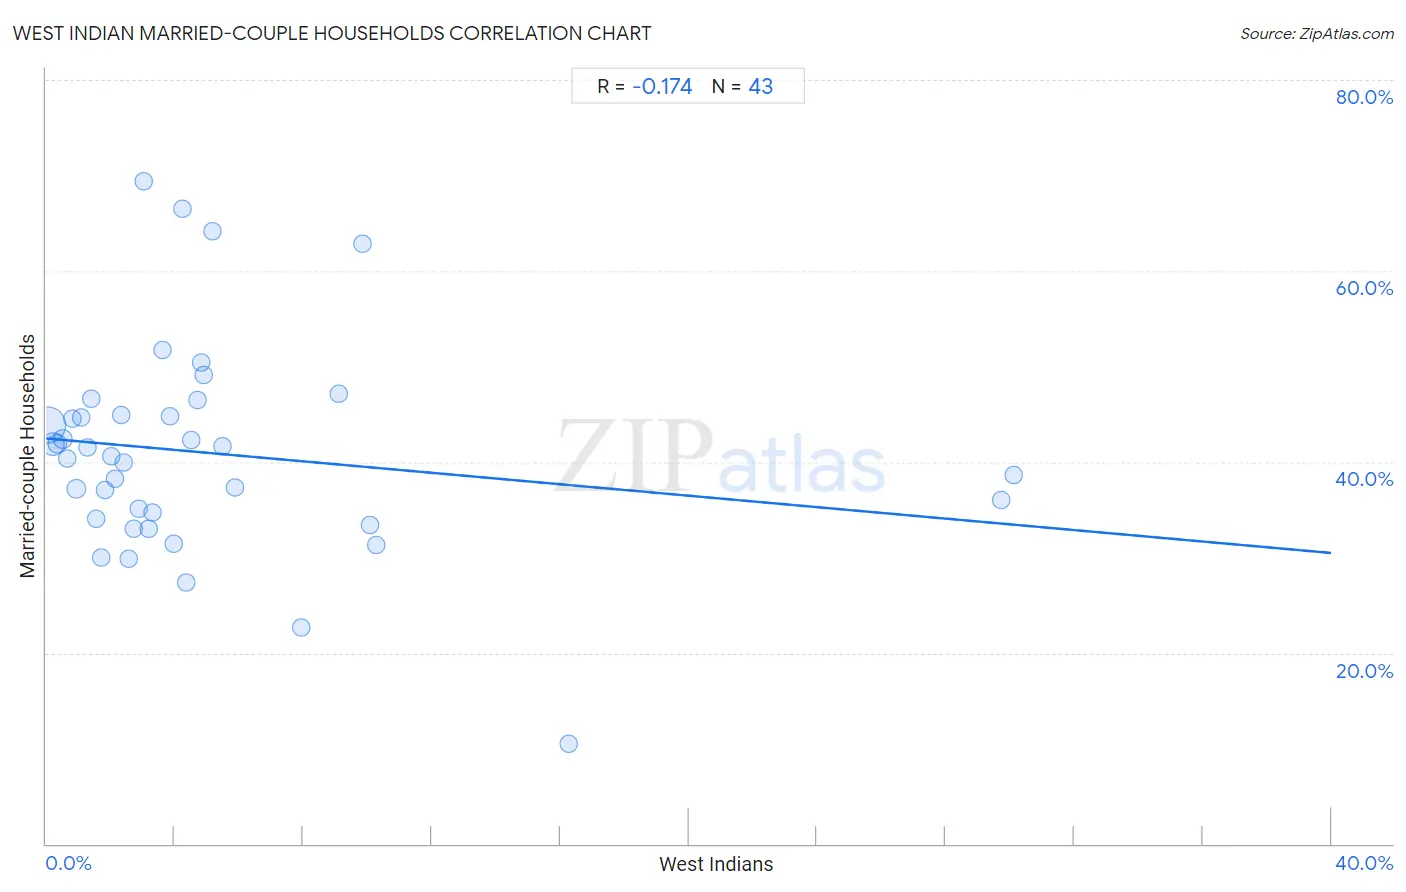
West Indian Married-couple Households Correlation Chart
The statistical analysis conducted on geographies consisting of 253,854,054 people shows a poor negative correlation between the proportion of West Indians and percentage of married-couple family households in the United States with a correlation coefficient (R) of -0.174 and weighted average of 40.3%. On average, for every 1% (one percent) increase in West Indians within a typical geography, there is a decrease of 0.30% in percentage of married-couple family households.
It is essential to understand that the correlation between the percentage of West Indians and percentage of married-couple family households does not imply a direct cause-and-effect relationship. It remains uncertain whether the presence of West Indians influences an upward or downward trend in the level of percentage of married-couple family households within an area, or if West Indians simply ended up residing in those areas with higher or lower levels of percentage of married-couple family households due to other factors.
Demographics Similar to West Indians by Married-couple Households
In terms of married-couple households, the demographic groups most similar to West Indians are Immigrants from Liberia (40.3%, a difference of 0.040%), Bahamian (40.5%, a difference of 0.42%), Immigrants from Zaire (40.1%, a difference of 0.70%), Puerto Rican (40.1%, a difference of 0.70%), and Navajo (40.1%, a difference of 0.71%).
| Demographics | Rating | Rank | Married-couple Households |
| Immigrants from Haiti | 0.0 /100 | #313 | Tragic 40.9% |
| Jamaicans | 0.0 /100 | #314 | Tragic 40.9% |
| Trinidadians and Tobagonians | 0.0 /100 | #315 | Tragic 40.9% |
| Immigrants from Caribbean | 0.0 /100 | #316 | Tragic 40.8% |
| Immigrants from Jamaica | 0.0 /100 | #317 | Tragic 40.7% |
| Liberians | 0.0 /100 | #318 | Tragic 40.7% |
| Bahamians | 0.0 /100 | #319 | Tragic 40.5% |
| West Indians | 0.0 /100 | #320 | Tragic 40.3% |
| Immigrants from Liberia | 0.0 /100 | #321 | Tragic 40.3% |
| Immigrants from Zaire | 0.0 /100 | #322 | Tragic 40.1% |
| Puerto Ricans | 0.0 /100 | #323 | Tragic 40.1% |
| Navajo | 0.0 /100 | #324 | Tragic 40.1% |
| Pueblo | 0.0 /100 | #325 | Tragic 40.0% |
| U.S. Virgin Islanders | 0.0 /100 | #326 | Tragic 39.8% |
| Lumbee | 0.0 /100 | #327 | Tragic 39.6% |
West Indian Married-couple Households Correlation Summary
| Measurement | West Indian Data | Married-couple Households Data |
| Minimum | 0.054% | 10.5% |
| Maximum | 30.1% | 69.4% |
| Range | 30.1% | 58.9% |
| Mean | 5.1% | 40.9% |
| Median | 3.2% | 40.5% |
| Interquartile 25% (IQ1) | 1.6% | 34.0% |
| Interquartile 75% (IQ3) | 5.2% | 44.9% |
| Interquartile Range (IQR) | 3.6% | 10.8% |
| Standard Deviation (Sample) | 6.5% | 11.1% |
| Standard Deviation (Population) | 6.4% | 11.0% |
Correlation Details
| West Indian Percentile | Sample Size | Married-couple Households |
[ 0.0% - 0.5% ] 0.054% | 173,558,376 | 43.8% |
[ 0.0% - 0.5% ] 0.21% | 39,742,161 | 41.9% |
[ 0.0% - 0.5% ] 0.35% | 13,163,463 | 41.9% |
[ 0.5% - 1.0% ] 0.51% | 6,141,687 | 42.4% |
[ 0.5% - 1.0% ] 0.66% | 4,079,123 | 40.4% |
[ 0.5% - 1.0% ] 0.82% | 2,015,757 | 44.5% |
[ 0.5% - 1.0% ] 0.95% | 10,357,035 | 37.2% |
[ 1.0% - 1.5% ] 1.09% | 1,093,109 | 44.6% |
[ 1.0% - 1.5% ] 1.28% | 569,925 | 41.5% |
[ 1.0% - 1.5% ] 1.41% | 306,165 | 46.7% |
[ 1.5% - 2.0% ] 1.56% | 435,010 | 34.0% |
[ 1.5% - 2.0% ] 1.71% | 334,892 | 30.0% |
[ 1.5% - 2.0% ] 1.85% | 181,371 | 37.1% |
[ 2.0% - 2.5% ] 2.03% | 136,528 | 40.5% |
[ 2.0% - 2.5% ] 2.15% | 200,853 | 38.2% |
[ 2.0% - 2.5% ] 2.32% | 142,294 | 44.9% |
[ 2.0% - 2.5% ] 2.42% | 208,213 | 39.9% |
[ 2.5% - 3.0% ] 2.59% | 150,463 | 29.8% |
[ 2.5% - 3.0% ] 2.73% | 286,760 | 33.0% |
[ 2.5% - 3.0% ] 2.88% | 48,107 | 35.0% |
[ 3.0% - 3.5% ] 3.05% | 5,344 | 69.4% |
[ 3.0% - 3.5% ] 3.19% | 14,545 | 33.0% |
[ 3.0% - 3.5% ] 3.32% | 190,474 | 34.7% |
[ 3.5% - 4.0% ] 3.61% | 75,725 | 51.8% |
[ 3.5% - 4.0% ] 3.85% | 4,648 | 44.8% |
[ 3.5% - 4.0% ] 3.98% | 69,375 | 31.4% |
[ 4.0% - 4.5% ] 4.23% | 1,158 | 66.5% |
[ 4.0% - 4.5% ] 4.36% | 8,164 | 27.3% |
[ 4.5% - 5.0% ] 4.52% | 22,122 | 42.2% |
[ 4.5% - 5.0% ] 4.71% | 912 | 46.5% |
[ 4.5% - 5.0% ] 4.81% | 3,181 | 50.4% |
[ 4.5% - 5.0% ] 4.91% | 3,114 | 49.1% |
[ 5.0% - 5.5% ] 5.17% | 6,851 | 64.2% |
[ 5.0% - 5.5% ] 5.50% | 32,296 | 41.7% |
[ 5.5% - 6.0% ] 5.88% | 85,425 | 37.3% |
[ 7.5% - 8.0% ] 7.93% | 83,125 | 22.7% |
[ 9.0% - 9.5% ] 9.09% | 286 | 47.2% |
[ 9.5% - 10.0% ] 9.85% | 3,117 | 62.9% |
[ 10.0% - 10.5% ] 10.06% | 10,526 | 33.4% |
[ 10.0% - 10.5% ] 10.27% | 78,506 | 31.3% |
[ 16.0% - 16.5% ] 16.26% | 326 | 10.5% |
[ 29.5% - 30.0% ] 29.74% | 1,782 | 36.0% |
[ 30.0% - 30.5% ] 30.11% | 1,760 | 38.6% |