Macedonian vs Czechoslovakian Married-Couple Family Poverty
COMPARE
Macedonian
Czechoslovakian
Married-Couple Family Poverty
Married-Couple Family Poverty Comparison
Macedonians
Czechoslovakians
4.4%
MARRIED-COUPLE FAMILY POVERTY
99.4/ 100
METRIC RATING
65th/ 347
METRIC RANK
4.4%
MARRIED-COUPLE FAMILY POVERTY
99.7/ 100
METRIC RATING
58th/ 347
METRIC RANK
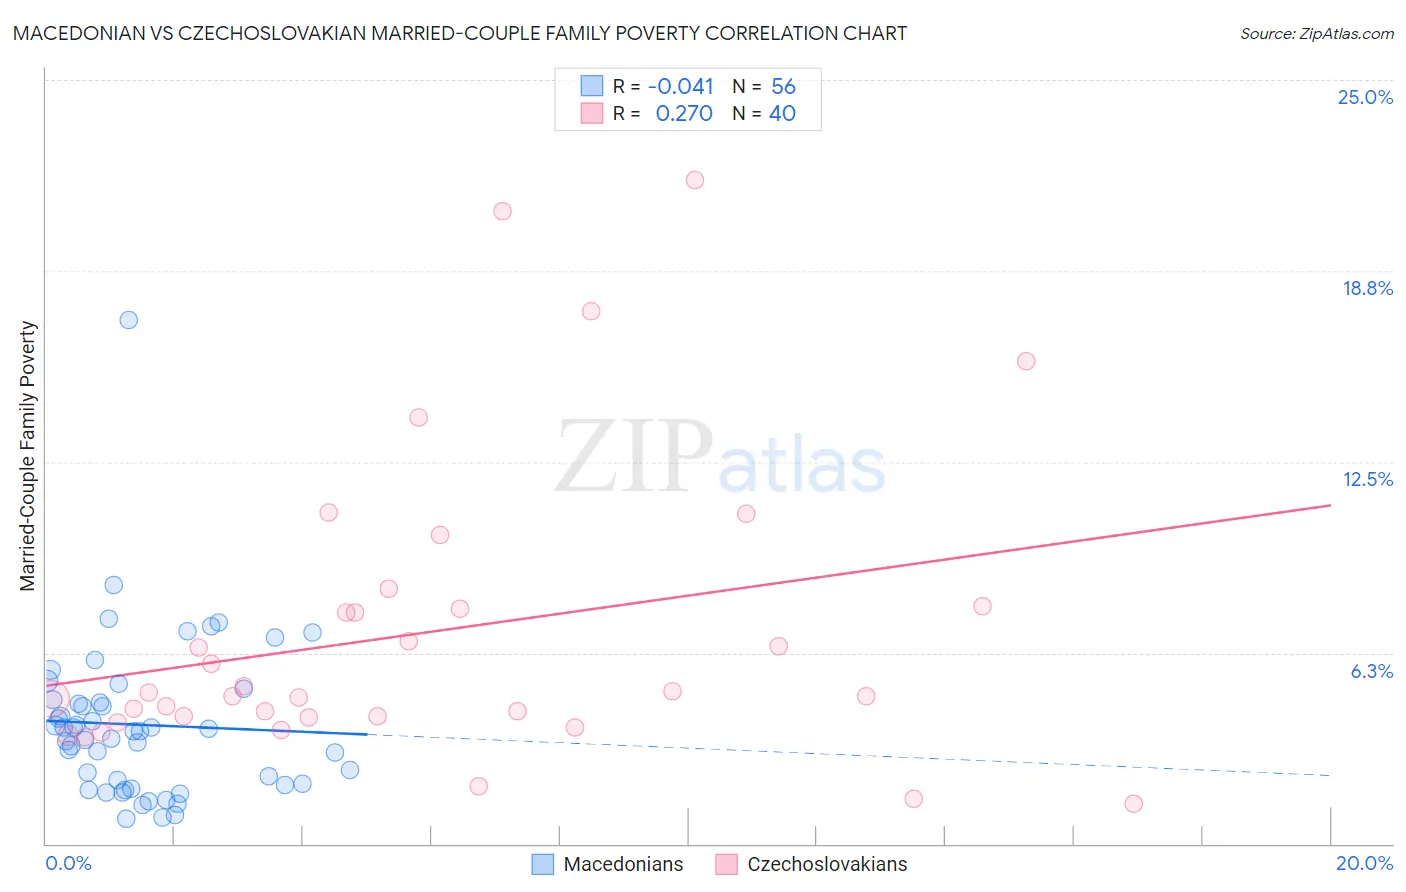
Macedonian vs Czechoslovakian Married-Couple Family Poverty Correlation Chart
The statistical analysis conducted on geographies consisting of 132,044,317 people shows no correlation between the proportion of Macedonians and poverty level among married-couple families in the United States with a correlation coefficient (R) of -0.041 and weighted average of 4.4%. Similarly, the statistical analysis conducted on geographies consisting of 364,959,932 people shows a weak positive correlation between the proportion of Czechoslovakians and poverty level among married-couple families in the United States with a correlation coefficient (R) of 0.270 and weighted average of 4.4%, a difference of 2.0%.
Married-Couple Family Poverty Correlation Summary
| Measurement | Macedonian | Czechoslovakian |
| Minimum | 0.82% | 1.3% |
| Maximum | 17.2% | 21.7% |
| Range | 16.3% | 20.4% |
| Mean | 3.9% | 6.9% |
| Median | 3.7% | 4.9% |
| Interquartile 25% (IQ1) | 2.0% | 4.2% |
| Interquartile 75% (IQ3) | 4.7% | 7.7% |
| Interquartile Range (IQR) | 2.7% | 3.6% |
| Standard Deviation (Sample) | 2.6% | 4.9% |
| Standard Deviation (Population) | 2.6% | 4.8% |
Demographics Similar to Macedonians and Czechoslovakians by Married-Couple Family Poverty
In terms of married-couple family poverty, the demographic groups most similar to Macedonians are Immigrants from Serbia (4.4%, a difference of 0.13%), Immigrants from Canada (4.4%, a difference of 0.18%), Slavic (4.4%, a difference of 0.19%), New Zealander (4.4%, a difference of 0.20%), and Immigrants from Korea (4.5%, a difference of 0.34%). Similarly, the demographic groups most similar to Czechoslovakians are Immigrants from Zimbabwe (4.3%, a difference of 0.090%), Immigrants from Netherlands (4.3%, a difference of 0.090%), French (4.3%, a difference of 0.24%), Austrian (4.3%, a difference of 0.27%), and Welsh (4.3%, a difference of 0.53%).
| Demographics | Rating | Rank | Married-Couple Family Poverty |
| Immigrants | Lithuania | 99.7 /100 | #51 | Exceptional 4.3% |
| Russians | 99.7 /100 | #52 | Exceptional 4.3% |
| Welsh | 99.7 /100 | #53 | Exceptional 4.3% |
| Austrians | 99.7 /100 | #54 | Exceptional 4.3% |
| French | 99.7 /100 | #55 | Exceptional 4.3% |
| Immigrants | Zimbabwe | 99.7 /100 | #56 | Exceptional 4.3% |
| Immigrants | Netherlands | 99.7 /100 | #57 | Exceptional 4.3% |
| Czechoslovakians | 99.7 /100 | #58 | Exceptional 4.4% |
| Immigrants | Sweden | 99.6 /100 | #59 | Exceptional 4.4% |
| Tlingit-Haida | 99.6 /100 | #60 | Exceptional 4.4% |
| Okinawans | 99.6 /100 | #61 | Exceptional 4.4% |
| Immigrants | Australia | 99.6 /100 | #62 | Exceptional 4.4% |
| Immigrants | Sri Lanka | 99.6 /100 | #63 | Exceptional 4.4% |
| Immigrants | Bulgaria | 99.5 /100 | #64 | Exceptional 4.4% |
| Macedonians | 99.4 /100 | #65 | Exceptional 4.4% |
| Immigrants | Serbia | 99.4 /100 | #66 | Exceptional 4.4% |
| Immigrants | Canada | 99.4 /100 | #67 | Exceptional 4.4% |
| Slavs | 99.4 /100 | #68 | Exceptional 4.4% |
| New Zealanders | 99.4 /100 | #69 | Exceptional 4.4% |
| Immigrants | Korea | 99.4 /100 | #70 | Exceptional 4.5% |
| Immigrants | North America | 99.3 /100 | #71 | Exceptional 4.5% |