Macedonian Unemployment Among Women with Children Ages 6 to 17 years

COMPARE

Macedonian
Race
Ancestry
AfghanAfricanAlaska NativeAlaskan AthabascanAlbanianAleutAlsatianAmericanApacheArabArapahoArgentineanArmenianAssyrian/Chaldean/SyriacAustralianAustrianBahamianBangladeshiBarbadianBasqueBelgianBelizeanBermudanBhutaneseBlackfeetBolivianBrazilianBritishBritish West IndianBulgarianBurmeseCajunCambodianCanadianCape VerdeanCarpatho RusynCelticCentral AmericanCentral American IndianCherokeeCheyenneChickasawChileanChineseChippewaChoctawColombianColvilleComancheCosta RicanCreeCreekCroatianCrowCubanCypriotCzechCzechoslovakianDanishDelawareDominicanDutchDutch West IndianEastern EuropeanEcuadorianEgyptianEnglishEstonianEthiopianEuropeanFijianFilipinoFinnishFrenchFrench American IndianFrench CanadianGermanGerman RussianGhanaianGreekGuamanian/ChamorroGuatemalanGuyaneseHaitianHmongHonduranHopiHoumaHungarianIcelanderIndian (Asian)IndonesianInupiatIranianIraqiIrishIroquoisIsraeliItalianJamaicanJapaneseJordanianKenyanKiowaKoreanLaotianLatvianLebaneseLiberianLithuanianLumbeeLuxembourgerMacedonianMalaysianMalteseMarshalleseMenomineeMexicanMexican American IndianMongolianMoroccanNative HawaiianNavajoNepaleseNew ZealanderNicaraguanNigerianNorthern EuropeanNorwegianOkinawanOsageOttawaPaiutePakistaniPalestinianPanamanianParaguayanPennsylvania GermanPeruvianPimaPolishPortuguesePotawatomiPuebloPuerto RicanPuget Sound SalishRomanianRussianSalvadoranSamoanScandinavianScotch-IrishScottishSeminoleSenegaleseSerbianShoshoneSierra LeoneanSiouxSlavicSlovakSloveneSomaliSouth AfricanSouth AmericanSouth American IndianSoviet UnionSpaniardSpanishSpanish AmericanSpanish American IndianSri LankanSubsaharan AfricanSudaneseSwedishSwissSyrianTaiwaneseThaiTlingit-HaidaTohono O'OdhamTonganTrinidadian and TobagonianTsimshianTurkishU.S. Virgin IslanderUgandanUkrainianUruguayanUteVenezuelanVietnameseWelshWest IndianYakamaYaquiYugoslavianYumanYup'ikZimbabwean
Immigration
NonimmigrantsImmigrantsAfghanistanAfricaAlbaniaArgentinaArmeniaAsiaAustraliaAustriaBahamasBangladeshBarbadosBelarusBelgiumBelizeBoliviaBosnia and HerzegovinaBrazilBulgariaBurma/MyanmarCabo VerdeCambodiaCameroonCanadaCaribbeanCentral AmericaChileChinaColombiaCongoCosta RicaCroatiaCubaCzechoslovakiaDenmarkDominicaDominican RepublicEastern AfricaEastern AsiaEastern EuropeEcuadorEgyptEl SalvadorEnglandEritreaEthiopiaEuropeFijiFranceGermanyGhanaGreeceGrenadaGuatemalaGuyanaHaitiHondurasHong KongHungaryIndiaIndonesiaIranIraqIrelandIsraelItalyJamaicaJapanJordanKazakhstanKenyaKoreaKuwaitLaosLatin AmericaLatviaLebanonLiberiaLithuaniaMalaysiaMexicoMicronesiaMiddle AfricaMoldovaMoroccoNepalNetherlandsNicaraguaNigeriaNorth AmericaNorth MacedoniaNorthern AfricaNorthern EuropeNorwayOceaniaPakistanPanamaPeruPhilippinesPolandPortugalRomaniaRussiaSaudi ArabiaScotlandSenegalSerbiaSierra LeoneSingaporeSomaliaSouth AfricaSouth AmericaSouth Central AsiaSouth Eastern AsiaSouthern EuropeSpainSri LankaSt. Vincent and the GrenadinesSudanSwedenSwitzerlandSyriaTaiwanThailandTrinidad and TobagoTurkeyUgandaUkraineUruguayUzbekistanVenezuelaVietnamWest IndiesWestern AfricaWestern AsiaWestern EuropeYemenZaireZimbabweAzores
Select to Compare
Race
Ancestry
AfghanAfricanAlaska NativeAlaskan AthabascanAlbanianAleutAlsatianAmericanApacheArabArapahoArgentineanArmenianAssyrian/Chaldean/SyriacAustralianAustrianBahamianBangladeshiBarbadianBasqueBelgianBelizeanBermudanBhutaneseBlackfeetBolivianBrazilianBritishBritish West IndianBulgarianBurmeseCajunCambodianCanadianCape VerdeanCarpatho RusynCelticCentral AmericanCentral American IndianCherokeeCheyenneChickasawChileanChineseChippewaChoctawColombianColvilleComancheCosta RicanCreeCreekCroatianCrowCubanCypriotCzechCzechoslovakianDanishDelawareDominicanDutchDutch West IndianEastern EuropeanEcuadorianEgyptianEnglishEstonianEthiopianEuropeanFijianFilipinoFinnishFrenchFrench American IndianFrench CanadianGermanGerman RussianGhanaianGreekGuamanian/ChamorroGuatemalanGuyaneseHaitianHmongHonduranHopiHoumaHungarianIcelanderIndian (Asian)IndonesianInupiatIranianIraqiIrishIroquoisIsraeliItalianJamaicanJapaneseJordanianKenyanKiowaKoreanLaotianLatvianLebaneseLiberianLithuanianLumbeeLuxembourgerMalaysianMalteseMarshalleseMenomineeMexicanMexican American IndianMongolianMoroccanNative HawaiianNavajoNepaleseNew ZealanderNicaraguanNigerianNorthern EuropeanNorwegianOkinawanOsageOttawaPaiutePakistaniPalestinianPanamanianParaguayanPennsylvania GermanPeruvianPimaPolishPortuguesePotawatomiPuebloPuerto RicanPuget Sound SalishRomanianRussianSalvadoranSamoanScandinavianScotch-IrishScottishSeminoleSenegaleseSerbianShoshoneSierra LeoneanSiouxSlavicSlovakSloveneSomaliSouth AfricanSouth AmericanSouth American IndianSoviet UnionSpaniardSpanishSpanish AmericanSpanish American IndianSri LankanSubsaharan AfricanSudaneseSwedishSwissSyrianTaiwaneseThaiTlingit-HaidaTohono O'OdhamTonganTrinidadian and TobagonianTsimshianTurkishU.S. Virgin IslanderUgandanUkrainianUruguayanUteVenezuelanVietnameseWelshWest IndianYakamaYaquiYugoslavianYumanYup'ikZimbabwean
Immigration
NonimmigrantsImmigrantsAfghanistanAfricaAlbaniaArgentinaArmeniaAsiaAustraliaAustriaBahamasBangladeshBarbadosBelarusBelgiumBelizeBoliviaBosnia and HerzegovinaBrazilBulgariaBurma/MyanmarCabo VerdeCambodiaCameroonCanadaCaribbeanCentral AmericaChileChinaColombiaCongoCosta RicaCroatiaCubaCzechoslovakiaDenmarkDominicaDominican RepublicEastern AfricaEastern AsiaEastern EuropeEcuadorEgyptEl SalvadorEnglandEritreaEthiopiaEuropeFijiFranceGermanyGhanaGreeceGrenadaGuatemalaGuyanaHaitiHondurasHong KongHungaryIndiaIndonesiaIranIraqIrelandIsraelItalyJamaicaJapanJordanKazakhstanKenyaKoreaKuwaitLaosLatin AmericaLatviaLebanonLiberiaLithuaniaMalaysiaMexicoMicronesiaMiddle AfricaMoldovaMoroccoNepalNetherlandsNicaraguaNigeriaNorth AmericaNorth MacedoniaNorthern AfricaNorthern EuropeNorwayOceaniaPakistanPanamaPeruPhilippinesPolandPortugalRomaniaRussiaSaudi ArabiaScotlandSenegalSerbiaSierra LeoneSingaporeSomaliaSouth AfricaSouth AmericaSouth Central AsiaSouth Eastern AsiaSouthern EuropeSpainSri LankaSt. Vincent and the GrenadinesSudanSwedenSwitzerlandSyriaTaiwanThailandTrinidad and TobagoTurkeyUgandaUkraineUruguayUzbekistanVenezuelaVietnamWest IndiesWestern AfricaWestern AsiaWestern EuropeYemenZaireZimbabweAzores
Unemployment Among Women with Children Ages 6 to 17 years
Income
Poverty
Unemployment
Labor Participation
Family Structure
Vehicle Availability
Education Level
Disability

Macedonian Unemployment Among Women with Children Ages 6 to 17 years
Tragic

9.3%
UNEMPLOYMENT | WOMEN W/ CHILDREN 6 TO 17
3.9/ 100
METRIC RATING
231st/ 347
METRIC RANK

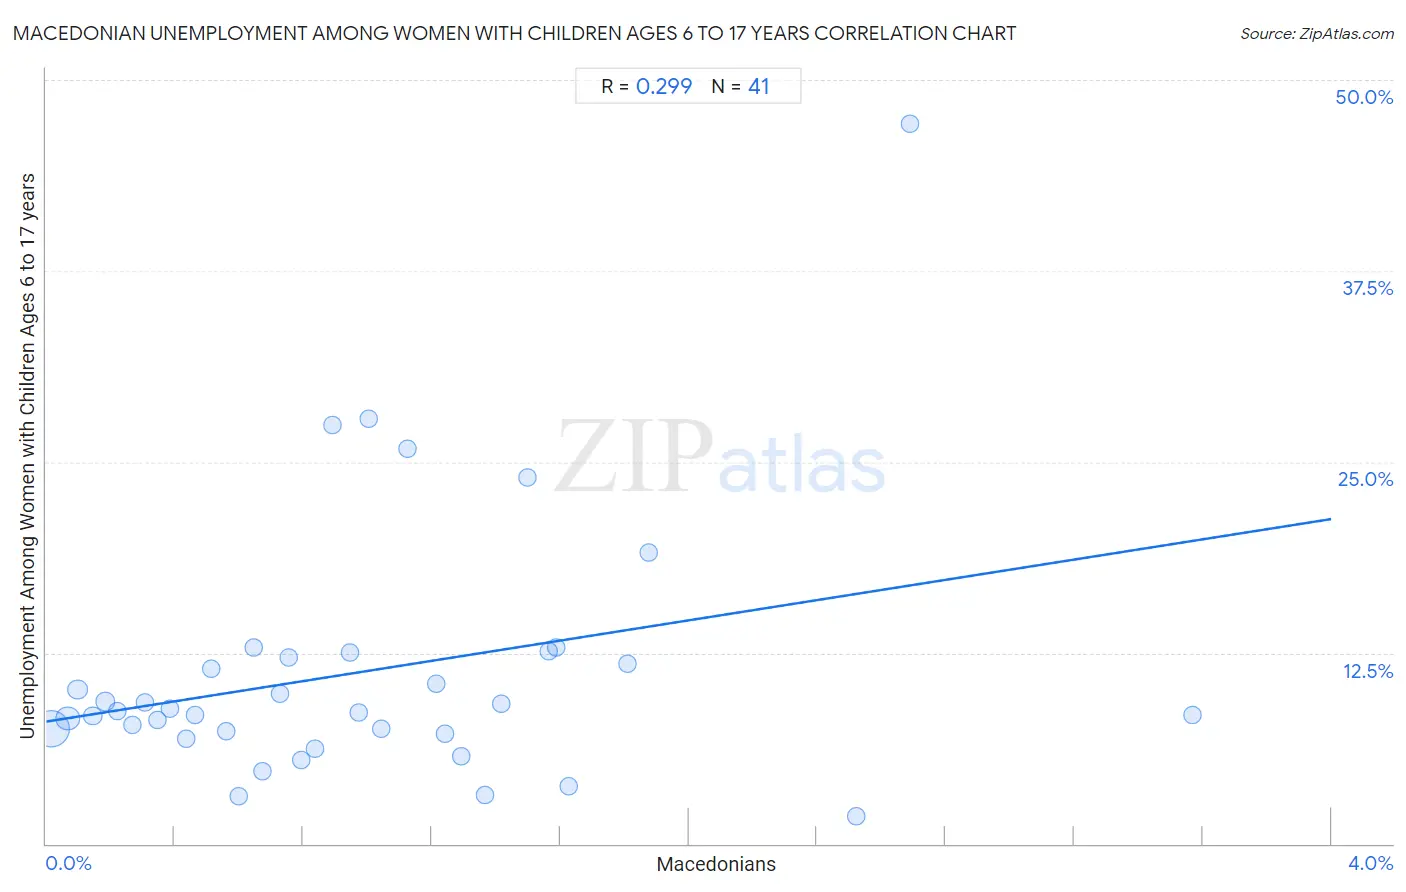
Macedonian Unemployment Among Women with Children Ages 6 to 17 years Correlation Chart

The statistical analysis conducted on geographies consisting of 106,790,801 people shows a weak positive correlation between the proportion of Macedonians and unemployment rate among women with children between the ages 6 and 17 in the United States with a correlation coefficient (R) of 0.299 and weighted average of 9.3%. On average, for every 1% (one percent) increase in Macedonians within a typical geography, there is an increase of 3.3% in unemployment rate among women with children between the ages 6 and 17.
Macedonian Unemployment Among Women with Children Ages 6 to 17 years
It is essential to understand that the correlation between the percentage of Macedonians and unemployment rate among women with children between the ages 6 and 17 does not imply a direct cause-and-effect relationship. It remains uncertain whether the presence of Macedonians influences an upward or downward trend in the level of unemployment rate among women with children between the ages 6 and 17 within an area, or if Macedonians simply ended up residing in those areas with higher or lower levels of unemployment rate among women with children between the ages 6 and 17 due to other factors.

Demographics Similar to Macedonians by Unemployment Among Women with Children Ages 6 to 17 years

In terms of unemployment among women with children ages 6 to 17 years, the demographic groups most similar to Macedonians are Welsh (9.3%, a difference of 0.010%), French American Indian (9.3%, a difference of 0.060%), Lumbee (9.3%, a difference of 0.10%), Estonian (9.3%, a difference of 0.14%), and Panamanian (9.3%, a difference of 0.16%).
DemographicsRating | RankUnemployment Among Women with Children Ages 6 to 17 years
Immigrants from El Salvador
5.3
/100
|
#224
Tragic
9.3%
Chinese
5.2
/100
|
#225
Tragic
9.3%
Immigrants from the Azores
4.6
/100
|
#226
Tragic
9.3%
Panamanians
4.5
/100
|
#227
Tragic
9.3%
Estonians
4.4
/100
|
#228
Tragic
9.3%
Lumbee
4.3
/100
|
#229
Tragic
9.3%
Welsh
4.0
/100
|
#230
Tragic
9.3%
Macedonians
3.9
/100
|
#231
Tragic
9.3%
French American Indians
3.7
/100
|
#232
Tragic
9.3%
Immigrants from St. Vincent and the Grenadines
3.3
/100
|
#233
Tragic
9.3%
Mexicans
3.2
/100
|
#234
Tragic
9.3%
Uruguayans
3.0
/100
|
#235
Tragic
9.3%
Hungarians
3.0
/100
|
#236
Tragic
9.3%
Immigrants from Belize
2.8
/100
|
#237
Tragic
9.3%
Arabs
2.7
/100
|
#238
Tragic
9.3%

Macedonian Unemployment Among Women with Children Ages 6 to 17 years Correlation Summary

MeasurementMacedonian DataUnemployment Among Women with Children Ages 6 to 17 years Data
Minimum0.015%1.8%
Maximum3.6%47.1%
Range3.6%45.3%
Mean0.98%11.3%
Median0.84%8.7%
Interquartile 25% (IQ1)0.41%7.3%
Interquartile 75% (IQ3)1.4%12.3%
Interquartile Range (IQR)0.98%5.1%
Standard Deviation (Sample)0.76%8.4%
Standard Deviation (Population)0.75%8.3%

Correlation Details

Macedonian PercentileSample SizeUnemployment Among Women with Children Ages 6 to 17 years
[
0.0%
-
0.5%
]
0.015%
67,724,2727.6%
[
0.0%
-
0.5%
]
0.067%
20,597,3258.2%
[
0.0%
-
0.5%
]
0.097%
8,149,26910.1%
[
0.0%
-
0.5%
]
0.14%
2,338,8338.4%
[
0.0%
-
0.5%
]
0.18%
2,445,5279.3%
[
0.0%
-
0.5%
]
0.22%
992,5958.7%
[
0.0%
-
0.5%
]
0.27%
640,5427.8%
[
0.0%
-
0.5%
]
0.31%
372,1869.3%
[
0.0%
-
0.5%
]
0.35%
408,6938.1%
[
0.0%
-
0.5%
]
0.39%
504,0928.8%
[
0.0%
-
0.5%
]
0.44%
110,3986.9%
[
0.0%
-
0.5%
]
0.46%
194,9708.4%
[
0.5%
-
1.0%
]
0.51%
217,14211.5%
[
0.5%
-
1.0%
]
0.56%
265,5337.4%
[
0.5%
-
1.0%
]
0.60%
132,7933.1%
[
0.5%
-
1.0%
]
0.64%
58,62212.8%
[
0.5%
-
1.0%
]
0.67%
150,3864.7%
[
0.5%
-
1.0%
]
0.73%
186,3199.8%
[
0.5%
-
1.0%
]
0.75%
194,99212.2%
[
0.5%
-
1.0%
]
0.79%
131,2635.5%
[
0.5%
-
1.0%
]
0.84%
213,5826.2%
[
0.5%
-
1.0%
]
0.89%
32,02027.5%
[
0.5%
-
1.0%
]
0.94%
1,05912.5%
[
0.5%
-
1.0%
]
0.97%
36,5568.6%
[
1.0%
-
1.5%
]
1.01%
4,97227.8%
[
1.0%
-
1.5%
]
1.04%
107,1997.5%
[
1.0%
-
1.5%
]
1.12%
29,56525.9%
[
1.0%
-
1.5%
]
1.22%
105,55710.5%
[
1.0%
-
1.5%
]
1.24%
30,0857.2%
[
1.0%
-
1.5%
]
1.29%
40,3925.7%
[
1.0%
-
1.5%
]
1.36%
34,0043.2%
[
1.0%
-
1.5%
]
1.41%
13,2919.2%
[
1.0%
-
1.5%
]
1.50%
14,07224.0%
[
1.5%
-
2.0%
]
1.56%
10,87512.6%
[
1.5%
-
2.0%
]
1.59%
102,35712.8%
[
1.5%
-
2.0%
]
1.63%
21,5873.8%
[
1.5%
-
2.0%
]
1.81%
33,73511.8%
[
1.5%
-
2.0%
]
1.87%
4,48219.1%
[
2.5%
-
3.0%
]
2.52%
32,1931.8%
[
2.5%
-
3.0%
]
2.69%
42,52247.1%
[
3.5%
-
4.0%
]
3.57%
64,9448.4%