Macedonian College, Under 1 year
COMPARE
Macedonian
Select to Compare
College, Under 1 year
Macedonian College, Under 1 year
67.6%
COLLEGE, UNDER 1 YEAR
95.7/ 100
METRIC RATING
112th/ 347
METRIC RANK
Macedonian College, Under 1 year Correlation Chart
The statistical analysis conducted on geographies consisting of 132,646,607 people shows no correlation between the proportion of Macedonians and percentage of population with at least college, under 1 year education in the United States with a correlation coefficient (R) of 0.046 and weighted average of 67.6%. On average, for every 1% (one percent) increase in Macedonians within a typical geography, there is an increase of 0.23% in percentage of population with at least college, under 1 year education.
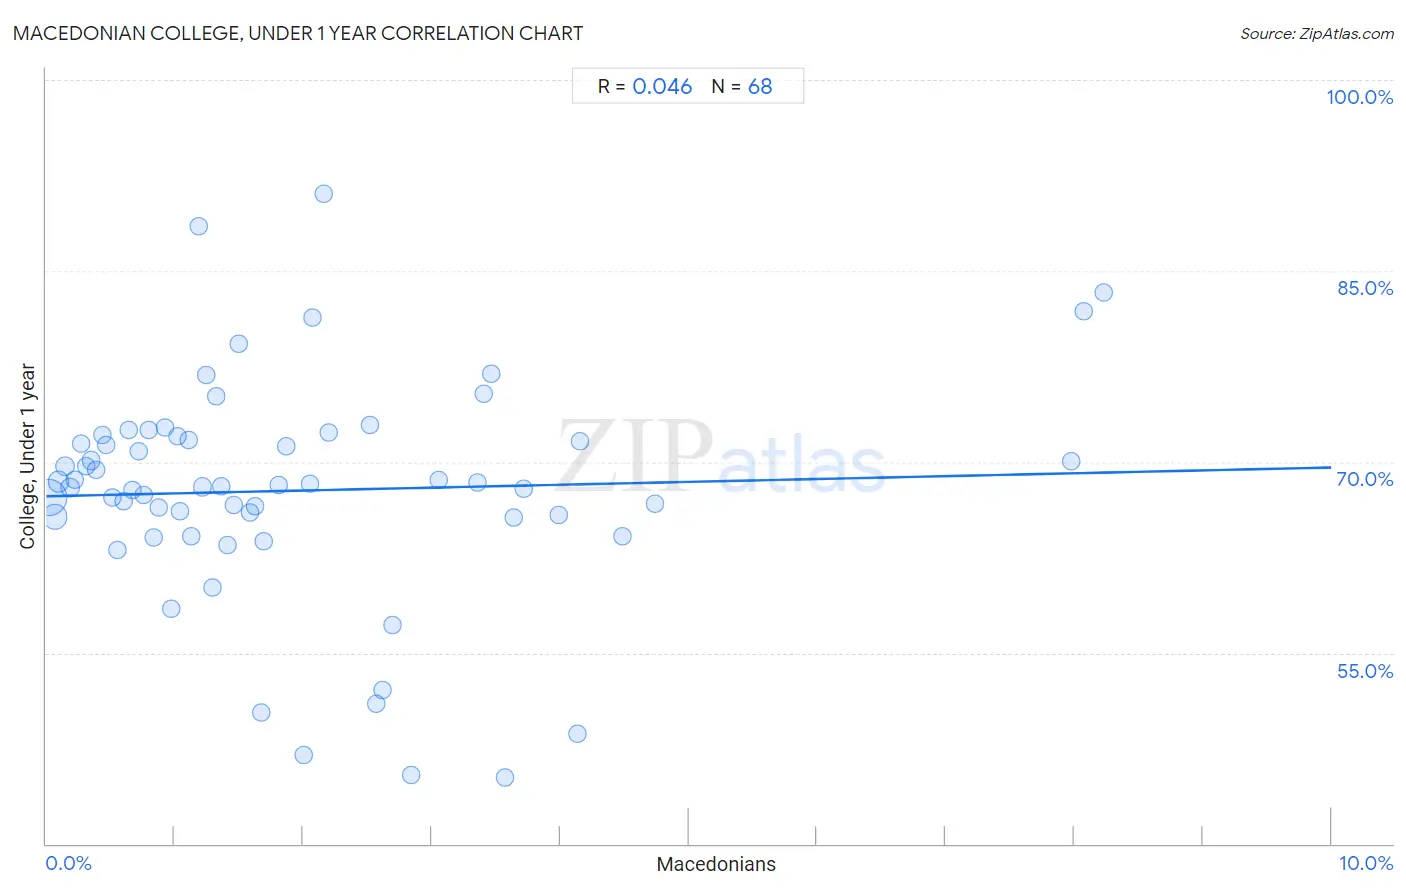
It is essential to understand that the correlation between the percentage of Macedonians and percentage of population with at least college, under 1 year education does not imply a direct cause-and-effect relationship. It remains uncertain whether the presence of Macedonians influences an upward or downward trend in the level of percentage of population with at least college, under 1 year education within an area, or if Macedonians simply ended up residing in those areas with higher or lower levels of percentage of population with at least college, under 1 year education due to other factors.
Demographics Similar to Macedonians by College, Under 1 year
In terms of college, under 1 year, the demographic groups most similar to Macedonians are Scandinavian (67.7%, a difference of 0.020%), Assyrian/Chaldean/Syriac (67.7%, a difference of 0.020%), Ukrainian (67.7%, a difference of 0.020%), Syrian (67.6%, a difference of 0.030%), and Immigrants from Egypt (67.7%, a difference of 0.080%).
| Demographics | Rating | Rank | College, Under 1 year |
| Afghans | 96.6 /100 | #105 | Exceptional 67.8% |
| Immigrants from Croatia | 96.6 /100 | #106 | Exceptional 67.8% |
| Austrians | 96.4 /100 | #107 | Exceptional 67.8% |
| Immigrants from Egypt | 96.0 /100 | #108 | Exceptional 67.7% |
| Scandinavians | 95.8 /100 | #109 | Exceptional 67.7% |
| Assyrians/Chaldeans/Syriacs | 95.8 /100 | #110 | Exceptional 67.7% |
| Ukrainians | 95.8 /100 | #111 | Exceptional 67.7% |
| Macedonians | 95.7 /100 | #112 | Exceptional 67.6% |
| Syrians | 95.6 /100 | #113 | Exceptional 67.6% |
| Chileans | 95.3 /100 | #114 | Exceptional 67.6% |
| Basques | 95.2 /100 | #115 | Exceptional 67.6% |
| Immigrants from Nepal | 94.9 /100 | #116 | Exceptional 67.5% |
| Pakistanis | 94.8 /100 | #117 | Exceptional 67.5% |
| Immigrants from Ukraine | 94.7 /100 | #118 | Exceptional 67.5% |
| Lebanese | 94.6 /100 | #119 | Exceptional 67.5% |
Macedonian College, Under 1 year Correlation Summary
| Measurement | Macedonian Data | College, Under 1 year Data |
| Minimum | 0.016% | 45.2% |
| Maximum | 8.2% | 91.1% |
| Range | 8.2% | 45.9% |
| Mean | 1.9% | 67.7% |
| Median | 1.4% | 68.1% |
| Interquartile 25% (IQ1) | 0.70% | 65.6% |
| Interquartile 75% (IQ3) | 2.7% | 71.8% |
| Interquartile Range (IQR) | 2.0% | 6.2% |
| Standard Deviation (Sample) | 1.8% | 8.9% |
| Standard Deviation (Population) | 1.8% | 8.8% |
Correlation Details
| Macedonian Percentile | Sample Size | College, Under 1 year |
[ 0.0% - 0.5% ] 0.016% | 75,267,436 | 67.2% |
[ 0.0% - 0.5% ] 0.065% | 26,230,453 | 65.7% |
[ 0.0% - 0.5% ] 0.098% | 11,893,769 | 68.5% |
[ 0.0% - 0.5% ] 0.14% | 4,493,827 | 69.6% |
[ 0.0% - 0.5% ] 0.18% | 4,070,360 | 68.0% |
[ 0.0% - 0.5% ] 0.22% | 2,080,252 | 68.6% |
[ 0.0% - 0.5% ] 0.27% | 1,372,668 | 71.5% |
[ 0.0% - 0.5% ] 0.31% | 740,394 | 69.7% |
[ 0.0% - 0.5% ] 0.35% | 996,090 | 70.1% |
[ 0.0% - 0.5% ] 0.39% | 960,676 | 69.4% |
[ 0.0% - 0.5% ] 0.43% | 364,376 | 72.1% |
[ 0.0% - 0.5% ] 0.47% | 389,295 | 71.3% |
[ 0.5% - 1.0% ] 0.51% | 438,912 | 67.2% |
[ 0.5% - 1.0% ] 0.56% | 315,771 | 63.1% |
[ 0.5% - 1.0% ] 0.60% | 326,051 | 66.9% |
[ 0.5% - 1.0% ] 0.64% | 181,308 | 72.5% |
[ 0.5% - 1.0% ] 0.67% | 224,835 | 67.8% |
[ 0.5% - 1.0% ] 0.72% | 235,931 | 70.8% |
[ 0.5% - 1.0% ] 0.76% | 255,661 | 67.4% |
[ 0.5% - 1.0% ] 0.79% | 168,940 | 72.6% |
[ 0.5% - 1.0% ] 0.84% | 255,629 | 64.1% |
[ 0.5% - 1.0% ] 0.88% | 109,285 | 66.4% |
[ 0.5% - 1.0% ] 0.93% | 60,671 | 72.7% |
[ 0.5% - 1.0% ] 0.97% | 42,014 | 58.5% |
[ 1.0% - 1.5% ] 1.02% | 28,606 | 72.0% |
[ 1.0% - 1.5% ] 1.04% | 143,414 | 66.1% |
[ 1.0% - 1.5% ] 1.11% | 34,403 | 71.7% |
[ 1.0% - 1.5% ] 1.12% | 47,066 | 64.2% |
[ 1.0% - 1.5% ] 1.19% | 72,719 | 88.5% |
[ 1.0% - 1.5% ] 1.22% | 124,005 | 68.0% |
[ 1.0% - 1.5% ] 1.24% | 81,951 | 76.8% |
[ 1.0% - 1.5% ] 1.29% | 41,610 | 60.1% |
[ 1.0% - 1.5% ] 1.32% | 4,151 | 75.1% |
[ 1.0% - 1.5% ] 1.37% | 62,047 | 68.1% |
[ 1.0% - 1.5% ] 1.42% | 13,778 | 63.5% |
[ 1.0% - 1.5% ] 1.46% | 54,704 | 66.6% |
[ 1.0% - 1.5% ] 1.50% | 14,072 | 79.2% |
[ 1.5% - 2.0% ] 1.59% | 119,716 | 66.0% |
[ 1.5% - 2.0% ] 1.63% | 24,333 | 66.5% |
[ 1.5% - 2.0% ] 1.67% | 1,017 | 50.3% |
[ 1.5% - 2.0% ] 1.69% | 7,219 | 63.8% |
[ 1.5% - 2.0% ] 1.81% | 39,823 | 68.2% |
[ 1.5% - 2.0% ] 1.87% | 7,763 | 71.3% |
[ 2.0% - 2.5% ] 2.00% | 950 | 47.0% |
[ 2.0% - 2.5% ] 2.05% | 536 | 68.3% |
[ 2.0% - 2.5% ] 2.07% | 19,956 | 81.3% |
[ 2.0% - 2.5% ] 2.16% | 3,282 | 91.1% |
[ 2.0% - 2.5% ] 2.20% | 4,137 | 72.3% |
[ 2.5% - 3.0% ] 2.52% | 32,193 | 72.9% |
[ 2.5% - 3.0% ] 2.57% | 5,185 | 51.0% |
[ 2.5% - 3.0% ] 2.62% | 458 | 52.1% |
[ 2.5% - 3.0% ] 2.69% | 42,522 | 57.2% |
[ 2.5% - 3.0% ] 2.84% | 705 | 45.4% |
[ 3.0% - 3.5% ] 3.06% | 7,329 | 68.6% |
[ 3.0% - 3.5% ] 3.36% | 5,118 | 68.3% |
[ 3.0% - 3.5% ] 3.41% | 323 | 75.4% |
[ 3.0% - 3.5% ] 3.47% | 2,999 | 76.9% |
[ 3.5% - 4.0% ] 3.57% | 64,944 | 45.2% |
[ 3.5% - 4.0% ] 3.64% | 21,806 | 65.6% |
[ 3.5% - 4.0% ] 3.72% | 6,322 | 67.9% |
[ 3.5% - 4.0% ] 3.99% | 4,993 | 65.9% |
[ 4.0% - 4.5% ] 4.14% | 266 | 48.6% |
[ 4.0% - 4.5% ] 4.16% | 409 | 71.6% |
[ 4.0% - 4.5% ] 4.49% | 2,363 | 64.1% |
[ 4.5% - 5.0% ] 4.74% | 20,310 | 66.7% |
[ 7.5% - 8.0% ] 7.97% | 1,041 | 70.1% |
[ 8.0% - 8.5% ] 8.07% | 1,301 | 81.9% |
[ 8.0% - 8.5% ] 8.23% | 158 | 83.3% |