Macedonian vs Native/Alaskan Married-Couple Family Poverty
COMPARE
Macedonian
Native/Alaskan
Married-Couple Family Poverty
Married-Couple Family Poverty Comparison
Macedonians
Natives/Alaskans
4.4%
MARRIED-COUPLE FAMILY POVERTY
99.4/ 100
METRIC RATING
65th/ 347
METRIC RANK
8.2%
MARRIED-COUPLE FAMILY POVERTY
0.0/ 100
METRIC RATING
329th/ 347
METRIC RANK
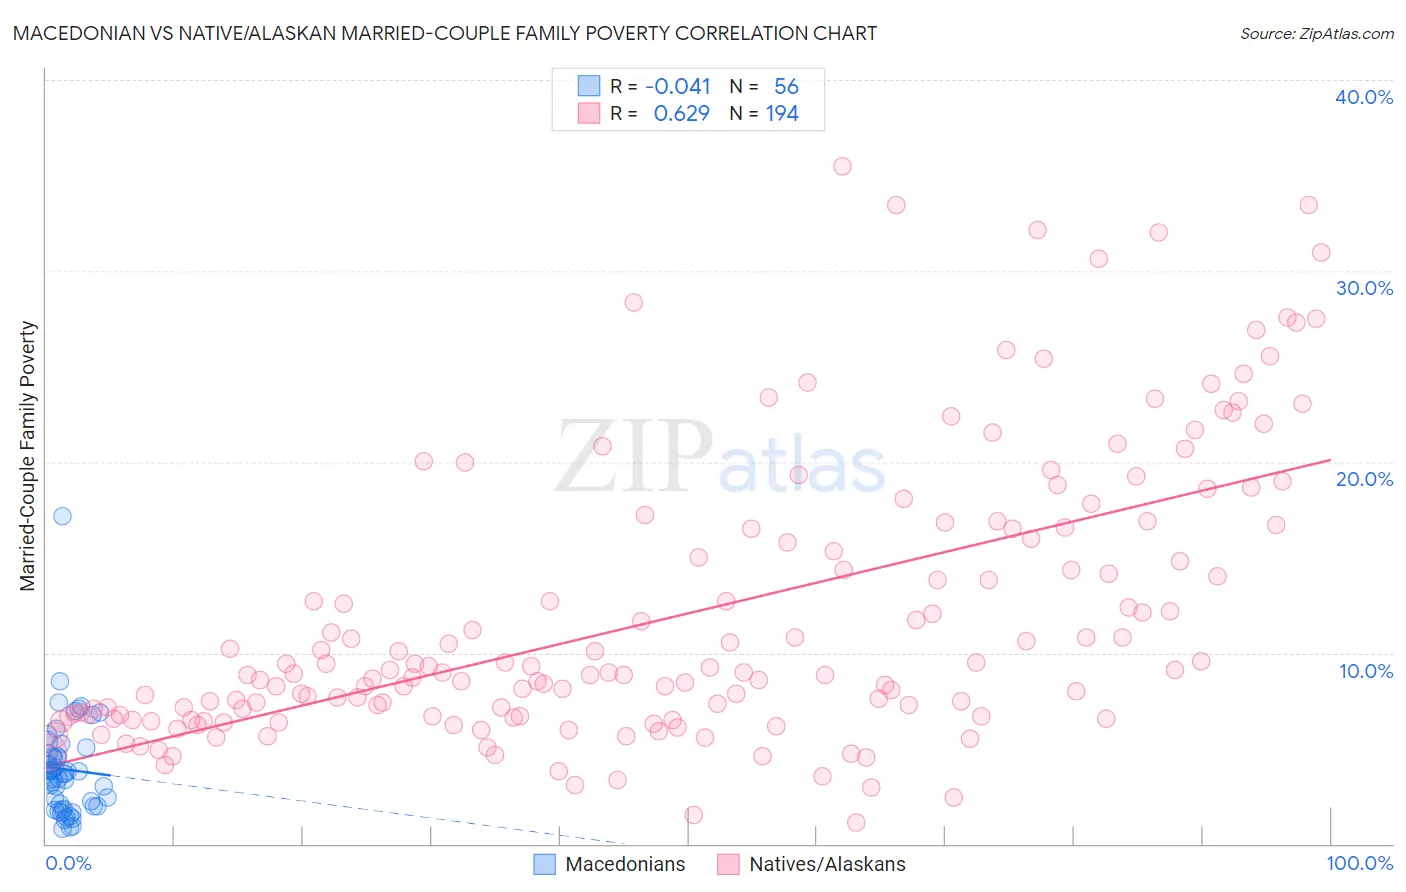
Macedonian vs Native/Alaskan Married-Couple Family Poverty Correlation Chart
The statistical analysis conducted on geographies consisting of 132,044,317 people shows no correlation between the proportion of Macedonians and poverty level among married-couple families in the United States with a correlation coefficient (R) of -0.041 and weighted average of 4.4%. Similarly, the statistical analysis conducted on geographies consisting of 506,148,611 people shows a significant positive correlation between the proportion of Natives/Alaskans and poverty level among married-couple families in the United States with a correlation coefficient (R) of 0.629 and weighted average of 8.2%, a difference of 84.6%.
Married-Couple Family Poverty Correlation Summary
| Measurement | Macedonian | Native/Alaskan |
| Minimum | 0.82% | 1.1% |
| Maximum | 17.2% | 35.5% |
| Range | 16.3% | 34.4% |
| Mean | 3.9% | 12.0% |
| Median | 3.7% | 9.0% |
| Interquartile 25% (IQ1) | 2.0% | 6.7% |
| Interquartile 75% (IQ3) | 4.7% | 16.5% |
| Interquartile Range (IQR) | 2.7% | 9.9% |
| Standard Deviation (Sample) | 2.6% | 7.4% |
| Standard Deviation (Population) | 2.6% | 7.4% |
Similar Demographics by Married-Couple Family Poverty
Demographics Similar to Macedonians by Married-Couple Family Poverty
In terms of married-couple family poverty, the demographic groups most similar to Macedonians are Immigrants from Serbia (4.4%, a difference of 0.13%), Immigrants from Canada (4.4%, a difference of 0.18%), Slavic (4.4%, a difference of 0.19%), New Zealander (4.4%, a difference of 0.20%), and Immigrants from Korea (4.5%, a difference of 0.34%).
| Demographics | Rating | Rank | Married-Couple Family Poverty |
| Czechoslovakians | 99.7 /100 | #58 | Exceptional 4.4% |
| Immigrants | Sweden | 99.6 /100 | #59 | Exceptional 4.4% |
| Tlingit-Haida | 99.6 /100 | #60 | Exceptional 4.4% |
| Okinawans | 99.6 /100 | #61 | Exceptional 4.4% |
| Immigrants | Australia | 99.6 /100 | #62 | Exceptional 4.4% |
| Immigrants | Sri Lanka | 99.6 /100 | #63 | Exceptional 4.4% |
| Immigrants | Bulgaria | 99.5 /100 | #64 | Exceptional 4.4% |
| Macedonians | 99.4 /100 | #65 | Exceptional 4.4% |
| Immigrants | Serbia | 99.4 /100 | #66 | Exceptional 4.4% |
| Immigrants | Canada | 99.4 /100 | #67 | Exceptional 4.4% |
| Slavs | 99.4 /100 | #68 | Exceptional 4.4% |
| New Zealanders | 99.4 /100 | #69 | Exceptional 4.4% |
| Immigrants | Korea | 99.4 /100 | #70 | Exceptional 4.5% |
| Immigrants | North America | 99.3 /100 | #71 | Exceptional 4.5% |
| Immigrants | England | 99.3 /100 | #72 | Exceptional 4.5% |
Demographics Similar to Natives/Alaskans by Married-Couple Family Poverty
In terms of married-couple family poverty, the demographic groups most similar to Natives/Alaskans are Paiute (8.3%, a difference of 1.3%), Central American Indian (8.3%, a difference of 1.3%), Dominican (8.3%, a difference of 1.4%), Lumbee (8.3%, a difference of 1.9%), and Immigrants from Dominican Republic (8.4%, a difference of 2.5%).
| Demographics | Rating | Rank | Married-Couple Family Poverty |
| Immigrants | Honduras | 0.0 /100 | #322 | Tragic 7.3% |
| Vietnamese | 0.0 /100 | #323 | Tragic 7.4% |
| Immigrants | Central America | 0.0 /100 | #324 | Tragic 7.4% |
| Immigrants | Cuba | 0.0 /100 | #325 | Tragic 7.5% |
| Immigrants | Bangladesh | 0.0 /100 | #326 | Tragic 7.5% |
| Hispanics or Latinos | 0.0 /100 | #327 | Tragic 7.5% |
| Immigrants | Mexico | 0.0 /100 | #328 | Tragic 7.6% |
| Natives/Alaskans | 0.0 /100 | #329 | Tragic 8.2% |
| Paiute | 0.0 /100 | #330 | Tragic 8.3% |
| Central American Indians | 0.0 /100 | #331 | Tragic 8.3% |
| Dominicans | 0.0 /100 | #332 | Tragic 8.3% |
| Lumbee | 0.0 /100 | #333 | Tragic 8.3% |
| Immigrants | Dominican Republic | 0.0 /100 | #334 | Tragic 8.4% |
| Sioux | 0.0 /100 | #335 | Tragic 8.7% |
| Apache | 0.0 /100 | #336 | Tragic 9.0% |