Macedonian GED/Equivalency
COMPARE
Macedonian
Select to Compare
GED/Equivalency
Macedonian GED/Equivalency
88.1%
GED/EQUIVALENCY
99.5/ 100
METRIC RATING
44th/ 347
METRIC RANK
Macedonian GED/Equivalency Correlation Chart
The statistical analysis conducted on geographies consisting of 132,657,099 people shows a mild positive correlation between the proportion of Macedonians and percentage of population with at least ged/equivalency education in the United States with a correlation coefficient (R) of 0.311 and weighted average of 88.1%. On average, for every 1% (one percent) increase in Macedonians within a typical geography, there is an increase of 0.72% in percentage of population with at least ged/equivalency education.
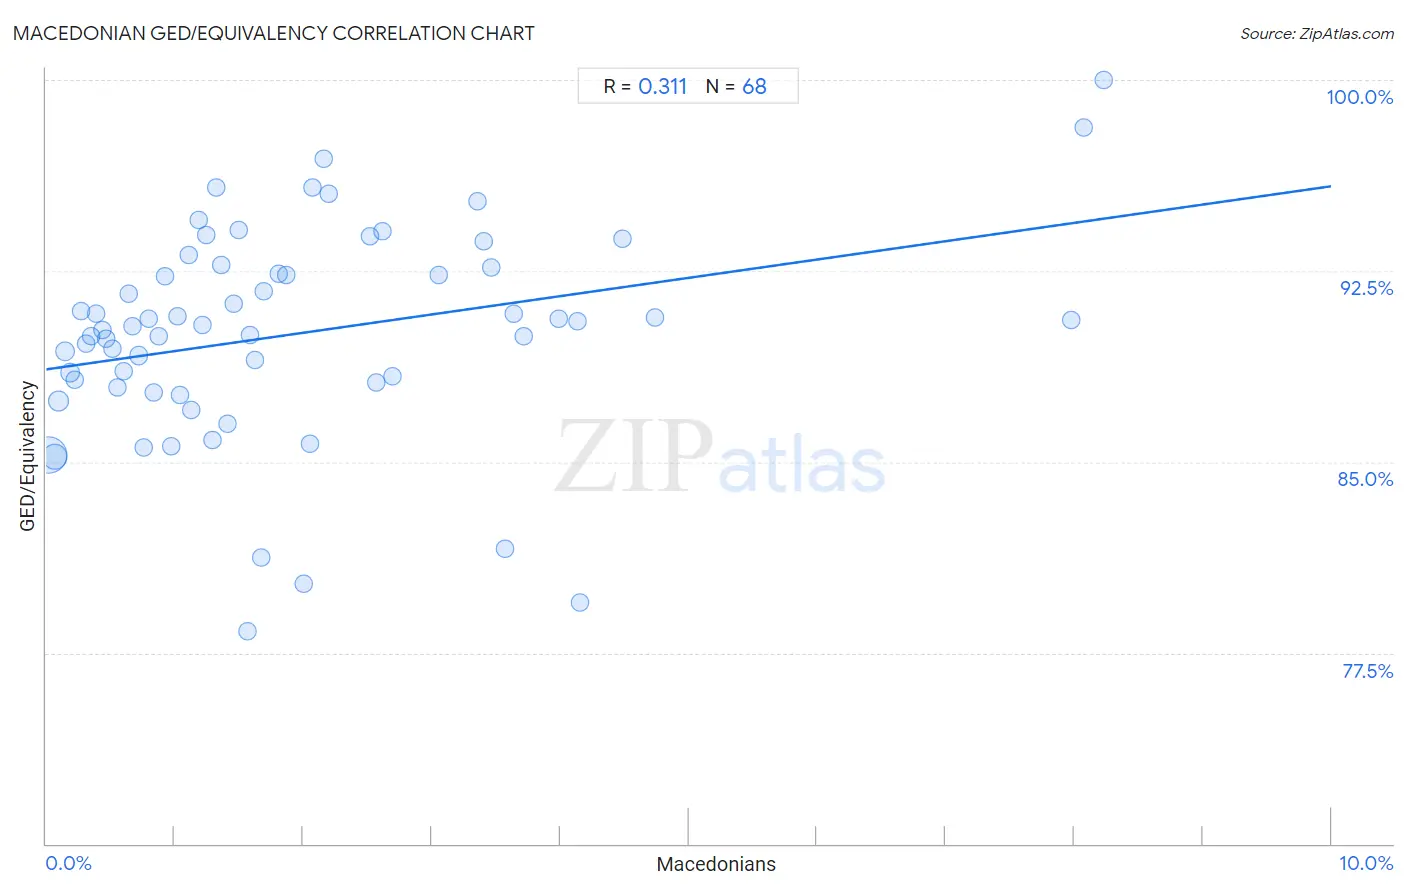
It is essential to understand that the correlation between the percentage of Macedonians and percentage of population with at least ged/equivalency education does not imply a direct cause-and-effect relationship. It remains uncertain whether the presence of Macedonians influences an upward or downward trend in the level of percentage of population with at least ged/equivalency education within an area, or if Macedonians simply ended up residing in those areas with higher or lower levels of percentage of population with at least ged/equivalency education due to other factors.
Demographics Similar to Macedonians by GED/Equivalency
In terms of ged/equivalency, the demographic groups most similar to Macedonians are Immigrants from Scotland (88.2%, a difference of 0.030%), Cambodian (88.2%, a difference of 0.040%), Czech (88.1%, a difference of 0.040%), Immigrants from Switzerland (88.1%, a difference of 0.050%), and Finnish (88.2%, a difference of 0.060%).
| Demographics | Rating | Rank | GED/Equivalency |
| Immigrants from Austria | 99.7 /100 | #37 | Exceptional 88.3% |
| Burmese | 99.7 /100 | #38 | Exceptional 88.3% |
| Immigrants from Israel | 99.6 /100 | #39 | Exceptional 88.2% |
| Italians | 99.6 /100 | #40 | Exceptional 88.2% |
| Finns | 99.6 /100 | #41 | Exceptional 88.2% |
| Cambodians | 99.6 /100 | #42 | Exceptional 88.2% |
| Immigrants from Scotland | 99.6 /100 | #43 | Exceptional 88.2% |
| Macedonians | 99.5 /100 | #44 | Exceptional 88.1% |
| Czechs | 99.5 /100 | #45 | Exceptional 88.1% |
| Immigrants from Switzerland | 99.5 /100 | #46 | Exceptional 88.1% |
| Immigrants from Latvia | 99.5 /100 | #47 | Exceptional 88.1% |
| Greeks | 99.5 /100 | #48 | Exceptional 88.1% |
| Australians | 99.5 /100 | #49 | Exceptional 88.1% |
| Immigrants from Korea | 99.5 /100 | #50 | Exceptional 88.1% |
| Immigrants from Netherlands | 99.4 /100 | #51 | Exceptional 88.0% |
Macedonian GED/Equivalency Correlation Summary
| Measurement | Macedonian Data | GED/Equivalency Data |
| Minimum | 0.016% | 78.4% |
| Maximum | 8.2% | 100.0% |
| Range | 8.2% | 21.6% |
| Mean | 1.9% | 90.0% |
| Median | 1.4% | 90.4% |
| Interquartile 25% (IQ1) | 0.70% | 88.0% |
| Interquartile 75% (IQ3) | 2.6% | 92.5% |
| Interquartile Range (IQR) | 1.9% | 4.5% |
| Standard Deviation (Sample) | 1.8% | 4.2% |
| Standard Deviation (Population) | 1.8% | 4.2% |
Correlation Details
| Macedonian Percentile | Sample Size | GED/Equivalency |
[ 0.0% - 0.5% ] 0.016% | 75,267,436 | 85.3% |
[ 0.0% - 0.5% ] 0.065% | 26,230,453 | 85.2% |
[ 0.0% - 0.5% ] 0.098% | 11,893,769 | 87.4% |
[ 0.0% - 0.5% ] 0.14% | 4,493,827 | 89.3% |
[ 0.0% - 0.5% ] 0.18% | 4,070,360 | 88.5% |
[ 0.0% - 0.5% ] 0.22% | 2,080,252 | 88.2% |
[ 0.0% - 0.5% ] 0.27% | 1,372,668 | 90.9% |
[ 0.0% - 0.5% ] 0.31% | 740,394 | 89.6% |
[ 0.0% - 0.5% ] 0.35% | 996,090 | 89.9% |
[ 0.0% - 0.5% ] 0.39% | 960,676 | 90.8% |
[ 0.0% - 0.5% ] 0.43% | 364,376 | 90.2% |
[ 0.0% - 0.5% ] 0.47% | 389,295 | 89.8% |
[ 0.5% - 1.0% ] 0.51% | 438,912 | 89.4% |
[ 0.5% - 1.0% ] 0.56% | 315,771 | 87.9% |
[ 0.5% - 1.0% ] 0.60% | 326,051 | 88.6% |
[ 0.5% - 1.0% ] 0.64% | 181,308 | 91.6% |
[ 0.5% - 1.0% ] 0.67% | 224,835 | 90.3% |
[ 0.5% - 1.0% ] 0.72% | 235,931 | 89.2% |
[ 0.5% - 1.0% ] 0.76% | 255,661 | 85.6% |
[ 0.5% - 1.0% ] 0.79% | 168,940 | 90.6% |
[ 0.5% - 1.0% ] 0.84% | 255,629 | 87.7% |
[ 0.5% - 1.0% ] 0.88% | 109,285 | 90.0% |
[ 0.5% - 1.0% ] 0.93% | 60,671 | 92.3% |
[ 0.5% - 1.0% ] 0.97% | 42,014 | 85.6% |
[ 1.0% - 1.5% ] 1.02% | 28,606 | 90.7% |
[ 1.0% - 1.5% ] 1.04% | 143,414 | 87.6% |
[ 1.0% - 1.5% ] 1.11% | 34,403 | 93.1% |
[ 1.0% - 1.5% ] 1.12% | 47,066 | 87.0% |
[ 1.0% - 1.5% ] 1.19% | 72,719 | 94.5% |
[ 1.0% - 1.5% ] 1.22% | 124,005 | 90.4% |
[ 1.0% - 1.5% ] 1.24% | 81,951 | 93.9% |
[ 1.0% - 1.5% ] 1.29% | 41,610 | 85.9% |
[ 1.0% - 1.5% ] 1.32% | 4,151 | 95.8% |
[ 1.0% - 1.5% ] 1.37% | 62,047 | 92.8% |
[ 1.0% - 1.5% ] 1.42% | 13,778 | 86.5% |
[ 1.0% - 1.5% ] 1.46% | 54,704 | 91.2% |
[ 1.0% - 1.5% ] 1.50% | 14,072 | 94.1% |
[ 1.5% - 2.0% ] 1.56% | 11,197 | 78.4% |
[ 1.5% - 2.0% ] 1.59% | 119,716 | 90.0% |
[ 1.5% - 2.0% ] 1.63% | 24,333 | 89.0% |
[ 1.5% - 2.0% ] 1.67% | 1,017 | 81.3% |
[ 1.5% - 2.0% ] 1.69% | 7,219 | 91.7% |
[ 1.5% - 2.0% ] 1.81% | 39,823 | 92.4% |
[ 1.5% - 2.0% ] 1.87% | 7,763 | 92.3% |
[ 2.0% - 2.5% ] 2.00% | 950 | 80.2% |
[ 2.0% - 2.5% ] 2.05% | 536 | 85.7% |
[ 2.0% - 2.5% ] 2.07% | 19,956 | 95.8% |
[ 2.0% - 2.5% ] 2.16% | 3,282 | 96.9% |
[ 2.0% - 2.5% ] 2.20% | 4,137 | 95.5% |
[ 2.5% - 3.0% ] 2.52% | 32,193 | 93.8% |
[ 2.5% - 3.0% ] 2.57% | 5,185 | 88.1% |
[ 2.5% - 3.0% ] 2.62% | 458 | 94.1% |
[ 2.5% - 3.0% ] 2.69% | 42,522 | 88.4% |
[ 3.0% - 3.5% ] 3.06% | 7,329 | 92.3% |
[ 3.0% - 3.5% ] 3.36% | 5,118 | 95.2% |
[ 3.0% - 3.5% ] 3.41% | 323 | 93.7% |
[ 3.0% - 3.5% ] 3.47% | 2,999 | 92.6% |
[ 3.5% - 4.0% ] 3.57% | 64,944 | 81.6% |
[ 3.5% - 4.0% ] 3.64% | 21,806 | 90.8% |
[ 3.5% - 4.0% ] 3.72% | 6,322 | 89.9% |
[ 3.5% - 4.0% ] 3.99% | 4,993 | 90.6% |
[ 4.0% - 4.5% ] 4.14% | 266 | 90.5% |
[ 4.0% - 4.5% ] 4.16% | 409 | 79.5% |
[ 4.0% - 4.5% ] 4.49% | 2,363 | 93.8% |
[ 4.5% - 5.0% ] 4.74% | 20,310 | 90.7% |
[ 7.5% - 8.0% ] 7.97% | 1,041 | 90.6% |
[ 8.0% - 8.5% ] 8.07% | 1,301 | 98.1% |
[ 8.0% - 8.5% ] 8.23% | 158 | 100.0% |