Macedonian Married-couple Households
COMPARE
Macedonian
Select to Compare
Married-couple Households
Macedonian Married-couple Households
47.6%
MARRIED-COUPLE HOUSEHOLDS
93.9/ 100
METRIC RATING
110th/ 347
METRIC RANK
Macedonian Married-couple Households Correlation Chart
The statistical analysis conducted on geographies consisting of 132,608,945 people shows a poor positive correlation between the proportion of Macedonians and percentage of married-couple family households in the United States with a correlation coefficient (R) of 0.111 and weighted average of 47.6%. On average, for every 1% (one percent) increase in Macedonians within a typical geography, there is an increase of 0.56% in percentage of married-couple family households.
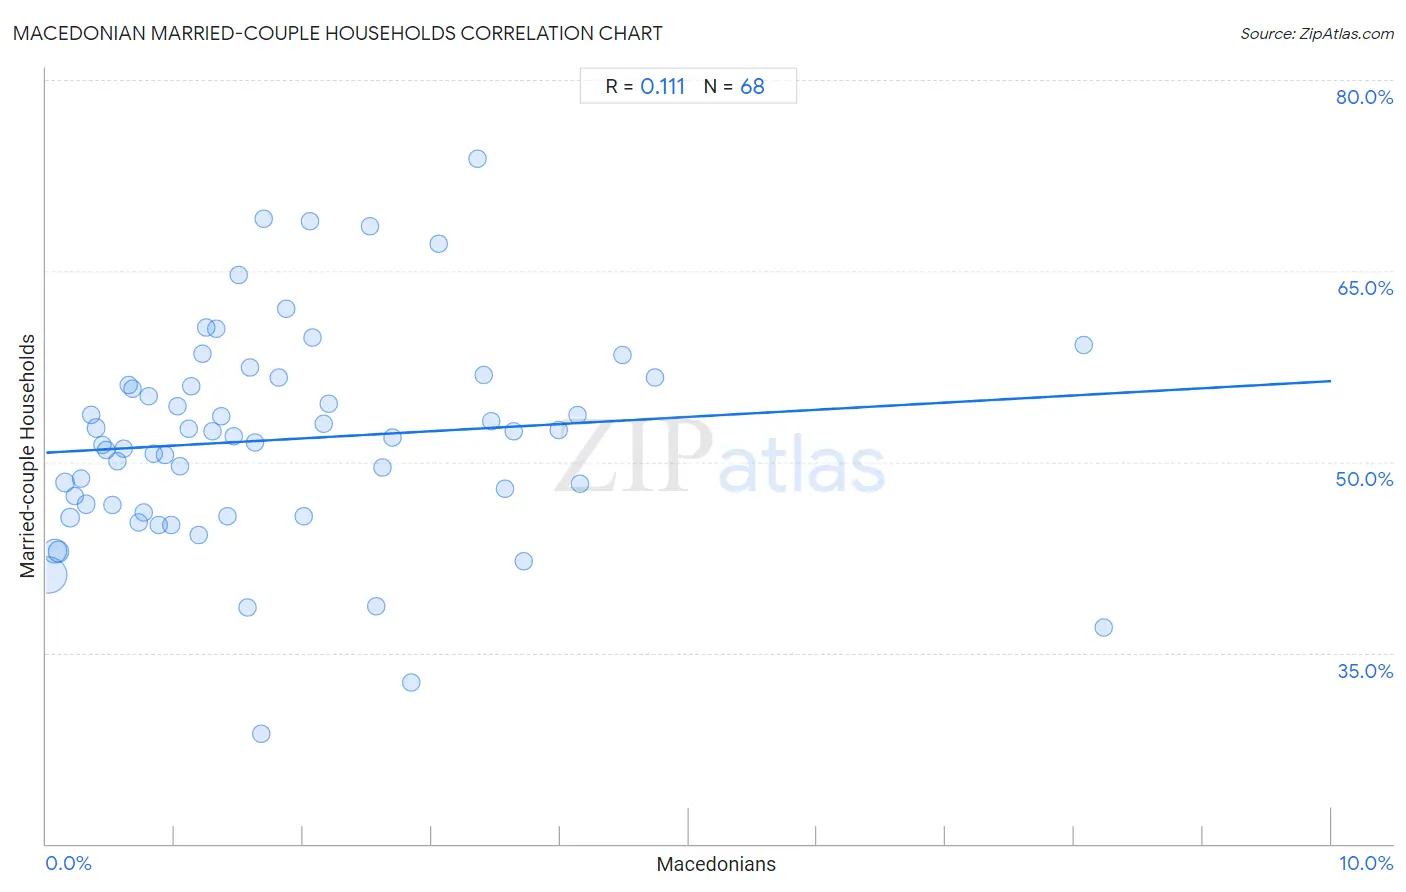
It is essential to understand that the correlation between the percentage of Macedonians and percentage of married-couple family households does not imply a direct cause-and-effect relationship. It remains uncertain whether the presence of Macedonians influences an upward or downward trend in the level of percentage of married-couple family households within an area, or if Macedonians simply ended up residing in those areas with higher or lower levels of percentage of married-couple family households due to other factors.
Demographics Similar to Macedonians by Married-couple Households
In terms of married-couple households, the demographic groups most similar to Macedonians are Syrian (47.6%, a difference of 0.0%), Immigrants from Jordan (47.7%, a difference of 0.020%), Peruvian (47.6%, a difference of 0.020%), Venezuelan (47.6%, a difference of 0.030%), and Immigrants from Europe (47.6%, a difference of 0.030%).
| Demographics | Rating | Rank | Married-couple Households |
| Hawaiians | 96.0 /100 | #103 | Exceptional 47.8% |
| Immigrants from South Africa | 96.0 /100 | #104 | Exceptional 47.8% |
| Immigrants from Czechoslovakia | 95.5 /100 | #105 | Exceptional 47.8% |
| Portuguese | 95.5 /100 | #106 | Exceptional 47.8% |
| Estonians | 94.7 /100 | #107 | Exceptional 47.7% |
| Immigrants from Japan | 94.4 /100 | #108 | Exceptional 47.7% |
| Immigrants from Jordan | 94.1 /100 | #109 | Exceptional 47.7% |
| Macedonians | 93.9 /100 | #110 | Exceptional 47.6% |
| Syrians | 93.9 /100 | #111 | Exceptional 47.6% |
| Peruvians | 93.8 /100 | #112 | Exceptional 47.6% |
| Venezuelans | 93.8 /100 | #113 | Exceptional 47.6% |
| Immigrants from Europe | 93.7 /100 | #114 | Exceptional 47.6% |
| Slovaks | 92.9 /100 | #115 | Exceptional 47.6% |
| Argentineans | 92.5 /100 | #116 | Exceptional 47.5% |
| French Canadians | 92.4 /100 | #117 | Exceptional 47.5% |
Macedonian Married-couple Households Correlation Summary
| Measurement | Macedonian Data | Married-couple Households Data |
| Minimum | 0.016% | 28.7% |
| Maximum | 8.2% | 73.8% |
| Range | 8.2% | 45.2% |
| Mean | 1.8% | 51.8% |
| Median | 1.4% | 52.0% |
| Interquartile 25% (IQ1) | 0.70% | 46.3% |
| Interquartile 75% (IQ3) | 2.6% | 56.3% |
| Interquartile Range (IQR) | 1.9% | 10.0% |
| Standard Deviation (Sample) | 1.7% | 8.4% |
| Standard Deviation (Population) | 1.6% | 8.3% |
Correlation Details
| Macedonian Percentile | Sample Size | Married-couple Households |
[ 0.0% - 0.5% ] 0.016% | 75,267,436 | 41.1% |
[ 0.0% - 0.5% ] 0.065% | 26,215,094 | 43.0% |
[ 0.0% - 0.5% ] 0.098% | 11,888,093 | 42.9% |
[ 0.0% - 0.5% ] 0.14% | 4,493,827 | 48.4% |
[ 0.0% - 0.5% ] 0.18% | 4,063,121 | 45.6% |
[ 0.0% - 0.5% ] 0.22% | 2,080,252 | 47.3% |
[ 0.0% - 0.5% ] 0.27% | 1,372,668 | 48.7% |
[ 0.0% - 0.5% ] 0.31% | 723,232 | 46.7% |
[ 0.0% - 0.5% ] 0.35% | 996,090 | 53.7% |
[ 0.0% - 0.5% ] 0.39% | 960,676 | 52.7% |
[ 0.0% - 0.5% ] 0.43% | 364,376 | 51.3% |
[ 0.0% - 0.5% ] 0.47% | 389,295 | 50.9% |
[ 0.5% - 1.0% ] 0.51% | 438,912 | 46.6% |
[ 0.5% - 1.0% ] 0.56% | 315,771 | 50.1% |
[ 0.5% - 1.0% ] 0.60% | 324,671 | 51.0% |
[ 0.5% - 1.0% ] 0.64% | 181,308 | 56.0% |
[ 0.5% - 1.0% ] 0.67% | 224,835 | 55.7% |
[ 0.5% - 1.0% ] 0.72% | 235,931 | 45.2% |
[ 0.5% - 1.0% ] 0.76% | 255,661 | 46.0% |
[ 0.5% - 1.0% ] 0.79% | 168,940 | 55.1% |
[ 0.5% - 1.0% ] 0.84% | 255,629 | 50.6% |
[ 0.5% - 1.0% ] 0.88% | 108,283 | 45.0% |
[ 0.5% - 1.0% ] 0.93% | 60,671 | 50.5% |
[ 0.5% - 1.0% ] 0.97% | 42,014 | 45.1% |
[ 1.0% - 1.5% ] 1.02% | 28,606 | 54.4% |
[ 1.0% - 1.5% ] 1.04% | 143,414 | 49.6% |
[ 1.0% - 1.5% ] 1.11% | 34,403 | 52.6% |
[ 1.0% - 1.5% ] 1.12% | 47,066 | 56.0% |
[ 1.0% - 1.5% ] 1.19% | 72,719 | 44.2% |
[ 1.0% - 1.5% ] 1.22% | 124,005 | 58.5% |
[ 1.0% - 1.5% ] 1.24% | 81,951 | 60.5% |
[ 1.0% - 1.5% ] 1.29% | 41,610 | 52.4% |
[ 1.0% - 1.5% ] 1.32% | 4,151 | 60.4% |
[ 1.0% - 1.5% ] 1.37% | 62,047 | 53.6% |
[ 1.0% - 1.5% ] 1.42% | 13,778 | 45.7% |
[ 1.0% - 1.5% ] 1.46% | 54,704 | 52.0% |
[ 1.0% - 1.5% ] 1.50% | 14,072 | 64.7% |
[ 1.5% - 2.0% ] 1.56% | 11,197 | 38.6% |
[ 1.5% - 2.0% ] 1.59% | 119,716 | 57.5% |
[ 1.5% - 2.0% ] 1.63% | 24,333 | 51.5% |
[ 1.5% - 2.0% ] 1.67% | 1,017 | 28.7% |
[ 1.5% - 2.0% ] 1.69% | 7,219 | 69.1% |
[ 1.5% - 2.0% ] 1.81% | 39,823 | 56.7% |
[ 1.5% - 2.0% ] 1.87% | 7,763 | 62.0% |
[ 2.0% - 2.5% ] 2.00% | 950 | 45.7% |
[ 2.0% - 2.5% ] 2.05% | 536 | 68.9% |
[ 2.0% - 2.5% ] 2.07% | 19,956 | 59.7% |
[ 2.0% - 2.5% ] 2.16% | 3,282 | 53.0% |
[ 2.0% - 2.5% ] 2.20% | 4,137 | 54.6% |
[ 2.5% - 3.0% ] 2.52% | 32,193 | 68.6% |
[ 2.5% - 3.0% ] 2.57% | 5,185 | 38.7% |
[ 2.5% - 3.0% ] 2.62% | 458 | 49.5% |
[ 2.5% - 3.0% ] 2.69% | 42,522 | 51.9% |
[ 2.5% - 3.0% ] 2.84% | 705 | 32.7% |
[ 3.0% - 3.5% ] 3.06% | 7,329 | 67.1% |
[ 3.0% - 3.5% ] 3.36% | 5,118 | 73.8% |
[ 3.0% - 3.5% ] 3.41% | 323 | 56.8% |
[ 3.0% - 3.5% ] 3.47% | 2,999 | 53.2% |
[ 3.5% - 4.0% ] 3.57% | 64,944 | 47.9% |
[ 3.5% - 4.0% ] 3.64% | 21,806 | 52.4% |
[ 3.5% - 4.0% ] 3.72% | 6,322 | 42.2% |
[ 3.5% - 4.0% ] 3.99% | 4,993 | 52.5% |
[ 4.0% - 4.5% ] 4.14% | 266 | 53.7% |
[ 4.0% - 4.5% ] 4.16% | 409 | 48.2% |
[ 4.0% - 4.5% ] 4.49% | 2,363 | 58.4% |
[ 4.5% - 5.0% ] 4.74% | 20,310 | 56.6% |
[ 8.0% - 8.5% ] 8.07% | 1,301 | 59.2% |
[ 8.0% - 8.5% ] 8.23% | 158 | 37.0% |