Macedonian Male Disability
COMPARE
Macedonian
Select to Compare
Male Disability
Macedonian Male Disability
11.0%
DISABILITY | MALES
84.2/ 100
METRIC RATING
131st/ 347
METRIC RANK
Macedonian Male Disability Correlation Chart
The statistical analysis conducted on geographies consisting of 132,656,892 people shows a weak negative correlation between the proportion of Macedonians and percentage of males with a disability in the United States with a correlation coefficient (R) of -0.262 and weighted average of 11.0%. On average, for every 1% (one percent) increase in Macedonians within a typical geography, there is a decrease of 0.48% in percentage of males with a disability.
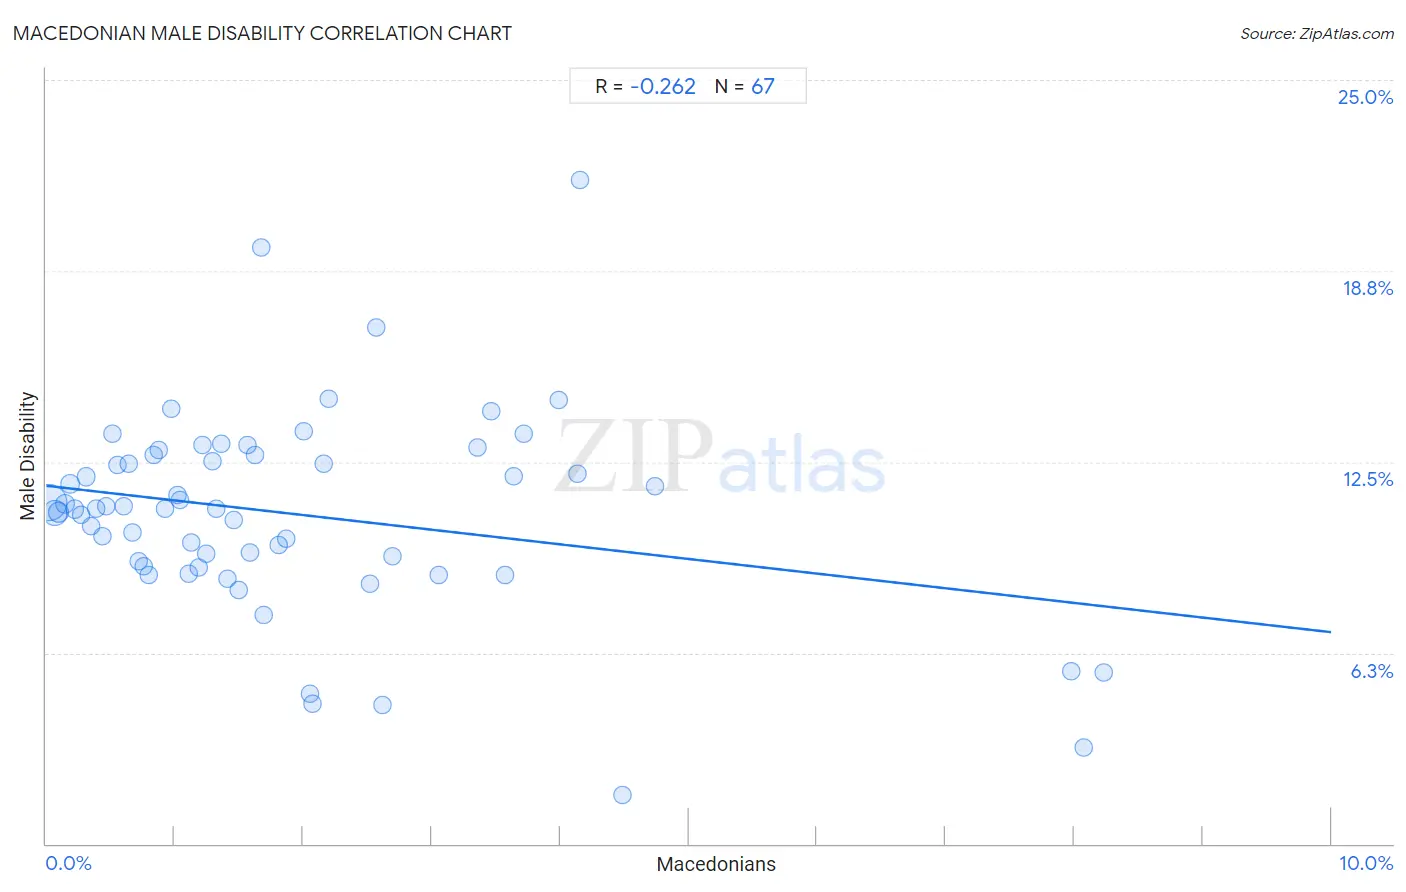
It is essential to understand that the correlation between the percentage of Macedonians and percentage of males with a disability does not imply a direct cause-and-effect relationship. It remains uncertain whether the presence of Macedonians influences an upward or downward trend in the level of percentage of males with a disability within an area, or if Macedonians simply ended up residing in those areas with higher or lower levels of percentage of males with a disability due to other factors.
Demographics Similar to Macedonians by Male Disability
In terms of male disability, the demographic groups most similar to Macedonians are Immigrants from Fiji (11.0%, a difference of 0.020%), Ugandan (11.0%, a difference of 0.030%), Bhutanese (11.0%, a difference of 0.080%), Trinidadian and Tobagonian (11.0%, a difference of 0.10%), and Immigrants from Latvia (10.9%, a difference of 0.14%).
| Demographics | Rating | Rank | Male Disability |
| South American Indians | 88.1 /100 | #124 | Excellent 10.9% |
| Immigrants from North Macedonia | 88.1 /100 | #125 | Excellent 10.9% |
| Immigrants from Trinidad and Tobago | 86.9 /100 | #126 | Excellent 10.9% |
| Immigrants from Ukraine | 86.8 /100 | #127 | Excellent 10.9% |
| Immigrants from Latvia | 85.5 /100 | #128 | Excellent 10.9% |
| Immigrants from Philippines | 85.4 /100 | #129 | Excellent 10.9% |
| Brazilians | 85.4 /100 | #130 | Excellent 10.9% |
| Macedonians | 84.2 /100 | #131 | Excellent 11.0% |
| Immigrants from Fiji | 84.0 /100 | #132 | Excellent 11.0% |
| Ugandans | 83.9 /100 | #133 | Excellent 11.0% |
| Bhutanese | 83.4 /100 | #134 | Excellent 11.0% |
| Trinidadians and Tobagonians | 83.3 /100 | #135 | Excellent 11.0% |
| Immigrants from Costa Rica | 82.8 /100 | #136 | Excellent 11.0% |
| Immigrants from Europe | 82.0 /100 | #137 | Excellent 11.0% |
| Nigerians | 81.9 /100 | #138 | Excellent 11.0% |
Macedonian Male Disability Correlation Summary
| Measurement | Macedonian Data | Male Disability Data |
| Minimum | 0.016% | 1.6% |
| Maximum | 8.2% | 21.7% |
| Range | 8.2% | 20.1% |
| Mean | 1.9% | 10.8% |
| Median | 1.4% | 11.0% |
| Interquartile 25% (IQ1) | 0.67% | 9.1% |
| Interquartile 75% (IQ3) | 2.6% | 12.7% |
| Interquartile Range (IQR) | 1.9% | 3.6% |
| Standard Deviation (Sample) | 1.8% | 3.3% |
| Standard Deviation (Population) | 1.8% | 3.3% |
Correlation Details
| Macedonian Percentile | Sample Size | Male Disability |
[ 0.0% - 0.5% ] 0.016% | 75,267,436 | 11.2% |
[ 0.0% - 0.5% ] 0.065% | 26,230,453 | 10.8% |
[ 0.0% - 0.5% ] 0.098% | 11,893,769 | 10.8% |
[ 0.0% - 0.5% ] 0.14% | 4,493,827 | 11.1% |
[ 0.0% - 0.5% ] 0.18% | 4,070,360 | 11.8% |
[ 0.0% - 0.5% ] 0.22% | 2,078,163 | 11.0% |
[ 0.0% - 0.5% ] 0.27% | 1,372,668 | 10.8% |
[ 0.0% - 0.5% ] 0.31% | 740,394 | 12.0% |
[ 0.0% - 0.5% ] 0.35% | 998,637 | 10.4% |
[ 0.0% - 0.5% ] 0.39% | 960,676 | 11.0% |
[ 0.0% - 0.5% ] 0.43% | 364,376 | 10.1% |
[ 0.0% - 0.5% ] 0.47% | 389,295 | 11.1% |
[ 0.5% - 1.0% ] 0.51% | 438,912 | 13.4% |
[ 0.5% - 1.0% ] 0.56% | 315,771 | 12.4% |
[ 0.5% - 1.0% ] 0.60% | 325,709 | 11.0% |
[ 0.5% - 1.0% ] 0.64% | 181,308 | 12.4% |
[ 0.5% - 1.0% ] 0.67% | 224,835 | 10.2% |
[ 0.5% - 1.0% ] 0.72% | 235,931 | 9.2% |
[ 0.5% - 1.0% ] 0.76% | 255,661 | 9.1% |
[ 0.5% - 1.0% ] 0.79% | 168,940 | 8.8% |
[ 0.5% - 1.0% ] 0.84% | 255,629 | 12.7% |
[ 0.5% - 1.0% ] 0.88% | 109,285 | 12.9% |
[ 0.5% - 1.0% ] 0.93% | 60,671 | 11.0% |
[ 0.5% - 1.0% ] 0.97% | 42,014 | 14.2% |
[ 1.0% - 1.5% ] 1.02% | 28,606 | 11.4% |
[ 1.0% - 1.5% ] 1.04% | 143,414 | 11.2% |
[ 1.0% - 1.5% ] 1.11% | 34,403 | 8.8% |
[ 1.0% - 1.5% ] 1.12% | 47,066 | 9.9% |
[ 1.0% - 1.5% ] 1.19% | 72,719 | 9.0% |
[ 1.0% - 1.5% ] 1.22% | 124,005 | 13.0% |
[ 1.0% - 1.5% ] 1.24% | 81,951 | 9.5% |
[ 1.0% - 1.5% ] 1.29% | 41,610 | 12.5% |
[ 1.0% - 1.5% ] 1.32% | 4,151 | 11.0% |
[ 1.0% - 1.5% ] 1.37% | 62,047 | 13.1% |
[ 1.0% - 1.5% ] 1.42% | 13,778 | 8.7% |
[ 1.0% - 1.5% ] 1.46% | 54,704 | 10.6% |
[ 1.0% - 1.5% ] 1.50% | 14,072 | 8.3% |
[ 1.5% - 2.0% ] 1.56% | 11,197 | 13.0% |
[ 1.5% - 2.0% ] 1.59% | 119,716 | 9.5% |
[ 1.5% - 2.0% ] 1.63% | 24,333 | 12.7% |
[ 1.5% - 2.0% ] 1.67% | 1,017 | 19.5% |
[ 1.5% - 2.0% ] 1.69% | 7,219 | 7.5% |
[ 1.5% - 2.0% ] 1.81% | 39,823 | 9.8% |
[ 1.5% - 2.0% ] 1.87% | 7,763 | 10.0% |
[ 2.0% - 2.5% ] 2.00% | 950 | 13.5% |
[ 2.0% - 2.5% ] 2.05% | 536 | 4.9% |
[ 2.0% - 2.5% ] 2.07% | 19,956 | 4.6% |
[ 2.0% - 2.5% ] 2.16% | 3,282 | 12.4% |
[ 2.0% - 2.5% ] 2.20% | 4,137 | 14.6% |
[ 2.5% - 3.0% ] 2.52% | 32,193 | 8.5% |
[ 2.5% - 3.0% ] 2.57% | 5,185 | 16.9% |
[ 2.5% - 3.0% ] 2.62% | 458 | 4.5% |
[ 2.5% - 3.0% ] 2.69% | 42,522 | 9.4% |
[ 3.0% - 3.5% ] 3.06% | 7,329 | 8.8% |
[ 3.0% - 3.5% ] 3.36% | 5,118 | 13.0% |
[ 3.0% - 3.5% ] 3.47% | 2,999 | 14.2% |
[ 3.5% - 4.0% ] 3.57% | 64,944 | 8.8% |
[ 3.5% - 4.0% ] 3.64% | 21,806 | 12.0% |
[ 3.5% - 4.0% ] 3.72% | 6,322 | 13.4% |
[ 3.5% - 4.0% ] 3.99% | 4,993 | 14.5% |
[ 4.0% - 4.5% ] 4.14% | 266 | 12.1% |
[ 4.0% - 4.5% ] 4.16% | 409 | 21.7% |
[ 4.0% - 4.5% ] 4.49% | 2,363 | 1.6% |
[ 4.5% - 5.0% ] 4.74% | 20,310 | 11.7% |
[ 7.5% - 8.0% ] 7.97% | 1,041 | 5.7% |
[ 8.0% - 8.5% ] 8.07% | 1,301 | 3.1% |
[ 8.0% - 8.5% ] 8.23% | 158 | 5.6% |