Immigrants from Ukraine Disability Age 5 to 17

COMPARE

Immigrants from Ukraine
Race
Ancestry
AfghanAfricanAlaska NativeAlaskan AthabascanAlbanianAleutAlsatianAmericanApacheArabArapahoArgentineanArmenianAssyrian/Chaldean/SyriacAustralianAustrianBahamianBangladeshiBarbadianBasqueBelgianBelizeanBermudanBhutaneseBlackfeetBolivianBrazilianBritishBritish West IndianBulgarianBurmeseCajunCambodianCanadianCape VerdeanCarpatho RusynCelticCentral AmericanCentral American IndianCherokeeCheyenneChickasawChileanChineseChippewaChoctawColombianColvilleComancheCosta RicanCreeCreekCroatianCrowCubanCypriotCzechCzechoslovakianDanishDelawareDominicanDutchDutch West IndianEastern EuropeanEcuadorianEgyptianEnglishEstonianEthiopianEuropeanFijianFilipinoFinnishFrenchFrench American IndianFrench CanadianGermanGerman RussianGhanaianGreekGuamanian/ChamorroGuatemalanGuyaneseHaitianHmongHonduranHopiHoumaHungarianIcelanderIndian (Asian)IndonesianInupiatIranianIraqiIrishIroquoisIsraeliItalianJamaicanJapaneseJordanianKenyanKiowaKoreanLaotianLatvianLebaneseLiberianLithuanianLumbeeLuxembourgerMacedonianMalaysianMalteseMarshalleseMenomineeMexicanMexican American IndianMongolianMoroccanNative HawaiianNavajoNepaleseNew ZealanderNicaraguanNigerianNorthern EuropeanNorwegianOkinawanOsageOttawaPaiutePakistaniPalestinianPanamanianParaguayanPennsylvania GermanPeruvianPimaPolishPortuguesePotawatomiPuebloPuerto RicanPuget Sound SalishRomanianRussianSalvadoranSamoanScandinavianScotch-IrishScottishSeminoleSenegaleseSerbianShoshoneSierra LeoneanSiouxSlavicSlovakSloveneSomaliSouth AfricanSouth AmericanSouth American IndianSoviet UnionSpaniardSpanishSpanish AmericanSpanish American IndianSri LankanSubsaharan AfricanSudaneseSwedishSwissSyrianTaiwaneseThaiTlingit-HaidaTohono O'OdhamTonganTrinidadian and TobagonianTsimshianTurkishU.S. Virgin IslanderUgandanUkrainianUruguayanUteVenezuelanVietnameseWelshWest IndianYakamaYaquiYugoslavianYumanYup'ikZimbabwean
Immigration
NonimmigrantsImmigrantsAfghanistanAfricaAlbaniaArgentinaArmeniaAsiaAustraliaAustriaBahamasBangladeshBarbadosBelarusBelgiumBelizeBoliviaBosnia and HerzegovinaBrazilBulgariaBurma/MyanmarCabo VerdeCambodiaCameroonCanadaCaribbeanCentral AmericaChileChinaColombiaCongoCosta RicaCroatiaCubaCzechoslovakiaDenmarkDominicaDominican RepublicEastern AfricaEastern AsiaEastern EuropeEcuadorEgyptEl SalvadorEnglandEritreaEthiopiaEuropeFijiFranceGermanyGhanaGreeceGrenadaGuatemalaGuyanaHaitiHondurasHong KongHungaryIndiaIndonesiaIranIraqIrelandIsraelItalyJamaicaJapanJordanKazakhstanKenyaKoreaKuwaitLaosLatin AmericaLatviaLebanonLiberiaLithuaniaMalaysiaMexicoMicronesiaMiddle AfricaMoldovaMoroccoNepalNetherlandsNicaraguaNigeriaNorth AmericaNorth MacedoniaNorthern AfricaNorthern EuropeNorwayOceaniaPakistanPanamaPeruPhilippinesPolandPortugalRomaniaRussiaSaudi ArabiaScotlandSenegalSerbiaSierra LeoneSingaporeSomaliaSouth AfricaSouth AmericaSouth Central AsiaSouth Eastern AsiaSouthern EuropeSpainSri LankaSt. Vincent and the GrenadinesSudanSwedenSwitzerlandSyriaTaiwanThailandTrinidad and TobagoTurkeyUgandaUkraineUruguayUzbekistanVenezuelaVietnamWest IndiesWestern AfricaWestern AsiaWestern EuropeYemenZaireZimbabweAzores
Select to Compare
Race
Ancestry
AfghanAfricanAlaska NativeAlaskan AthabascanAlbanianAleutAlsatianAmericanApacheArabArapahoArgentineanArmenianAssyrian/Chaldean/SyriacAustralianAustrianBahamianBangladeshiBarbadianBasqueBelgianBelizeanBermudanBhutaneseBlackfeetBolivianBrazilianBritishBritish West IndianBulgarianBurmeseCajunCambodianCanadianCape VerdeanCarpatho RusynCelticCentral AmericanCentral American IndianCherokeeCheyenneChickasawChileanChineseChippewaChoctawColombianColvilleComancheCosta RicanCreeCreekCroatianCrowCubanCypriotCzechCzechoslovakianDanishDelawareDominicanDutchDutch West IndianEastern EuropeanEcuadorianEgyptianEnglishEstonianEthiopianEuropeanFijianFilipinoFinnishFrenchFrench American IndianFrench CanadianGermanGerman RussianGhanaianGreekGuamanian/ChamorroGuatemalanGuyaneseHaitianHmongHonduranHopiHoumaHungarianIcelanderIndian (Asian)IndonesianInupiatIranianIraqiIrishIroquoisIsraeliItalianJamaicanJapaneseJordanianKenyanKiowaKoreanLaotianLatvianLebaneseLiberianLithuanianLumbeeLuxembourgerMacedonianMalaysianMalteseMarshalleseMenomineeMexicanMexican American IndianMongolianMoroccanNative HawaiianNavajoNepaleseNew ZealanderNicaraguanNigerianNorthern EuropeanNorwegianOkinawanOsageOttawaPaiutePakistaniPalestinianPanamanianParaguayanPennsylvania GermanPeruvianPimaPolishPortuguesePotawatomiPuebloPuerto RicanPuget Sound SalishRomanianRussianSalvadoranSamoanScandinavianScotch-IrishScottishSeminoleSenegaleseSerbianShoshoneSierra LeoneanSiouxSlavicSlovakSloveneSomaliSouth AfricanSouth AmericanSouth American IndianSoviet UnionSpaniardSpanishSpanish AmericanSpanish American IndianSri LankanSubsaharan AfricanSudaneseSwedishSwissSyrianTaiwaneseThaiTlingit-HaidaTohono O'OdhamTonganTrinidadian and TobagonianTsimshianTurkishU.S. Virgin IslanderUgandanUkrainianUruguayanUteVenezuelanVietnameseWelshWest IndianYakamaYaquiYugoslavianYumanYup'ikZimbabwean
Immigration
NonimmigrantsImmigrantsAfghanistanAfricaAlbaniaArgentinaArmeniaAsiaAustraliaAustriaBahamasBangladeshBarbadosBelarusBelgiumBelizeBoliviaBosnia and HerzegovinaBrazilBulgariaBurma/MyanmarCabo VerdeCambodiaCameroonCanadaCaribbeanCentral AmericaChileChinaColombiaCongoCosta RicaCroatiaCubaCzechoslovakiaDenmarkDominicaDominican RepublicEastern AfricaEastern AsiaEastern EuropeEcuadorEgyptEl SalvadorEnglandEritreaEthiopiaEuropeFijiFranceGermanyGhanaGreeceGrenadaGuatemalaGuyanaHaitiHondurasHong KongHungaryIndiaIndonesiaIranIraqIrelandIsraelItalyJamaicaJapanJordanKazakhstanKenyaKoreaKuwaitLaosLatin AmericaLatviaLebanonLiberiaLithuaniaMalaysiaMexicoMicronesiaMiddle AfricaMoldovaMoroccoNepalNetherlandsNicaraguaNigeriaNorth AmericaNorth MacedoniaNorthern AfricaNorthern EuropeNorwayOceaniaPakistanPanamaPeruPhilippinesPolandPortugalRomaniaRussiaSaudi ArabiaScotlandSenegalSerbiaSierra LeoneSingaporeSomaliaSouth AfricaSouth AmericaSouth Central AsiaSouth Eastern AsiaSouthern EuropeSpainSri LankaSt. Vincent and the GrenadinesSudanSwedenSwitzerlandSyriaTaiwanThailandTrinidad and TobagoTurkeyUgandaUruguayUzbekistanVenezuelaVietnamWest IndiesWestern AfricaWestern AsiaWestern EuropeYemenZaireZimbabweAzores
Disability Age 5 to 17
Income
Poverty
Unemployment
Labor Participation
Family Structure
Vehicle Availability
Education Level
Disability

Immigrants from Ukraine Disability Age 5 to 17
Exceptional

5.1%
DISABILITY | AGE 5 TO 17
99.9/ 100
METRIC RATING
58th/ 347
METRIC RANK

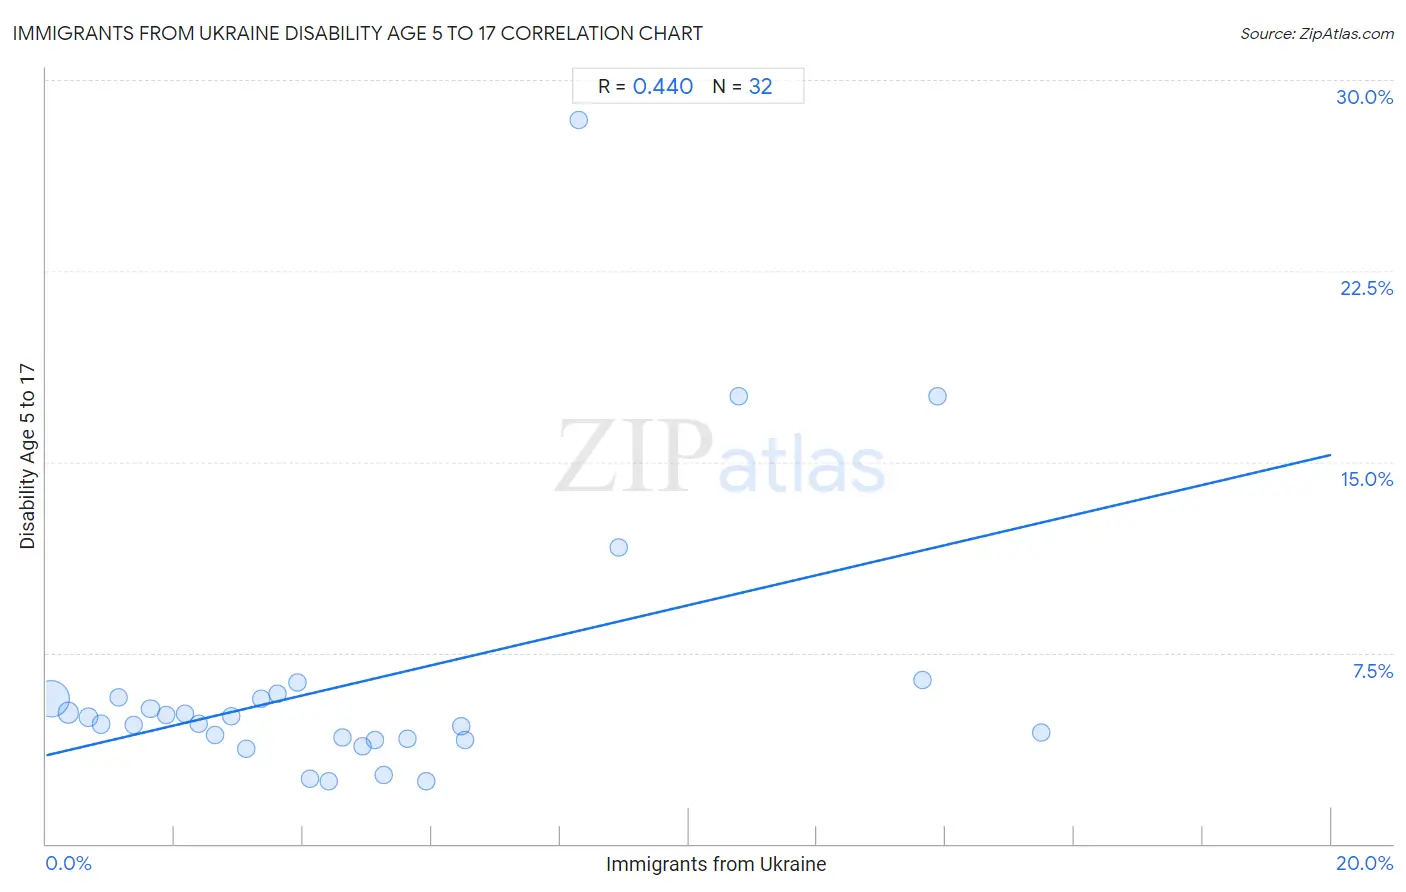
Immigrants from Ukraine Disability Age 5 to 17 Correlation Chart

The statistical analysis conducted on geographies consisting of 287,818,233 people shows a moderate positive correlation between the proportion of Immigrants from Ukraine and percentage of population with a disability between the ages 5 and 17 in the United States with a correlation coefficient (R) of 0.440 and weighted average of 5.1%. On average, for every 1% (one percent) increase in Immigrants from Ukraine within a typical geography, there is an increase of 0.59% in percentage of population with a disability between the ages 5 and 17.
Immigrants from Ukraine Disability Age 5 to 17
It is essential to understand that the correlation between the percentage of Immigrants from Ukraine and percentage of population with a disability between the ages 5 and 17 does not imply a direct cause-and-effect relationship. It remains uncertain whether the presence of Immigrants from Ukraine influences an upward or downward trend in the level of percentage of population with a disability between the ages 5 and 17 within an area, or if Immigrants from Ukraine simply ended up residing in those areas with higher or lower levels of percentage of population with a disability between the ages 5 and 17 due to other factors.

Demographics Similar to Immigrants from Ukraine by Disability Age 5 to 17

In terms of disability age 5 to 17, the demographic groups most similar to Immigrants from Ukraine are Immigrants from Poland (5.1%, a difference of 0.090%), Immigrants from North Macedonia (5.1%, a difference of 0.18%), Immigrants from Turkey (5.1%, a difference of 0.23%), Laotian (5.1%, a difference of 0.24%), and Paraguayan (5.1%, a difference of 0.29%).
DemographicsRating | RankDisability Age 5 to 17
Turks
99.9
/100
|
#51
Exceptional
5.1%
Immigrants from Fiji
99.9
/100
|
#52
Exceptional
5.1%
Immigrants from Lithuania
99.9
/100
|
#53
Exceptional
5.1%
Paraguayans
99.9
/100
|
#54
Exceptional
5.1%
Laotians
99.9
/100
|
#55
Exceptional
5.1%
Immigrants from Turkey
99.9
/100
|
#56
Exceptional
5.1%
Immigrants from Poland
99.9
/100
|
#57
Exceptional
5.1%
Immigrants from Ukraine
99.9
/100
|
#58
Exceptional
5.1%
Immigrants from North Macedonia
99.9
/100
|
#59
Exceptional
5.1%
Immigrants from Eastern Europe
99.9
/100
|
#60
Exceptional
5.1%
Immigrants from Switzerland
99.8
/100
|
#61
Exceptional
5.2%
Immigrants from Ireland
99.8
/100
|
#62
Exceptional
5.2%
Immigrants from Bangladesh
99.8
/100
|
#63
Exceptional
5.2%
Immigrants from South Eastern Asia
99.8
/100
|
#64
Exceptional
5.2%
Immigrants from Greece
99.8
/100
|
#65
Exceptional
5.2%

Immigrants from Ukraine Disability Age 5 to 17 Correlation Summary

MeasurementImmigrants from Ukraine DataDisability Age 5 to 17 Data
Minimum0.080%2.4%
Maximum15.5%28.4%
Range15.4%26.0%
Mean4.9%6.3%
Median4.0%4.9%
Interquartile 25% (IQ1)2.0%4.1%
Interquartile 75% (IQ3)6.2%5.7%
Interquartile Range (IQR)4.2%1.6%
Standard Deviation (Sample)4.0%5.4%
Standard Deviation (Population)3.9%5.3%

Correlation Details

Immigrants from Ukraine PercentileSample SizeDisability Age 5 to 17
[
0.0%
-
0.5%
]
0.080%
215,158,3145.7%
[
0.0%
-
0.5%
]
0.35%
37,795,5155.2%
[
0.5%
-
1.0%
]
0.66%
20,207,7745.0%
[
0.5%
-
1.0%
]
0.86%
4,203,5654.7%
[
1.0%
-
1.5%
]
1.12%
3,183,8745.7%
[
1.0%
-
1.5%
]
1.37%
1,531,5224.6%
[
1.5%
-
2.0%
]
1.62%
1,351,7075.3%
[
1.5%
-
2.0%
]
1.88%
1,066,2785.1%
[
2.0%
-
2.5%
]
2.16%
582,7325.1%
[
2.0%
-
2.5%
]
2.37%
481,3424.7%
[
2.5%
-
3.0%
]
2.62%
323,4844.3%
[
2.5%
-
3.0%
]
2.89%
215,2585.0%
[
3.0%
-
3.5%
]
3.10%
380,1583.7%
[
3.0%
-
3.5%
]
3.35%
103,7755.7%
[
3.5%
-
4.0%
]
3.59%
74,1395.9%
[
3.5%
-
4.0%
]
3.91%
57,3036.3%
[
4.0%
-
4.5%
]
4.11%
124,6212.6%
[
4.0%
-
4.5%
]
4.41%
90,7962.4%
[
4.5%
-
5.0%
]
4.60%
102,5334.2%
[
4.5%
-
5.0%
]
4.93%
52,3693.8%
[
5.0%
-
5.5%
]
5.12%
115,6834.1%
[
5.0%
-
5.5%
]
5.26%
77,5762.7%
[
5.5%
-
6.0%
]
5.62%
168,9874.1%
[
5.5%
-
6.0%
]
5.91%
91,6352.4%
[
6.0%
-
6.5%
]
6.46%
87,8844.6%
[
6.5%
-
7.0%
]
6.52%
47,1954.1%
[
8.0%
-
8.5%
]
8.30%
7,41428.4%
[
8.5%
-
9.0%
]
8.91%
1,10011.6%
[
10.5%
-
11.0%
]
10.77%
49217.6%
[
13.5%
-
14.0%
]
13.63%
47,8936.4%
[
13.5%
-
14.0%
]
13.87%
38217.6%
[
15.0%
-
15.5%
]
15.48%
84,9334.4%