Immigrants from Ukraine Self-Care Disability
COMPARE
Immigrants from Ukraine
Select to Compare
Self-Care Disability
Immigrants from Ukraine Self-Care Disability
2.7%
SELF-CARE DISABILITY
0.1/ 100
METRIC RATING
277th/ 347
METRIC RANK
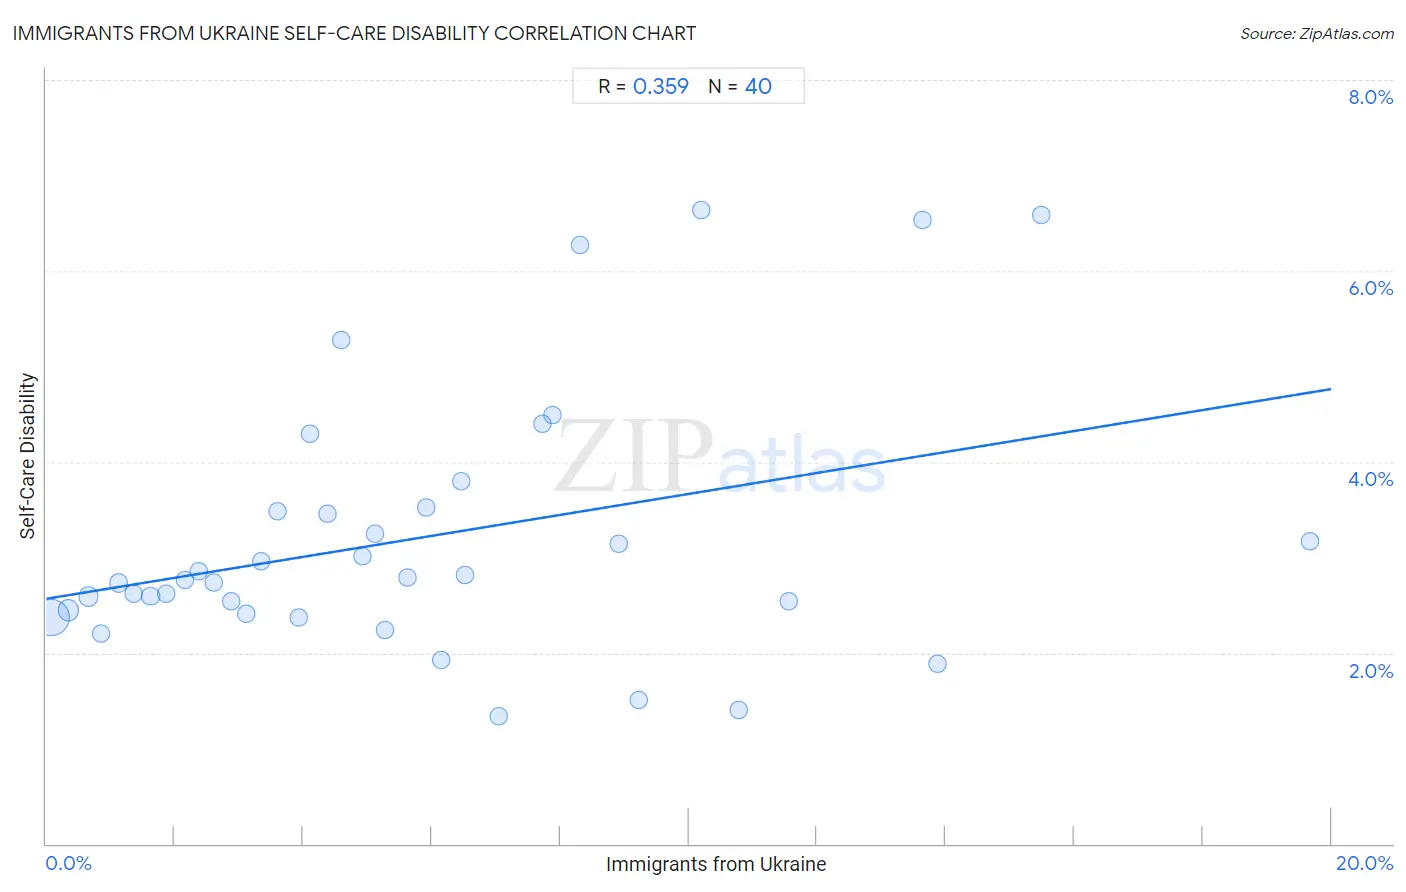
Immigrants from Ukraine Self-Care Disability Correlation Chart
The statistical analysis conducted on geographies consisting of 289,474,241 people shows a mild positive correlation between the proportion of Immigrants from Ukraine and percentage of population with self-care disability in the United States with a correlation coefficient (R) of 0.359 and weighted average of 2.7%. On average, for every 1% (one percent) increase in Immigrants from Ukraine within a typical geography, there is an increase of 0.11% in percentage of population with self-care disability.
It is essential to understand that the correlation between the percentage of Immigrants from Ukraine and percentage of population with self-care disability does not imply a direct cause-and-effect relationship. It remains uncertain whether the presence of Immigrants from Ukraine influences an upward or downward trend in the level of percentage of population with self-care disability within an area, or if Immigrants from Ukraine simply ended up residing in those areas with higher or lower levels of percentage of population with self-care disability due to other factors.
Demographics Similar to Immigrants from Ukraine by Self-Care Disability
In terms of self-care disability, the demographic groups most similar to Immigrants from Ukraine are Japanese (2.7%, a difference of 0.060%), Ottawa (2.7%, a difference of 0.080%), Iroquois (2.7%, a difference of 0.18%), Yakama (2.7%, a difference of 0.19%), and Immigrants from Trinidad and Tobago (2.7%, a difference of 0.19%).
| Demographics | Rating | Rank | Self-Care Disability |
| Immigrants from Micronesia | 0.1 /100 | #270 | Tragic 2.7% |
| Trinidadians and Tobagonians | 0.1 /100 | #271 | Tragic 2.7% |
| Immigrants from Laos | 0.1 /100 | #272 | Tragic 2.7% |
| Mexicans | 0.1 /100 | #273 | Tragic 2.7% |
| Yakama | 0.1 /100 | #274 | Tragic 2.7% |
| Immigrants from Trinidad and Tobago | 0.1 /100 | #275 | Tragic 2.7% |
| Japanese | 0.1 /100 | #276 | Tragic 2.7% |
| Immigrants from Ukraine | 0.1 /100 | #277 | Tragic 2.7% |
| Ottawa | 0.1 /100 | #278 | Tragic 2.7% |
| Iroquois | 0.1 /100 | #279 | Tragic 2.7% |
| Hispanics or Latinos | 0.1 /100 | #280 | Tragic 2.7% |
| Immigrants from Iraq | 0.0 /100 | #281 | Tragic 2.7% |
| Apache | 0.0 /100 | #282 | Tragic 2.7% |
| Delaware | 0.0 /100 | #283 | Tragic 2.7% |
| Fijians | 0.0 /100 | #284 | Tragic 2.7% |
Immigrants from Ukraine Self-Care Disability Correlation Summary
| Measurement | Immigrants from Ukraine Data | Self-Care Disability Data |
| Minimum | 0.080% | 1.3% |
| Maximum | 19.7% | 6.6% |
| Range | 19.6% | 5.3% |
| Mean | 5.9% | 3.2% |
| Median | 5.0% | 2.8% |
| Interquartile 25% (IQ1) | 2.5% | 2.4% |
| Interquartile 75% (IQ3) | 8.1% | 3.5% |
| Interquartile Range (IQR) | 5.6% | 1.1% |
| Standard Deviation (Sample) | 4.5% | 1.4% |
| Standard Deviation (Population) | 4.4% | 1.4% |
Correlation Details
| Immigrants from Ukraine Percentile | Sample Size | Self-Care Disability |
[ 0.0% - 0.5% ] 0.080% | 215,838,591 | 2.4% |
[ 0.0% - 0.5% ] 0.35% | 38,141,645 | 2.4% |
[ 0.5% - 1.0% ] 0.66% | 20,468,680 | 2.6% |
[ 0.5% - 1.0% ] 0.86% | 4,304,918 | 2.2% |
[ 1.0% - 1.5% ] 1.12% | 3,238,284 | 2.7% |
[ 1.0% - 1.5% ] 1.36% | 1,564,110 | 2.6% |
[ 1.5% - 2.0% ] 1.62% | 1,355,360 | 2.6% |
[ 1.5% - 2.0% ] 1.88% | 1,075,655 | 2.6% |
[ 2.0% - 2.5% ] 2.16% | 610,220 | 2.8% |
[ 2.0% - 2.5% ] 2.37% | 484,373 | 2.9% |
[ 2.5% - 3.0% ] 2.61% | 365,014 | 2.7% |
[ 2.5% - 3.0% ] 2.89% | 228,394 | 2.5% |
[ 3.0% - 3.5% ] 3.10% | 386,897 | 2.4% |
[ 3.0% - 3.5% ] 3.35% | 104,155 | 3.0% |
[ 3.5% - 4.0% ] 3.59% | 75,207 | 3.5% |
[ 3.5% - 4.0% ] 3.92% | 74,699 | 2.4% |
[ 4.0% - 4.5% ] 4.11% | 128,262 | 4.3% |
[ 4.0% - 4.5% ] 4.38% | 119,686 | 3.5% |
[ 4.5% - 5.0% ] 4.60% | 106,622 | 5.3% |
[ 4.5% - 5.0% ] 4.93% | 52,740 | 3.0% |
[ 5.0% - 5.5% ] 5.12% | 116,296 | 3.2% |
[ 5.0% - 5.5% ] 5.27% | 82,493 | 2.2% |
[ 5.5% - 6.0% ] 5.62% | 169,585 | 2.8% |
[ 5.5% - 6.0% ] 5.91% | 91,635 | 3.5% |
[ 6.0% - 6.5% ] 6.14% | 4,479 | 1.9% |
[ 6.0% - 6.5% ] 6.46% | 89,424 | 3.8% |
[ 6.5% - 7.0% ] 6.52% | 47,195 | 2.8% |
[ 7.0% - 7.5% ] 7.05% | 1,007 | 1.3% |
[ 7.5% - 8.0% ] 7.73% | 1,397 | 4.4% |
[ 7.5% - 8.0% ] 7.88% | 1,370 | 4.5% |
[ 8.0% - 8.5% ] 8.31% | 8,388 | 6.3% |
[ 8.5% - 9.0% ] 8.90% | 1,168 | 3.1% |
[ 9.0% - 9.5% ] 9.22% | 900 | 1.5% |
[ 10.0% - 10.5% ] 10.19% | 648 | 6.6% |
[ 10.5% - 11.0% ] 10.77% | 492 | 1.4% |
[ 11.5% - 12.0% ] 11.56% | 744 | 2.5% |
[ 13.5% - 14.0% ] 13.63% | 47,893 | 6.5% |
[ 13.5% - 14.0% ] 13.87% | 382 | 1.9% |
[ 15.0% - 15.5% ] 15.48% | 84,933 | 6.6% |
[ 19.5% - 20.0% ] 19.67% | 300 | 3.2% |