Immigrants from Ukraine 4 or more Vehicles in Household
COMPARE
Immigrants from Ukraine
Select to Compare
4 or more Vehicles in Household
Immigrants from Ukraine 4 or more Vehicles in Household
5.6%
4+ VEHICLES AVAILABLE
0.9/ 100
METRIC RATING
267th/ 347
METRIC RANK
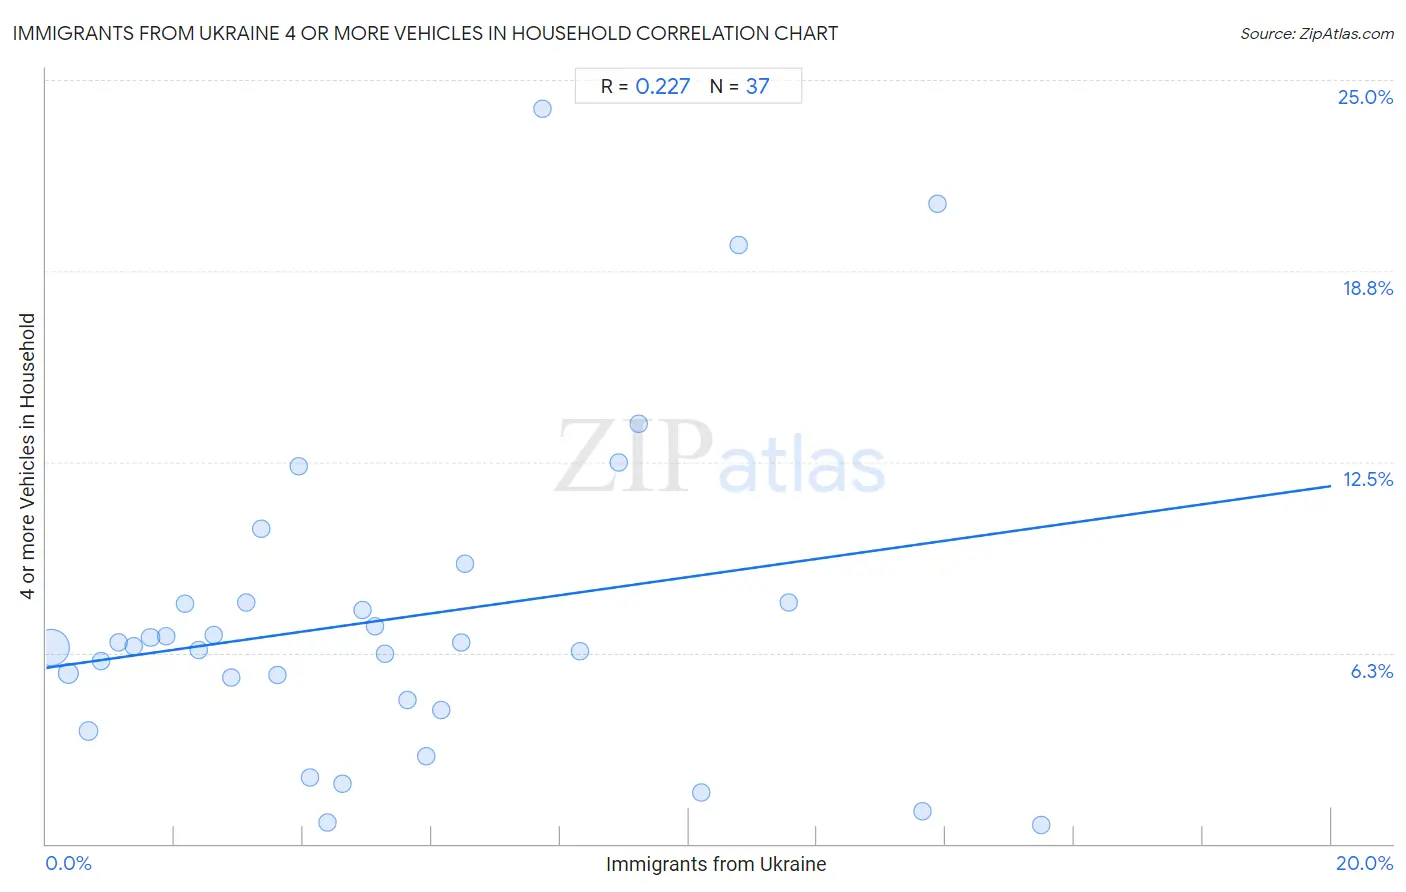
Immigrants from Ukraine 4 or more Vehicles in Household Correlation Chart
The statistical analysis conducted on geographies consisting of 288,490,900 people shows a weak positive correlation between the proportion of Immigrants from Ukraine and percentage of households with 4 or more vehicles available in the United States with a correlation coefficient (R) of 0.227 and weighted average of 5.6%. On average, for every 1% (one percent) increase in Immigrants from Ukraine within a typical geography, there is an increase of 0.30% in percentage of households with 4 or more vehicles available.
It is essential to understand that the correlation between the percentage of Immigrants from Ukraine and percentage of households with 4 or more vehicles available does not imply a direct cause-and-effect relationship. It remains uncertain whether the presence of Immigrants from Ukraine influences an upward or downward trend in the level of percentage of households with 4 or more vehicles available within an area, or if Immigrants from Ukraine simply ended up residing in those areas with higher or lower levels of percentage of households with 4 or more vehicles available due to other factors.
Demographics Similar to Immigrants from Ukraine by 4 or more Vehicles in Household
In terms of 4 or more vehicles in household, the demographic groups most similar to Immigrants from Ukraine are Immigrants from Nepal (5.6%, a difference of 0.080%), South American (5.6%, a difference of 0.11%), Immigrants from Africa (5.6%, a difference of 0.32%), Colombian (5.5%, a difference of 0.43%), and Carpatho Rusyn (5.5%, a difference of 0.59%).
| Demographics | Rating | Rank | 4 or more Vehicles in Household |
| Uruguayans | 1.3 /100 | #260 | Tragic 5.6% |
| Sudanese | 1.2 /100 | #261 | Tragic 5.6% |
| Bermudans | 1.2 /100 | #262 | Tragic 5.6% |
| Immigrants from Saudi Arabia | 1.1 /100 | #263 | Tragic 5.6% |
| Immigrants from Africa | 1.0 /100 | #264 | Tragic 5.6% |
| South Americans | 0.9 /100 | #265 | Tragic 5.6% |
| Immigrants from Nepal | 0.9 /100 | #266 | Tragic 5.6% |
| Immigrants from Ukraine | 0.9 /100 | #267 | Tragic 5.6% |
| Colombians | 0.7 /100 | #268 | Tragic 5.5% |
| Carpatho Rusyns | 0.7 /100 | #269 | Tragic 5.5% |
| Okinawans | 0.6 /100 | #270 | Tragic 5.5% |
| Immigrants from Sudan | 0.6 /100 | #271 | Tragic 5.5% |
| Immigrants from Kazakhstan | 0.6 /100 | #272 | Tragic 5.5% |
| Macedonians | 0.6 /100 | #273 | Tragic 5.5% |
| Blacks/African Americans | 0.6 /100 | #274 | Tragic 5.5% |
Immigrants from Ukraine 4 or more Vehicles in Household Correlation Summary
| Measurement | Immigrants from Ukraine Data | 4 or more Vehicles in Household Data |
| Minimum | 0.080% | 0.61% |
| Maximum | 15.5% | 24.1% |
| Range | 15.4% | 23.5% |
| Mean | 5.4% | 7.4% |
| Median | 4.6% | 6.4% |
| Interquartile 25% (IQ1) | 2.3% | 4.5% |
| Interquartile 75% (IQ3) | 8.0% | 7.9% |
| Interquartile Range (IQR) | 5.8% | 3.4% |
| Standard Deviation (Sample) | 4.0% | 5.3% |
| Standard Deviation (Population) | 4.0% | 5.2% |
Correlation Details
| Immigrants from Ukraine Percentile | Sample Size | 4 or more Vehicles in Household |
[ 0.0% - 0.5% ] 0.080% | 215,196,298 | 6.4% |
[ 0.0% - 0.5% ] 0.35% | 37,944,839 | 5.6% |
[ 0.5% - 1.0% ] 0.66% | 20,382,262 | 3.7% |
[ 0.5% - 1.0% ] 0.86% | 4,310,987 | 6.0% |
[ 1.0% - 1.5% ] 1.12% | 3,228,974 | 6.6% |
[ 1.0% - 1.5% ] 1.36% | 1,559,022 | 6.4% |
[ 1.5% - 2.0% ] 1.62% | 1,333,076 | 6.7% |
[ 1.5% - 2.0% ] 1.88% | 1,076,298 | 6.8% |
[ 2.0% - 2.5% ] 2.16% | 613,711 | 7.8% |
[ 2.0% - 2.5% ] 2.37% | 485,121 | 6.3% |
[ 2.5% - 3.0% ] 2.61% | 364,635 | 6.9% |
[ 2.5% - 3.0% ] 2.89% | 221,094 | 5.4% |
[ 3.0% - 3.5% ] 3.10% | 386,897 | 7.9% |
[ 3.0% - 3.5% ] 3.35% | 103,775 | 10.3% |
[ 3.5% - 4.0% ] 3.59% | 75,423 | 5.5% |
[ 3.5% - 4.0% ] 3.92% | 74,269 | 12.3% |
[ 4.0% - 4.5% ] 4.11% | 128,262 | 2.2% |
[ 4.0% - 4.5% ] 4.38% | 119,686 | 0.69% |
[ 4.5% - 5.0% ] 4.61% | 89,814 | 2.0% |
[ 4.5% - 5.0% ] 4.93% | 52,296 | 7.6% |
[ 5.0% - 5.5% ] 5.12% | 112,663 | 7.1% |
[ 5.0% - 5.5% ] 5.27% | 83,452 | 6.2% |
[ 5.5% - 6.0% ] 5.62% | 169,092 | 4.7% |
[ 5.5% - 6.0% ] 5.91% | 91,635 | 2.9% |
[ 6.0% - 6.5% ] 6.14% | 3,320 | 4.4% |
[ 6.0% - 6.5% ] 6.46% | 89,424 | 6.6% |
[ 6.5% - 7.0% ] 6.52% | 47,698 | 9.2% |
[ 7.5% - 8.0% ] 7.73% | 1,397 | 24.1% |
[ 8.0% - 8.5% ] 8.31% | 8,388 | 6.3% |
[ 8.5% - 9.0% ] 8.91% | 1,100 | 12.5% |
[ 9.0% - 9.5% ] 9.22% | 900 | 13.7% |
[ 10.0% - 10.5% ] 10.19% | 648 | 1.7% |
[ 10.5% - 11.0% ] 10.77% | 492 | 19.6% |
[ 11.5% - 12.0% ] 11.56% | 744 | 7.9% |
[ 13.5% - 14.0% ] 13.63% | 47,893 | 1.1% |
[ 13.5% - 14.0% ] 13.87% | 382 | 20.9% |
[ 15.0% - 15.5% ] 15.48% | 84,933 | 0.61% |