Immigrants from Ukraine Wage/Income Gap

COMPARE

Immigrants from Ukraine
Race
Ancestry
AfghanAfricanAlaska NativeAlaskan AthabascanAlbanianAleutAlsatianAmericanApacheArabArapahoArgentineanArmenianAssyrian/Chaldean/SyriacAustralianAustrianBahamianBangladeshiBarbadianBasqueBelgianBelizeanBermudanBhutaneseBlackfeetBolivianBrazilianBritishBritish West IndianBulgarianBurmeseCajunCambodianCanadianCape VerdeanCarpatho RusynCelticCentral AmericanCentral American IndianCherokeeCheyenneChickasawChileanChineseChippewaChoctawColombianColvilleComancheCosta RicanCreeCreekCroatianCrowCubanCypriotCzechCzechoslovakianDanishDelawareDominicanDutchDutch West IndianEastern EuropeanEcuadorianEgyptianEnglishEstonianEthiopianEuropeanFijianFilipinoFinnishFrenchFrench American IndianFrench CanadianGermanGerman RussianGhanaianGreekGuamanian/ChamorroGuatemalanGuyaneseHaitianHmongHonduranHopiHoumaHungarianIcelanderIndian (Asian)IndonesianInupiatIranianIraqiIrishIroquoisIsraeliItalianJamaicanJapaneseJordanianKenyanKiowaKoreanLaotianLatvianLebaneseLiberianLithuanianLumbeeLuxembourgerMacedonianMalaysianMalteseMarshalleseMenomineeMexicanMexican American IndianMongolianMoroccanNative HawaiianNavajoNepaleseNew ZealanderNicaraguanNigerianNorthern EuropeanNorwegianOkinawanOsageOttawaPaiutePakistaniPalestinianPanamanianParaguayanPennsylvania GermanPeruvianPimaPolishPortuguesePotawatomiPuebloPuerto RicanPuget Sound SalishRomanianRussianSalvadoranSamoanScandinavianScotch-IrishScottishSeminoleSenegaleseSerbianShoshoneSierra LeoneanSiouxSlavicSlovakSloveneSomaliSouth AfricanSouth AmericanSouth American IndianSoviet UnionSpaniardSpanishSpanish AmericanSpanish American IndianSri LankanSubsaharan AfricanSudaneseSwedishSwissSyrianTaiwaneseThaiTlingit-HaidaTohono O'OdhamTonganTrinidadian and TobagonianTsimshianTurkishU.S. Virgin IslanderUgandanUkrainianUruguayanUteVenezuelanVietnameseWelshWest IndianYakamaYaquiYugoslavianYumanYup'ikZimbabwean
Immigration
NonimmigrantsImmigrantsAfghanistanAfricaAlbaniaArgentinaArmeniaAsiaAustraliaAustriaBahamasBangladeshBarbadosBelarusBelgiumBelizeBoliviaBosnia and HerzegovinaBrazilBulgariaBurma/MyanmarCabo VerdeCambodiaCameroonCanadaCaribbeanCentral AmericaChileChinaColombiaCongoCosta RicaCroatiaCubaCzechoslovakiaDenmarkDominicaDominican RepublicEastern AfricaEastern AsiaEastern EuropeEcuadorEgyptEl SalvadorEnglandEritreaEthiopiaEuropeFijiFranceGermanyGhanaGreeceGrenadaGuatemalaGuyanaHaitiHondurasHong KongHungaryIndiaIndonesiaIranIraqIrelandIsraelItalyJamaicaJapanJordanKazakhstanKenyaKoreaKuwaitLaosLatin AmericaLatviaLebanonLiberiaLithuaniaMalaysiaMexicoMicronesiaMiddle AfricaMoldovaMoroccoNepalNetherlandsNicaraguaNigeriaNorth AmericaNorth MacedoniaNorthern AfricaNorthern EuropeNorwayOceaniaPakistanPanamaPeruPhilippinesPolandPortugalRomaniaRussiaSaudi ArabiaScotlandSenegalSerbiaSierra LeoneSingaporeSomaliaSouth AfricaSouth AmericaSouth Central AsiaSouth Eastern AsiaSouthern EuropeSpainSri LankaSt. Vincent and the GrenadinesSudanSwedenSwitzerlandSyriaTaiwanThailandTrinidad and TobagoTurkeyUgandaUkraineUruguayUzbekistanVenezuelaVietnamWest IndiesWestern AfricaWestern AsiaWestern EuropeYemenZaireZimbabweAzores
Select to Compare
Race
Ancestry
AfghanAfricanAlaska NativeAlaskan AthabascanAlbanianAleutAlsatianAmericanApacheArabArapahoArgentineanArmenianAssyrian/Chaldean/SyriacAustralianAustrianBahamianBangladeshiBarbadianBasqueBelgianBelizeanBermudanBhutaneseBlackfeetBolivianBrazilianBritishBritish West IndianBulgarianBurmeseCajunCambodianCanadianCape VerdeanCarpatho RusynCelticCentral AmericanCentral American IndianCherokeeCheyenneChickasawChileanChineseChippewaChoctawColombianColvilleComancheCosta RicanCreeCreekCroatianCrowCubanCypriotCzechCzechoslovakianDanishDelawareDominicanDutchDutch West IndianEastern EuropeanEcuadorianEgyptianEnglishEstonianEthiopianEuropeanFijianFilipinoFinnishFrenchFrench American IndianFrench CanadianGermanGerman RussianGhanaianGreekGuamanian/ChamorroGuatemalanGuyaneseHaitianHmongHonduranHopiHoumaHungarianIcelanderIndian (Asian)IndonesianInupiatIranianIraqiIrishIroquoisIsraeliItalianJamaicanJapaneseJordanianKenyanKiowaKoreanLaotianLatvianLebaneseLiberianLithuanianLumbeeLuxembourgerMacedonianMalaysianMalteseMarshalleseMenomineeMexicanMexican American IndianMongolianMoroccanNative HawaiianNavajoNepaleseNew ZealanderNicaraguanNigerianNorthern EuropeanNorwegianOkinawanOsageOttawaPaiutePakistaniPalestinianPanamanianParaguayanPennsylvania GermanPeruvianPimaPolishPortuguesePotawatomiPuebloPuerto RicanPuget Sound SalishRomanianRussianSalvadoranSamoanScandinavianScotch-IrishScottishSeminoleSenegaleseSerbianShoshoneSierra LeoneanSiouxSlavicSlovakSloveneSomaliSouth AfricanSouth AmericanSouth American IndianSoviet UnionSpaniardSpanishSpanish AmericanSpanish American IndianSri LankanSubsaharan AfricanSudaneseSwedishSwissSyrianTaiwaneseThaiTlingit-HaidaTohono O'OdhamTonganTrinidadian and TobagonianTsimshianTurkishU.S. Virgin IslanderUgandanUkrainianUruguayanUteVenezuelanVietnameseWelshWest IndianYakamaYaquiYugoslavianYumanYup'ikZimbabwean
Immigration
NonimmigrantsImmigrantsAfghanistanAfricaAlbaniaArgentinaArmeniaAsiaAustraliaAustriaBahamasBangladeshBarbadosBelarusBelgiumBelizeBoliviaBosnia and HerzegovinaBrazilBulgariaBurma/MyanmarCabo VerdeCambodiaCameroonCanadaCaribbeanCentral AmericaChileChinaColombiaCongoCosta RicaCroatiaCubaCzechoslovakiaDenmarkDominicaDominican RepublicEastern AfricaEastern AsiaEastern EuropeEcuadorEgyptEl SalvadorEnglandEritreaEthiopiaEuropeFijiFranceGermanyGhanaGreeceGrenadaGuatemalaGuyanaHaitiHondurasHong KongHungaryIndiaIndonesiaIranIraqIrelandIsraelItalyJamaicaJapanJordanKazakhstanKenyaKoreaKuwaitLaosLatin AmericaLatviaLebanonLiberiaLithuaniaMalaysiaMexicoMicronesiaMiddle AfricaMoldovaMoroccoNepalNetherlandsNicaraguaNigeriaNorth AmericaNorth MacedoniaNorthern AfricaNorthern EuropeNorwayOceaniaPakistanPanamaPeruPhilippinesPolandPortugalRomaniaRussiaSaudi ArabiaScotlandSenegalSerbiaSierra LeoneSingaporeSomaliaSouth AfricaSouth AmericaSouth Central AsiaSouth Eastern AsiaSouthern EuropeSpainSri LankaSt. Vincent and the GrenadinesSudanSwedenSwitzerlandSyriaTaiwanThailandTrinidad and TobagoTurkeyUgandaUruguayUzbekistanVenezuelaVietnamWest IndiesWestern AfricaWestern AsiaWestern EuropeYemenZaireZimbabweAzores
Wage/Income Gap
Income
Poverty
Unemployment
Labor Participation
Family Structure
Vehicle Availability
Education Level
Disability

Immigrants from Ukraine Wage/Income Gap
Good

25.5%
WAGE/INCOME GAP
63.8/ 100
METRIC RATING
166th/ 347
METRIC RANK

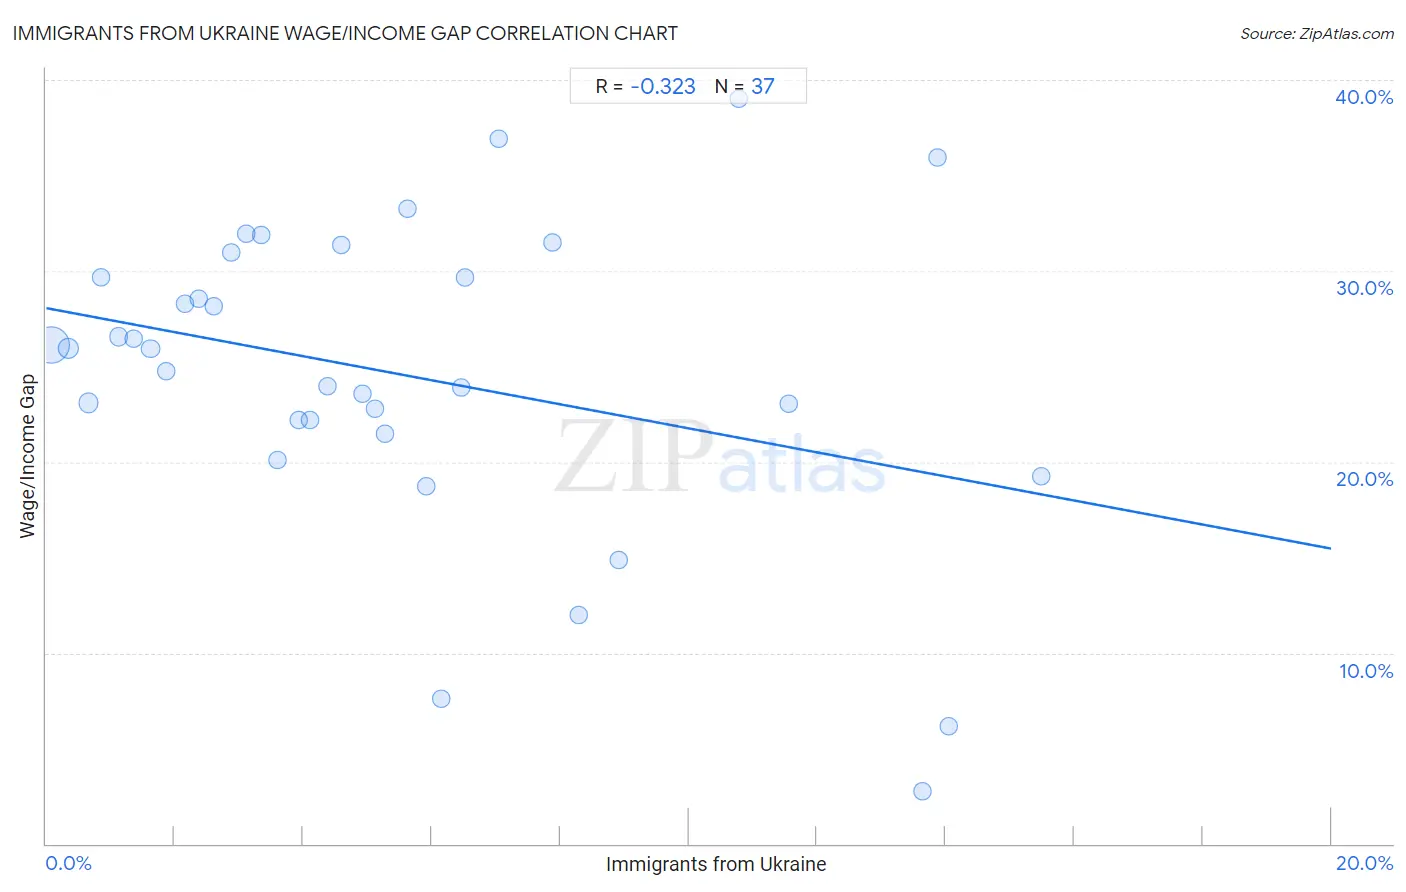
Immigrants from Ukraine Wage/Income Gap Correlation Chart

The statistical analysis conducted on geographies consisting of 289,568,179 people shows a mild negative correlation between the proportion of Immigrants from Ukraine and wage/income gap percentage in the United States with a correlation coefficient (R) of -0.323 and weighted average of 25.5%. On average, for every 1% (one percent) increase in Immigrants from Ukraine within a typical geography, there is a decrease of 0.63% in wage/income gap percentage.
Immigrants from Ukraine Wage/Income Gap
It is essential to understand that the correlation between the percentage of Immigrants from Ukraine and wage/income gap percentage does not imply a direct cause-and-effect relationship. It remains uncertain whether the presence of Immigrants from Ukraine influences an upward or downward trend in the level of wage/income gap percentage within an area, or if Immigrants from Ukraine simply ended up residing in those areas with higher or lower levels of wage/income gap percentage due to other factors.

Demographics Similar to Immigrants from Ukraine by Wage/Income Gap

In terms of wage/income gap, the demographic groups most similar to Immigrants from Ukraine are Immigrants from Hong Kong (25.5%, a difference of 0.010%), Paiute (25.5%, a difference of 0.060%), Seminole (25.6%, a difference of 0.080%), Peruvian (25.6%, a difference of 0.26%), and Korean (25.4%, a difference of 0.35%).
DemographicsRating | RankWage/Income Gap
Puget Sound Salish
73.0
/100
|
#159
Good
25.3%
French American Indians
72.5
/100
|
#160
Good
25.4%
Albanians
69.4
/100
|
#161
Good
25.4%
Shoshone
69.0
/100
|
#162
Good
25.4%
Native Hawaiians
69.0
/100
|
#163
Good
25.4%
Koreans
68.6
/100
|
#164
Good
25.4%
Immigrants from Hong Kong
64.0
/100
|
#165
Good
25.5%
Immigrants from Ukraine
63.8
/100
|
#166
Good
25.5%
Paiute
62.9
/100
|
#167
Good
25.5%
Seminole
62.6
/100
|
#168
Good
25.6%
Peruvians
60.1
/100
|
#169
Good
25.6%
Immigrants from Oceania
57.5
/100
|
#170
Average
25.6%
Immigrants from Greece
56.6
/100
|
#171
Average
25.7%
Immigrants from Chile
53.2
/100
|
#172
Average
25.7%
Immigrants from Belarus
52.9
/100
|
#173
Average
25.7%

Immigrants from Ukraine Wage/Income Gap Correlation Summary

MeasurementImmigrants from Ukraine DataWage/Income Gap Data
Minimum0.080%2.8%
Maximum15.5%39.0%
Range15.4%36.2%
Mean5.5%24.6%
Median4.6%25.9%
Interquartile 25% (IQ1)2.3%21.8%
Interquartile 75% (IQ3)7.5%30.3%
Interquartile Range (IQR)5.2%8.5%
Standard Deviation (Sample)4.2%8.1%
Standard Deviation (Population)4.1%8.0%

Correlation Details

Immigrants from Ukraine PercentileSample SizeWage/Income Gap
[
0.0%
-
0.5%
]
0.080%
215,917,62826.1%
[
0.0%
-
0.5%
]
0.35%
38,154,66626.0%
[
0.5%
-
1.0%
]
0.66%
20,477,33023.1%
[
0.5%
-
1.0%
]
0.86%
4,307,27829.7%
[
1.0%
-
1.5%
]
1.12%
3,249,00726.6%
[
1.0%
-
1.5%
]
1.36%
1,559,63626.5%
[
1.5%
-
2.0%
]
1.62%
1,361,92225.9%
[
1.5%
-
2.0%
]
1.88%
1,079,84224.8%
[
2.0%
-
2.5%
]
2.16%
604,99728.3%
[
2.0%
-
2.5%
]
2.37%
481,34928.5%
[
2.5%
-
3.0%
]
2.61%
365,93228.2%
[
2.5%
-
3.0%
]
2.89%
224,44631.0%
[
3.0%
-
3.5%
]
3.10%
386,39931.9%
[
3.0%
-
3.5%
]
3.35%
103,77531.9%
[
3.5%
-
4.0%
]
3.59%
72,87120.1%
[
3.5%
-
4.0%
]
3.92%
70,27922.2%
[
4.0%
-
4.5%
]
4.11%
128,26222.2%
[
4.0%
-
4.5%
]
4.39%
117,16524.0%
[
4.5%
-
5.0%
]
4.60%
106,62231.3%
[
4.5%
-
5.0%
]
4.93%
54,27123.6%
[
5.0%
-
5.5%
]
5.12%
115,68322.8%
[
5.0%
-
5.5%
]
5.26%
79,87421.5%
[
5.5%
-
6.0%
]
5.62%
168,98733.2%
[
5.5%
-
6.0%
]
5.91%
91,63518.7%
[
6.0%
-
6.5%
]
6.14%
4,4797.6%
[
6.0%
-
6.5%
]
6.46%
89,42423.9%
[
6.5%
-
7.0%
]
6.52%
47,19529.7%
[
7.0%
-
7.5%
]
7.05%
1,00736.9%
[
7.5%
-
8.0%
]
7.88%
1,37031.5%
[
8.0%
-
8.5%
]
8.30%
7,41412.0%
[
8.5%
-
9.0%
]
8.90%
1,16814.9%
[
10.5%
-
11.0%
]
10.77%
49239.0%
[
11.5%
-
12.0%
]
11.56%
74423.0%
[
13.5%
-
14.0%
]
13.63%
47,8932.8%
[
13.5%
-
14.0%
]
13.87%
38235.9%
[
14.0%
-
14.5%
]
14.05%
1,8226.1%
[
15.0%
-
15.5%
]
15.48%
84,93319.3%