Immigrants from Ukraine vs Menominee Married-Couple Family Poverty
COMPARE
Immigrants from Ukraine
Menominee
Married-Couple Family Poverty
Married-Couple Family Poverty Comparison
Immigrants from Ukraine
Menominee
5.2%
MARRIED-COUPLE FAMILY POVERTY
44.9/ 100
METRIC RATING
178th/ 347
METRIC RANK
5.2%
MARRIED-COUPLE FAMILY POVERTY
47.8/ 100
METRIC RATING
176th/ 347
METRIC RANK
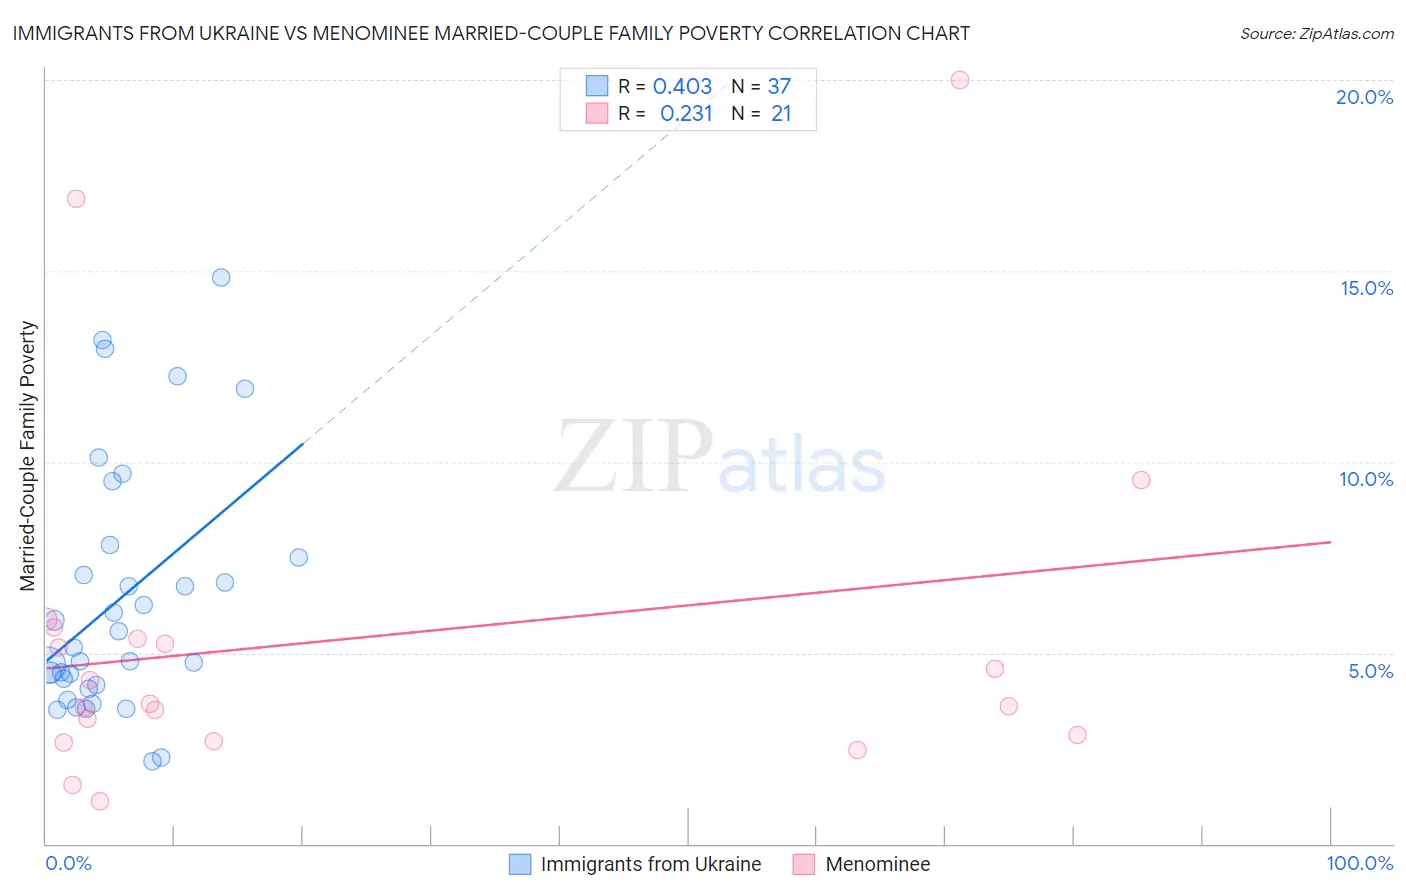
Immigrants from Ukraine vs Menominee Married-Couple Family Poverty Correlation Chart
The statistical analysis conducted on geographies consisting of 287,534,974 people shows a moderate positive correlation between the proportion of Immigrants from Ukraine and poverty level among married-couple families in the United States with a correlation coefficient (R) of 0.403 and weighted average of 5.2%. Similarly, the statistical analysis conducted on geographies consisting of 45,721,986 people shows a weak positive correlation between the proportion of Menominee and poverty level among married-couple families in the United States with a correlation coefficient (R) of 0.231 and weighted average of 5.2%, a difference of 0.34%.
Married-Couple Family Poverty Correlation Summary
| Measurement | Immigrants from Ukraine | Menominee |
| Minimum | 2.1% | 1.1% |
| Maximum | 14.8% | 20.0% |
| Range | 12.7% | 18.9% |
| Mean | 6.4% | 5.4% |
| Median | 5.2% | 3.7% |
| Interquartile 25% (IQ1) | 4.1% | 2.8% |
| Interquartile 75% (IQ3) | 7.7% | 5.5% |
| Interquartile Range (IQR) | 3.6% | 2.7% |
| Standard Deviation (Sample) | 3.3% | 4.7% |
| Standard Deviation (Population) | 3.2% | 4.6% |
Demographics Similar to Immigrants from Ukraine and Menominee by Married-Couple Family Poverty
In terms of married-couple family poverty, the demographic groups most similar to Immigrants from Ukraine are Immigrants from Kazakhstan (5.2%, a difference of 0.020%), Marshallese (5.2%, a difference of 0.35%), Spanish (5.3%, a difference of 0.42%), Immigrants from Eastern Africa (5.2%, a difference of 0.59%), and Immigrants from Sierra Leone (5.3%, a difference of 0.67%). Similarly, the demographic groups most similar to Menominee are Marshallese (5.2%, a difference of 0.010%), Immigrants from Eastern Africa (5.2%, a difference of 0.25%), Immigrants from Kazakhstan (5.2%, a difference of 0.32%), Alsatian (5.2%, a difference of 0.39%), and Immigrants from Northern Africa (5.2%, a difference of 0.41%).
| Demographics | Rating | Rank | Married-Couple Family Poverty |
| Costa Ricans | 61.5 /100 | #167 | Good 5.1% |
| Immigrants | Uganda | 54.9 /100 | #168 | Average 5.2% |
| Ottawa | 54.5 /100 | #169 | Average 5.2% |
| Immigrants | Argentina | 54.4 /100 | #170 | Average 5.2% |
| Bermudans | 52.9 /100 | #171 | Average 5.2% |
| Immigrants | Northern Africa | 51.3 /100 | #172 | Average 5.2% |
| Alsatians | 51.2 /100 | #173 | Average 5.2% |
| Immigrants | Eastern Africa | 50.0 /100 | #174 | Average 5.2% |
| Marshallese | 47.9 /100 | #175 | Average 5.2% |
| Menominee | 47.8 /100 | #176 | Average 5.2% |
| Immigrants | Kazakhstan | 45.1 /100 | #177 | Average 5.2% |
| Immigrants | Ukraine | 44.9 /100 | #178 | Average 5.2% |
| Spanish | 41.4 /100 | #179 | Average 5.3% |
| Immigrants | Sierra Leone | 39.3 /100 | #180 | Fair 5.3% |
| Immigrants | Chile | 38.8 /100 | #181 | Fair 5.3% |
| Immigrants | Vietnam | 37.7 /100 | #182 | Fair 5.3% |
| Peruvians | 37.6 /100 | #183 | Fair 5.3% |
| Immigrants | Nonimmigrants | 35.8 /100 | #184 | Fair 5.3% |
| Americans | 35.4 /100 | #185 | Fair 5.3% |
| Hungarians | 34.7 /100 | #186 | Fair 5.3% |
| Immigrants | Albania | 33.8 /100 | #187 | Fair 5.3% |