Immigrants from Ukraine vs Afghan Married-Couple Family Poverty
COMPARE
Immigrants from Ukraine
Afghan
Married-Couple Family Poverty
Married-Couple Family Poverty Comparison
Immigrants from Ukraine
Afghans
5.2%
MARRIED-COUPLE FAMILY POVERTY
44.9/ 100
METRIC RATING
178th/ 347
METRIC RANK
5.5%
MARRIED-COUPLE FAMILY POVERTY
11.2/ 100
METRIC RATING
218th/ 347
METRIC RANK
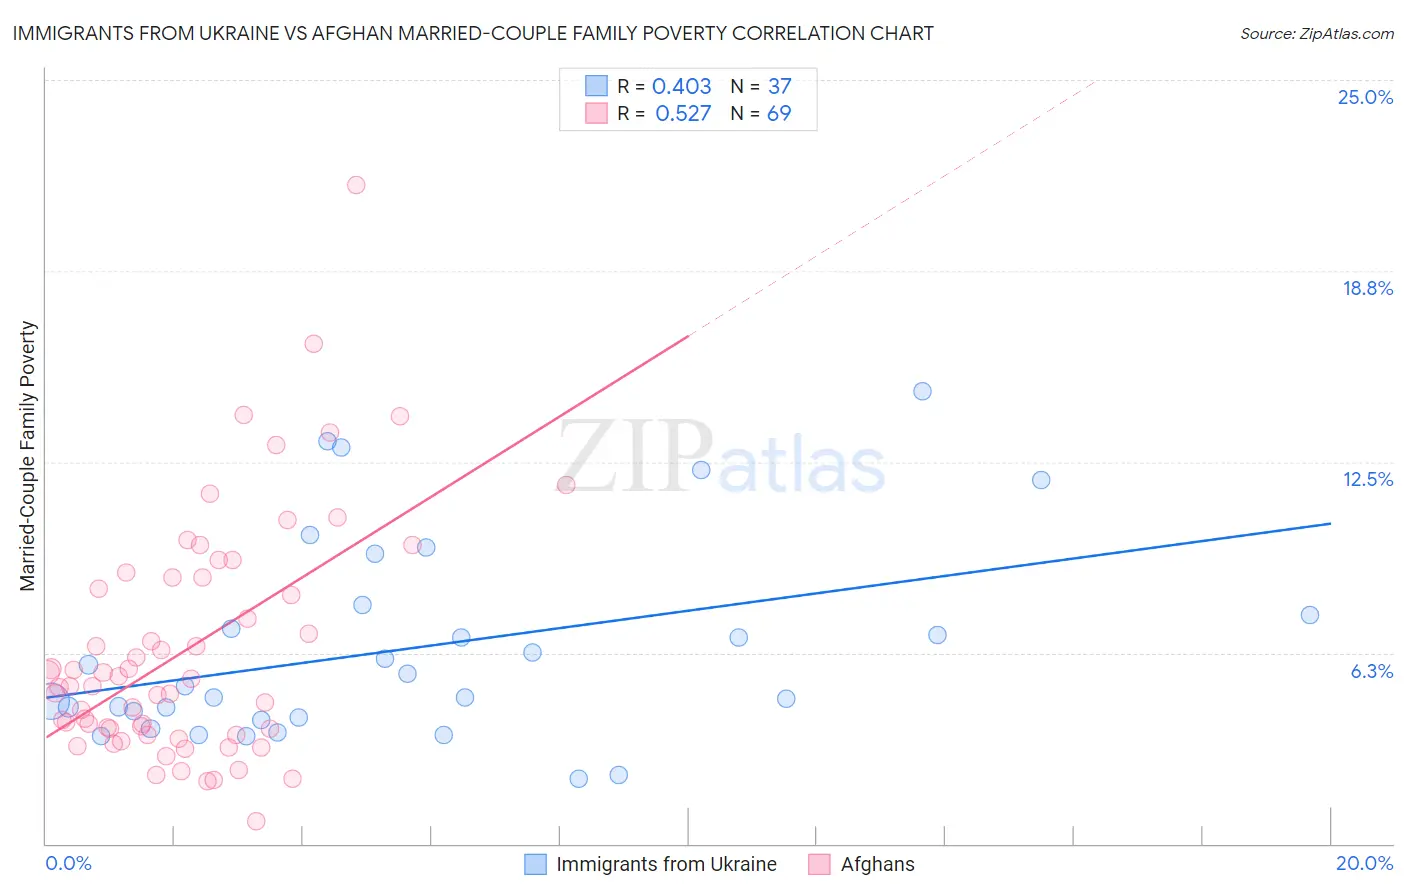
Immigrants from Ukraine vs Afghan Married-Couple Family Poverty Correlation Chart
The statistical analysis conducted on geographies consisting of 287,534,974 people shows a moderate positive correlation between the proportion of Immigrants from Ukraine and poverty level among married-couple families in the United States with a correlation coefficient (R) of 0.403 and weighted average of 5.2%. Similarly, the statistical analysis conducted on geographies consisting of 148,344,373 people shows a substantial positive correlation between the proportion of Afghans and poverty level among married-couple families in the United States with a correlation coefficient (R) of 0.527 and weighted average of 5.5%, a difference of 5.4%.
Married-Couple Family Poverty Correlation Summary
| Measurement | Immigrants from Ukraine | Afghan |
| Minimum | 2.1% | 0.76% |
| Maximum | 14.8% | 21.6% |
| Range | 12.7% | 20.8% |
| Mean | 6.4% | 6.4% |
| Median | 5.2% | 5.2% |
| Interquartile 25% (IQ1) | 4.1% | 3.7% |
| Interquartile 75% (IQ3) | 7.7% | 8.7% |
| Interquartile Range (IQR) | 3.6% | 5.1% |
| Standard Deviation (Sample) | 3.3% | 3.9% |
| Standard Deviation (Population) | 3.2% | 3.9% |
Similar Demographics by Married-Couple Family Poverty
Demographics Similar to Immigrants from Ukraine by Married-Couple Family Poverty
In terms of married-couple family poverty, the demographic groups most similar to Immigrants from Ukraine are Immigrants from Kazakhstan (5.2%, a difference of 0.020%), Menominee (5.2%, a difference of 0.34%), Marshallese (5.2%, a difference of 0.35%), Spanish (5.3%, a difference of 0.42%), and Immigrants from Eastern Africa (5.2%, a difference of 0.59%).
| Demographics | Rating | Rank | Married-Couple Family Poverty |
| Bermudans | 52.9 /100 | #171 | Average 5.2% |
| Immigrants | Northern Africa | 51.3 /100 | #172 | Average 5.2% |
| Alsatians | 51.2 /100 | #173 | Average 5.2% |
| Immigrants | Eastern Africa | 50.0 /100 | #174 | Average 5.2% |
| Marshallese | 47.9 /100 | #175 | Average 5.2% |
| Menominee | 47.8 /100 | #176 | Average 5.2% |
| Immigrants | Kazakhstan | 45.1 /100 | #177 | Average 5.2% |
| Immigrants | Ukraine | 44.9 /100 | #178 | Average 5.2% |
| Spanish | 41.4 /100 | #179 | Average 5.3% |
| Immigrants | Sierra Leone | 39.3 /100 | #180 | Fair 5.3% |
| Immigrants | Chile | 38.8 /100 | #181 | Fair 5.3% |
| Immigrants | Vietnam | 37.7 /100 | #182 | Fair 5.3% |
| Peruvians | 37.6 /100 | #183 | Fair 5.3% |
| Immigrants | Nonimmigrants | 35.8 /100 | #184 | Fair 5.3% |
| Americans | 35.4 /100 | #185 | Fair 5.3% |
Demographics Similar to Afghans by Married-Couple Family Poverty
In terms of married-couple family poverty, the demographic groups most similar to Afghans are Immigrants from Nigeria (5.5%, a difference of 0.020%), Potawatomi (5.5%, a difference of 0.31%), Japanese (5.6%, a difference of 0.40%), Armenian (5.5%, a difference of 0.43%), and Iroquois (5.5%, a difference of 0.49%).
| Demographics | Rating | Rank | Married-Couple Family Poverty |
| Nigerians | 14.3 /100 | #211 | Poor 5.5% |
| Immigrants | Thailand | 14.0 /100 | #212 | Poor 5.5% |
| Immigrants | Liberia | 13.3 /100 | #213 | Poor 5.5% |
| Iroquois | 13.1 /100 | #214 | Poor 5.5% |
| Armenians | 12.8 /100 | #215 | Poor 5.5% |
| Potawatomi | 12.4 /100 | #216 | Poor 5.5% |
| Immigrants | Nigeria | 11.3 /100 | #217 | Poor 5.5% |
| Afghans | 11.2 /100 | #218 | Poor 5.5% |
| Japanese | 9.8 /100 | #219 | Tragic 5.6% |
| Colombians | 9.2 /100 | #220 | Tragic 5.6% |
| Panamanians | 9.2 /100 | #221 | Tragic 5.6% |
| Cajuns | 6.9 /100 | #222 | Tragic 5.6% |
| Immigrants | Fiji | 6.7 /100 | #223 | Tragic 5.6% |
| Sudanese | 6.4 /100 | #224 | Tragic 5.6% |
| Immigrants | Cambodia | 6.1 /100 | #225 | Tragic 5.6% |