Immigrants from Ukraine Disability

COMPARE

Immigrants from Ukraine
Race
Ancestry
AfghanAfricanAlaska NativeAlaskan AthabascanAlbanianAleutAlsatianAmericanApacheArabArapahoArgentineanArmenianAssyrian/Chaldean/SyriacAustralianAustrianBahamianBangladeshiBarbadianBasqueBelgianBelizeanBermudanBhutaneseBlackfeetBolivianBrazilianBritishBritish West IndianBulgarianBurmeseCajunCambodianCanadianCape VerdeanCarpatho RusynCelticCentral AmericanCentral American IndianCherokeeCheyenneChickasawChileanChineseChippewaChoctawColombianColvilleComancheCosta RicanCreeCreekCroatianCrowCubanCypriotCzechCzechoslovakianDanishDelawareDominicanDutchDutch West IndianEastern EuropeanEcuadorianEgyptianEnglishEstonianEthiopianEuropeanFijianFilipinoFinnishFrenchFrench American IndianFrench CanadianGermanGerman RussianGhanaianGreekGuamanian/ChamorroGuatemalanGuyaneseHaitianHmongHonduranHopiHoumaHungarianIcelanderIndian (Asian)IndonesianInupiatIranianIraqiIrishIroquoisIsraeliItalianJamaicanJapaneseJordanianKenyanKiowaKoreanLaotianLatvianLebaneseLiberianLithuanianLumbeeLuxembourgerMacedonianMalaysianMalteseMarshalleseMenomineeMexicanMexican American IndianMongolianMoroccanNative HawaiianNavajoNepaleseNew ZealanderNicaraguanNigerianNorthern EuropeanNorwegianOkinawanOsageOttawaPaiutePakistaniPalestinianPanamanianParaguayanPennsylvania GermanPeruvianPimaPolishPortuguesePotawatomiPuebloPuerto RicanPuget Sound SalishRomanianRussianSalvadoranSamoanScandinavianScotch-IrishScottishSeminoleSenegaleseSerbianShoshoneSierra LeoneanSiouxSlavicSlovakSloveneSomaliSouth AfricanSouth AmericanSouth American IndianSoviet UnionSpaniardSpanishSpanish AmericanSpanish American IndianSri LankanSubsaharan AfricanSudaneseSwedishSwissSyrianTaiwaneseThaiTlingit-HaidaTohono O'OdhamTonganTrinidadian and TobagonianTsimshianTurkishU.S. Virgin IslanderUgandanUkrainianUruguayanUteVenezuelanVietnameseWelshWest IndianYakamaYaquiYugoslavianYumanYup'ikZimbabwean
Immigration
NonimmigrantsImmigrantsAfghanistanAfricaAlbaniaArgentinaArmeniaAsiaAustraliaAustriaBahamasBangladeshBarbadosBelarusBelgiumBelizeBoliviaBosnia and HerzegovinaBrazilBulgariaBurma/MyanmarCabo VerdeCambodiaCameroonCanadaCaribbeanCentral AmericaChileChinaColombiaCongoCosta RicaCroatiaCubaCzechoslovakiaDenmarkDominicaDominican RepublicEastern AfricaEastern AsiaEastern EuropeEcuadorEgyptEl SalvadorEnglandEritreaEthiopiaEuropeFijiFranceGermanyGhanaGreeceGrenadaGuatemalaGuyanaHaitiHondurasHong KongHungaryIndiaIndonesiaIranIraqIrelandIsraelItalyJamaicaJapanJordanKazakhstanKenyaKoreaKuwaitLaosLatin AmericaLatviaLebanonLiberiaLithuaniaMalaysiaMexicoMicronesiaMiddle AfricaMoldovaMoroccoNepalNetherlandsNicaraguaNigeriaNorth AmericaNorth MacedoniaNorthern AfricaNorthern EuropeNorwayOceaniaPakistanPanamaPeruPhilippinesPolandPortugalRomaniaRussiaSaudi ArabiaScotlandSenegalSerbiaSierra LeoneSingaporeSomaliaSouth AfricaSouth AmericaSouth Central AsiaSouth Eastern AsiaSouthern EuropeSpainSri LankaSt. Vincent and the GrenadinesSudanSwedenSwitzerlandSyriaTaiwanThailandTrinidad and TobagoTurkeyUgandaUkraineUruguayUzbekistanVenezuelaVietnamWest IndiesWestern AfricaWestern AsiaWestern EuropeYemenZaireZimbabweAzores
Select to Compare
Race
Ancestry
AfghanAfricanAlaska NativeAlaskan AthabascanAlbanianAleutAlsatianAmericanApacheArabArapahoArgentineanArmenianAssyrian/Chaldean/SyriacAustralianAustrianBahamianBangladeshiBarbadianBasqueBelgianBelizeanBermudanBhutaneseBlackfeetBolivianBrazilianBritishBritish West IndianBulgarianBurmeseCajunCambodianCanadianCape VerdeanCarpatho RusynCelticCentral AmericanCentral American IndianCherokeeCheyenneChickasawChileanChineseChippewaChoctawColombianColvilleComancheCosta RicanCreeCreekCroatianCrowCubanCypriotCzechCzechoslovakianDanishDelawareDominicanDutchDutch West IndianEastern EuropeanEcuadorianEgyptianEnglishEstonianEthiopianEuropeanFijianFilipinoFinnishFrenchFrench American IndianFrench CanadianGermanGerman RussianGhanaianGreekGuamanian/ChamorroGuatemalanGuyaneseHaitianHmongHonduranHopiHoumaHungarianIcelanderIndian (Asian)IndonesianInupiatIranianIraqiIrishIroquoisIsraeliItalianJamaicanJapaneseJordanianKenyanKiowaKoreanLaotianLatvianLebaneseLiberianLithuanianLumbeeLuxembourgerMacedonianMalaysianMalteseMarshalleseMenomineeMexicanMexican American IndianMongolianMoroccanNative HawaiianNavajoNepaleseNew ZealanderNicaraguanNigerianNorthern EuropeanNorwegianOkinawanOsageOttawaPaiutePakistaniPalestinianPanamanianParaguayanPennsylvania GermanPeruvianPimaPolishPortuguesePotawatomiPuebloPuerto RicanPuget Sound SalishRomanianRussianSalvadoranSamoanScandinavianScotch-IrishScottishSeminoleSenegaleseSerbianShoshoneSierra LeoneanSiouxSlavicSlovakSloveneSomaliSouth AfricanSouth AmericanSouth American IndianSoviet UnionSpaniardSpanishSpanish AmericanSpanish American IndianSri LankanSubsaharan AfricanSudaneseSwedishSwissSyrianTaiwaneseThaiTlingit-HaidaTohono O'OdhamTonganTrinidadian and TobagonianTsimshianTurkishU.S. Virgin IslanderUgandanUkrainianUruguayanUteVenezuelanVietnameseWelshWest IndianYakamaYaquiYugoslavianYumanYup'ikZimbabwean
Immigration
NonimmigrantsImmigrantsAfghanistanAfricaAlbaniaArgentinaArmeniaAsiaAustraliaAustriaBahamasBangladeshBarbadosBelarusBelgiumBelizeBoliviaBosnia and HerzegovinaBrazilBulgariaBurma/MyanmarCabo VerdeCambodiaCameroonCanadaCaribbeanCentral AmericaChileChinaColombiaCongoCosta RicaCroatiaCubaCzechoslovakiaDenmarkDominicaDominican RepublicEastern AfricaEastern AsiaEastern EuropeEcuadorEgyptEl SalvadorEnglandEritreaEthiopiaEuropeFijiFranceGermanyGhanaGreeceGrenadaGuatemalaGuyanaHaitiHondurasHong KongHungaryIndiaIndonesiaIranIraqIrelandIsraelItalyJamaicaJapanJordanKazakhstanKenyaKoreaKuwaitLaosLatin AmericaLatviaLebanonLiberiaLithuaniaMalaysiaMexicoMicronesiaMiddle AfricaMoldovaMoroccoNepalNetherlandsNicaraguaNigeriaNorth AmericaNorth MacedoniaNorthern AfricaNorthern EuropeNorwayOceaniaPakistanPanamaPeruPhilippinesPolandPortugalRomaniaRussiaSaudi ArabiaScotlandSenegalSerbiaSierra LeoneSingaporeSomaliaSouth AfricaSouth AmericaSouth Central AsiaSouth Eastern AsiaSouthern EuropeSpainSri LankaSt. Vincent and the GrenadinesSudanSwedenSwitzerlandSyriaTaiwanThailandTrinidad and TobagoTurkeyUgandaUruguayUzbekistanVenezuelaVietnamWest IndiesWestern AfricaWestern AsiaWestern EuropeYemenZaireZimbabweAzores
Disability
Income
Poverty
Unemployment
Labor Participation
Family Structure
Vehicle Availability
Education Level
Disability

Immigrants from Ukraine Disability
Good

11.5%
DISABILITY
77.6/ 100
METRIC RATING
147th/ 347
METRIC RANK

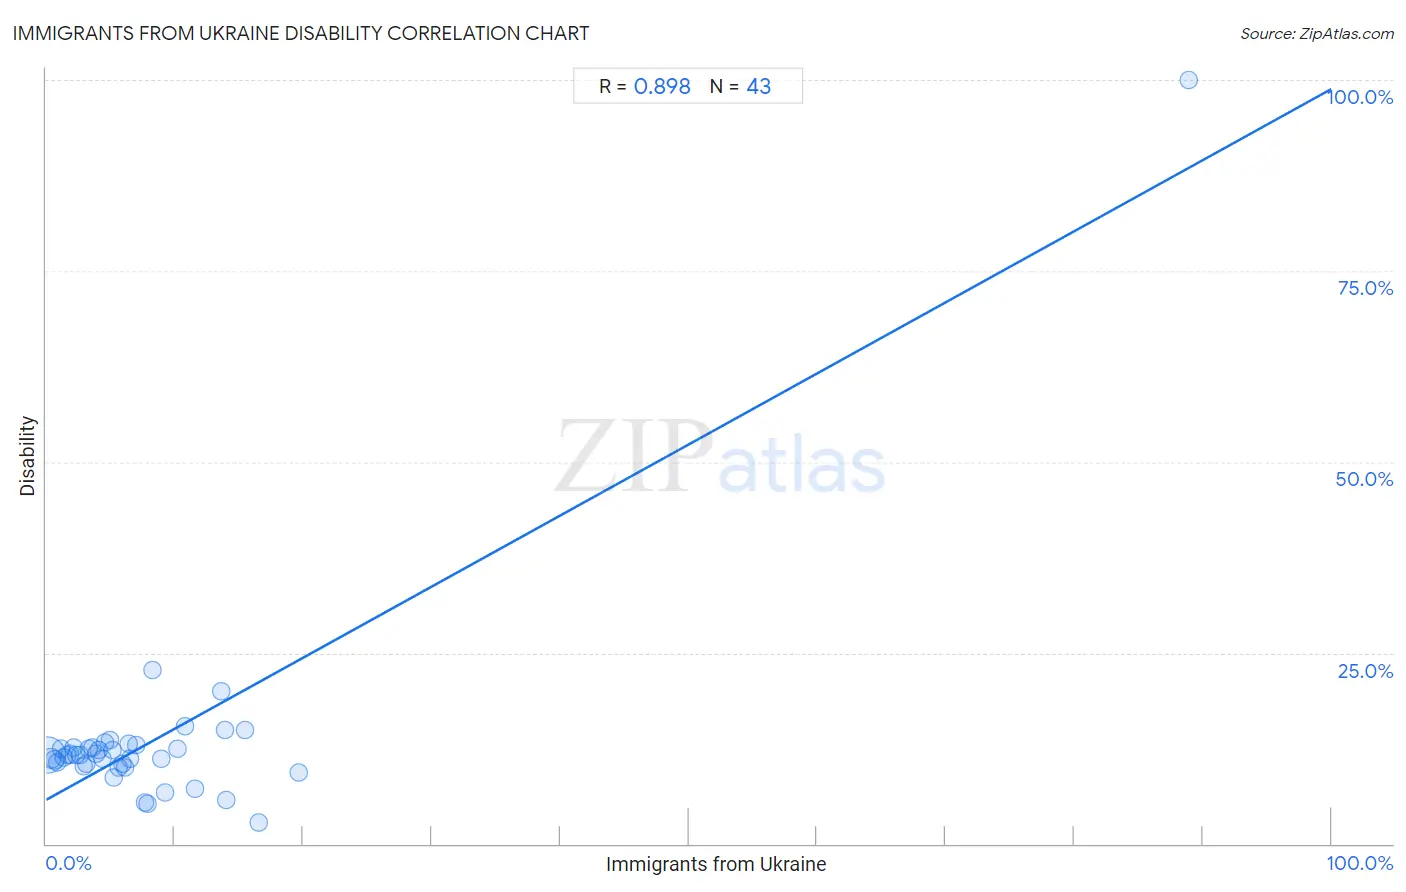
Immigrants from Ukraine Disability Correlation Chart

The statistical analysis conducted on geographies consisting of 289,688,276 people shows a very strong positive correlation between the proportion of Immigrants from Ukraine and percentage of population with a disability in the United States with a correlation coefficient (R) of 0.898 and weighted average of 11.5%. On average, for every 1% (one percent) increase in Immigrants from Ukraine within a typical geography, there is an increase of 0.93% in percentage of population with a disability.
Immigrants from Ukraine Disability
It is essential to understand that the correlation between the percentage of Immigrants from Ukraine and percentage of population with a disability does not imply a direct cause-and-effect relationship. It remains uncertain whether the presence of Immigrants from Ukraine influences an upward or downward trend in the level of percentage of population with a disability within an area, or if Immigrants from Ukraine simply ended up residing in those areas with higher or lower levels of percentage of population with a disability due to other factors.

Demographics Similar to Immigrants from Ukraine by Disability

In terms of disability, the demographic groups most similar to Immigrants from Ukraine are Sudanese (11.5%, a difference of 0.030%), Immigrants from Hungary (11.5%, a difference of 0.090%), Nigerian (11.5%, a difference of 0.26%), Immigrants from Norway (11.6%, a difference of 0.27%), and Romanian (11.6%, a difference of 0.30%).
DemographicsRating | RankDisability
Russians
86.8
/100
|
#140
Excellent
11.5%
Immigrants from Grenada
86.1
/100
|
#141
Excellent
11.5%
Immigrants from Sudan
85.3
/100
|
#142
Excellent
11.5%
Moroccans
83.3
/100
|
#143
Excellent
11.5%
Australians
82.5
/100
|
#144
Excellent
11.5%
Nigerians
81.3
/100
|
#145
Excellent
11.5%
Immigrants from Hungary
79.0
/100
|
#146
Good
11.5%
Immigrants from Ukraine
77.6
/100
|
#147
Good
11.5%
Sudanese
77.1
/100
|
#148
Good
11.5%
Immigrants from Norway
73.2
/100
|
#149
Good
11.6%
Romanians
72.7
/100
|
#150
Good
11.6%
Immigrants from Kenya
72.1
/100
|
#151
Good
11.6%
Immigrants from Moldova
72.0
/100
|
#152
Good
11.6%
Immigrants from Ghana
71.2
/100
|
#153
Good
11.6%
Immigrants from Guatemala
71.1
/100
|
#154
Good
11.6%

Immigrants from Ukraine Disability Correlation Summary

MeasurementImmigrants from Ukraine DataDisability Data
Minimum0.080%2.9%
Maximum88.9%100.0%
Range88.8%97.1%
Mean8.2%13.4%
Median5.3%11.7%
Interquartile 25% (IQ1)2.6%10.2%
Interquartile 75% (IQ3)9.2%12.7%
Interquartile Range (IQR)6.6%2.5%
Standard Deviation (Sample)13.5%14.0%
Standard Deviation (Population)13.3%13.8%

Correlation Details

Immigrants from Ukraine PercentileSample SizeDisability
[
0.0%
-
0.5%
]
0.080%
215,925,31811.7%
[
0.0%
-
0.5%
]
0.35%
38,182,44711.2%
[
0.5%
-
1.0%
]
0.66%
20,489,36711.0%
[
0.5%
-
1.0%
]
0.86%
4,319,72310.6%
[
1.0%
-
1.5%
]
1.12%
3,256,46712.4%
[
1.0%
-
1.5%
]
1.36%
1,566,92311.2%
[
1.5%
-
2.0%
]
1.62%
1,363,82811.6%
[
1.5%
-
2.0%
]
1.88%
1,082,20711.7%
[
2.0%
-
2.5%
]
2.16%
613,80212.6%
[
2.0%
-
2.5%
]
2.37%
485,25211.7%
[
2.5%
-
3.0%
]
2.61%
368,00911.7%
[
2.5%
-
3.0%
]
2.89%
228,39410.2%
[
3.0%
-
3.5%
]
3.10%
386,89710.5%
[
3.0%
-
3.5%
]
3.35%
104,15512.5%
[
3.5%
-
4.0%
]
3.59%
75,88012.7%
[
3.5%
-
4.0%
]
3.92%
74,82511.7%
[
4.0%
-
4.5%
]
4.11%
128,26212.3%
[
4.0%
-
4.5%
]
4.38%
119,68611.1%
[
4.5%
-
5.0%
]
4.60%
106,62213.2%
[
4.5%
-
5.0%
]
4.93%
55,61513.6%
[
5.0%
-
5.5%
]
5.12%
116,29612.3%
[
5.0%
-
5.5%
]
5.27%
83,4528.7%
[
5.5%
-
6.0%
]
5.62%
169,58510.1%
[
5.5%
-
6.0%
]
5.91%
91,63510.5%
[
6.0%
-
6.5%
]
6.14%
4,4799.9%
[
6.0%
-
6.5%
]
6.46%
89,42413.1%
[
6.5%
-
7.0%
]
6.52%
47,69811.2%
[
7.0%
-
7.5%
]
7.05%
1,00712.9%
[
7.5%
-
8.0%
]
7.72%
1,4635.5%
[
7.5%
-
8.0%
]
7.88%
1,3705.2%
[
8.0%
-
8.5%
]
8.31%
8,38822.7%
[
8.5%
-
9.0%
]
8.90%
1,16811.1%
[
9.0%
-
9.5%
]
9.22%
9006.7%
[
10.0%
-
10.5%
]
10.19%
64812.5%
[
10.5%
-
11.0%
]
10.77%
49215.4%
[
11.5%
-
12.0%
]
11.56%
7447.1%
[
13.5%
-
14.0%
]
13.63%
47,89320.0%
[
13.5%
-
14.0%
]
13.87%
38214.9%
[
14.0%
-
14.5%
]
14.05%
1,8225.7%
[
15.0%
-
15.5%
]
15.48%
84,93314.8%
[
16.0%
-
16.5%
]
16.50%
4912.9%
[
19.5%
-
20.0%
]
19.67%
3009.3%
[
88.5%
-
89.0%
]
88.89%
27100.0%