Immigrants from Ukraine Married-couple Households
COMPARE
Immigrants from Ukraine
Select to Compare
Married-couple Households
Immigrants from Ukraine Married-couple Households
47.3%
MARRIED-COUPLE HOUSEHOLDS
86.7/ 100
METRIC RATING
132nd/ 347
METRIC RANK
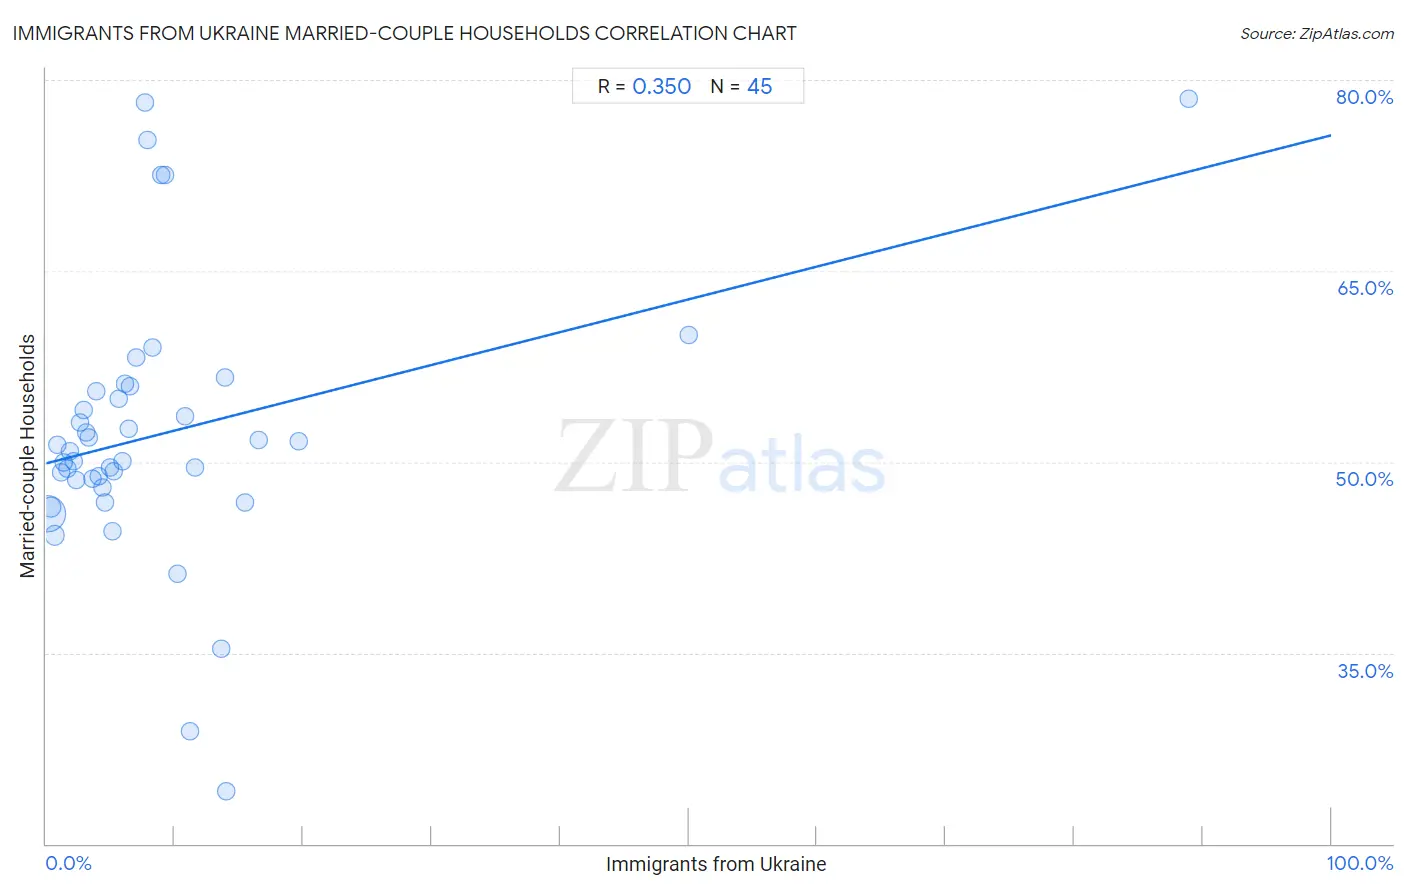
Immigrants from Ukraine Married-couple Households Correlation Chart
The statistical analysis conducted on geographies consisting of 289,643,450 people shows a mild positive correlation between the proportion of Immigrants from Ukraine and percentage of married-couple family households in the United States with a correlation coefficient (R) of 0.350 and weighted average of 47.3%. On average, for every 1% (one percent) increase in Immigrants from Ukraine within a typical geography, there is an increase of 0.26% in percentage of married-couple family households.
It is essential to understand that the correlation between the percentage of Immigrants from Ukraine and percentage of married-couple family households does not imply a direct cause-and-effect relationship. It remains uncertain whether the presence of Immigrants from Ukraine influences an upward or downward trend in the level of percentage of married-couple family households within an area, or if Immigrants from Ukraine simply ended up residing in those areas with higher or lower levels of percentage of married-couple family households due to other factors.
Demographics Similar to Immigrants from Ukraine by Married-couple Households
In terms of married-couple households, the demographic groups most similar to Immigrants from Ukraine are South African (47.3%, a difference of 0.020%), Immigrants from Greece (47.2%, a difference of 0.060%), Immigrants from Argentina (47.2%, a difference of 0.060%), Immigrants from Denmark (47.3%, a difference of 0.070%), and Immigrants from Iraq (47.3%, a difference of 0.090%).
| Demographics | Rating | Rank | Married-couple Households |
| Australians | 89.0 /100 | #125 | Excellent 47.4% |
| Pakistanis | 88.6 /100 | #126 | Excellent 47.3% |
| Celtics | 88.1 /100 | #127 | Excellent 47.3% |
| Immigrants from Peru | 87.9 /100 | #128 | Excellent 47.3% |
| Immigrants from Iraq | 87.8 /100 | #129 | Excellent 47.3% |
| Immigrants from Hungary | 87.8 /100 | #130 | Excellent 47.3% |
| Immigrants from Denmark | 87.5 /100 | #131 | Excellent 47.3% |
| Immigrants from Ukraine | 86.7 /100 | #132 | Excellent 47.3% |
| South Africans | 86.4 /100 | #133 | Excellent 47.3% |
| Immigrants from Greece | 86.0 /100 | #134 | Excellent 47.2% |
| Immigrants from Argentina | 86.0 /100 | #135 | Excellent 47.2% |
| New Zealanders | 85.3 /100 | #136 | Excellent 47.2% |
| Immigrants from Malaysia | 85.2 /100 | #137 | Excellent 47.2% |
| Immigrants from Afghanistan | 85.1 /100 | #138 | Excellent 47.2% |
| Immigrants from Sweden | 84.7 /100 | #139 | Excellent 47.2% |
Immigrants from Ukraine Married-couple Households Correlation Summary
| Measurement | Immigrants from Ukraine Data | Married-couple Households Data |
| Minimum | 0.080% | 24.1% |
| Maximum | 88.9% | 78.6% |
| Range | 88.8% | 54.4% |
| Mean | 9.2% | 52.3% |
| Median | 5.6% | 50.8% |
| Interquartile 25% (IQ1) | 2.7% | 48.3% |
| Interquartile 75% (IQ3) | 10.5% | 55.7% |
| Interquartile Range (IQR) | 7.7% | 7.5% |
| Standard Deviation (Sample) | 14.6% | 10.7% |
| Standard Deviation (Population) | 14.4% | 10.6% |
Correlation Details
| Immigrants from Ukraine Percentile | Sample Size | Married-couple Households |
[ 0.0% - 0.5% ] 0.080% | 215,888,877 | 45.9% |
[ 0.0% - 0.5% ] 0.35% | 38,175,610 | 46.4% |
[ 0.5% - 1.0% ] 0.66% | 20,487,921 | 44.2% |
[ 0.5% - 1.0% ] 0.86% | 4,318,549 | 51.3% |
[ 1.0% - 1.5% ] 1.12% | 3,256,467 | 49.2% |
[ 1.0% - 1.5% ] 1.36% | 1,566,456 | 49.9% |
[ 1.5% - 2.0% ] 1.62% | 1,363,828 | 49.5% |
[ 1.5% - 2.0% ] 1.88% | 1,082,207 | 50.8% |
[ 2.0% - 2.5% ] 2.16% | 613,802 | 50.1% |
[ 2.0% - 2.5% ] 2.37% | 486,492 | 48.6% |
[ 2.5% - 3.0% ] 2.61% | 368,009 | 53.1% |
[ 2.5% - 3.0% ] 2.89% | 228,394 | 54.0% |
[ 3.0% - 3.5% ] 3.10% | 386,897 | 52.3% |
[ 3.0% - 3.5% ] 3.35% | 104,155 | 51.9% |
[ 3.5% - 4.0% ] 3.59% | 75,880 | 48.7% |
[ 3.5% - 4.0% ] 3.92% | 74,825 | 55.6% |
[ 4.0% - 4.5% ] 4.11% | 128,262 | 48.8% |
[ 4.0% - 4.5% ] 4.38% | 119,686 | 48.0% |
[ 4.5% - 5.0% ] 4.60% | 106,622 | 46.9% |
[ 4.5% - 5.0% ] 4.93% | 55,615 | 49.6% |
[ 5.0% - 5.5% ] 5.12% | 116,296 | 44.5% |
[ 5.0% - 5.5% ] 5.27% | 83,452 | 49.2% |
[ 5.5% - 6.0% ] 5.62% | 169,690 | 55.0% |
[ 5.5% - 6.0% ] 5.91% | 91,635 | 50.1% |
[ 6.0% - 6.5% ] 6.14% | 4,479 | 56.2% |
[ 6.0% - 6.5% ] 6.46% | 89,424 | 52.6% |
[ 6.5% - 7.0% ] 6.52% | 47,698 | 55.9% |
[ 7.0% - 7.5% ] 7.05% | 1,007 | 58.2% |
[ 7.5% - 8.0% ] 7.72% | 1,463 | 78.2% |
[ 7.5% - 8.0% ] 7.88% | 1,370 | 75.3% |
[ 8.0% - 8.5% ] 8.31% | 8,388 | 59.0% |
[ 8.5% - 9.0% ] 8.90% | 1,168 | 72.5% |
[ 9.0% - 9.5% ] 9.22% | 900 | 72.5% |
[ 10.0% - 10.5% ] 10.19% | 648 | 41.2% |
[ 10.5% - 11.0% ] 10.77% | 492 | 53.6% |
[ 11.0% - 11.5% ] 11.18% | 152 | 28.8% |
[ 11.5% - 12.0% ] 11.56% | 744 | 49.6% |
[ 13.5% - 14.0% ] 13.63% | 47,893 | 35.3% |
[ 13.5% - 14.0% ] 13.87% | 382 | 56.6% |
[ 14.0% - 14.5% ] 14.05% | 1,822 | 24.1% |
[ 15.0% - 15.5% ] 15.48% | 84,933 | 46.8% |
[ 16.0% - 16.5% ] 16.50% | 491 | 51.7% |
[ 19.5% - 20.0% ] 19.67% | 300 | 51.6% |
[ 50.0% - 50.5% ] 50.00% | 42 | 60.0% |
[ 88.5% - 89.0% ] 88.89% | 27 | 78.6% |