Immigrants from Poland Disability

COMPARE

Immigrants from Poland
Race
Ancestry
AfghanAfricanAlaska NativeAlaskan AthabascanAlbanianAleutAlsatianAmericanApacheArabArapahoArgentineanArmenianAssyrian/Chaldean/SyriacAustralianAustrianBahamianBangladeshiBarbadianBasqueBelgianBelizeanBermudanBhutaneseBlackfeetBolivianBrazilianBritishBritish West IndianBulgarianBurmeseCajunCambodianCanadianCape VerdeanCarpatho RusynCelticCentral AmericanCentral American IndianCherokeeCheyenneChickasawChileanChineseChippewaChoctawColombianColvilleComancheCosta RicanCreeCreekCroatianCrowCubanCypriotCzechCzechoslovakianDanishDelawareDominicanDutchDutch West IndianEastern EuropeanEcuadorianEgyptianEnglishEstonianEthiopianEuropeanFijianFilipinoFinnishFrenchFrench American IndianFrench CanadianGermanGerman RussianGhanaianGreekGuamanian/ChamorroGuatemalanGuyaneseHaitianHmongHonduranHopiHoumaHungarianIcelanderIndian (Asian)IndonesianInupiatIranianIraqiIrishIroquoisIsraeliItalianJamaicanJapaneseJordanianKenyanKiowaKoreanLaotianLatvianLebaneseLiberianLithuanianLumbeeLuxembourgerMacedonianMalaysianMalteseMarshalleseMenomineeMexicanMexican American IndianMongolianMoroccanNative HawaiianNavajoNepaleseNew ZealanderNicaraguanNigerianNorthern EuropeanNorwegianOkinawanOsageOttawaPaiutePakistaniPalestinianPanamanianParaguayanPennsylvania GermanPeruvianPimaPolishPortuguesePotawatomiPuebloPuerto RicanPuget Sound SalishRomanianRussianSalvadoranSamoanScandinavianScotch-IrishScottishSeminoleSenegaleseSerbianShoshoneSierra LeoneanSiouxSlavicSlovakSloveneSomaliSouth AfricanSouth AmericanSouth American IndianSoviet UnionSpaniardSpanishSpanish AmericanSpanish American IndianSri LankanSubsaharan AfricanSudaneseSwedishSwissSyrianTaiwaneseThaiTlingit-HaidaTohono O'OdhamTonganTrinidadian and TobagonianTsimshianTurkishU.S. Virgin IslanderUgandanUkrainianUruguayanUteVenezuelanVietnameseWelshWest IndianYakamaYaquiYugoslavianYumanYup'ikZimbabwean
Immigration
NonimmigrantsImmigrantsAfghanistanAfricaAlbaniaArgentinaArmeniaAsiaAustraliaAustriaBahamasBangladeshBarbadosBelarusBelgiumBelizeBoliviaBosnia and HerzegovinaBrazilBulgariaBurma/MyanmarCabo VerdeCambodiaCameroonCanadaCaribbeanCentral AmericaChileChinaColombiaCongoCosta RicaCroatiaCubaCzechoslovakiaDenmarkDominicaDominican RepublicEastern AfricaEastern AsiaEastern EuropeEcuadorEgyptEl SalvadorEnglandEritreaEthiopiaEuropeFijiFranceGermanyGhanaGreeceGrenadaGuatemalaGuyanaHaitiHondurasHong KongHungaryIndiaIndonesiaIranIraqIrelandIsraelItalyJamaicaJapanJordanKazakhstanKenyaKoreaKuwaitLaosLatin AmericaLatviaLebanonLiberiaLithuaniaMalaysiaMexicoMicronesiaMiddle AfricaMoldovaMoroccoNepalNetherlandsNicaraguaNigeriaNorth AmericaNorth MacedoniaNorthern AfricaNorthern EuropeNorwayOceaniaPakistanPanamaPeruPhilippinesPolandPortugalRomaniaRussiaSaudi ArabiaScotlandSenegalSerbiaSierra LeoneSingaporeSomaliaSouth AfricaSouth AmericaSouth Central AsiaSouth Eastern AsiaSouthern EuropeSpainSri LankaSt. Vincent and the GrenadinesSudanSwedenSwitzerlandSyriaTaiwanThailandTrinidad and TobagoTurkeyUgandaUkraineUruguayUzbekistanVenezuelaVietnamWest IndiesWestern AfricaWestern AsiaWestern EuropeYemenZaireZimbabweAzores
Select to Compare
Race
Ancestry
AfghanAfricanAlaska NativeAlaskan AthabascanAlbanianAleutAlsatianAmericanApacheArabArapahoArgentineanArmenianAssyrian/Chaldean/SyriacAustralianAustrianBahamianBangladeshiBarbadianBasqueBelgianBelizeanBermudanBhutaneseBlackfeetBolivianBrazilianBritishBritish West IndianBulgarianBurmeseCajunCambodianCanadianCape VerdeanCarpatho RusynCelticCentral AmericanCentral American IndianCherokeeCheyenneChickasawChileanChineseChippewaChoctawColombianColvilleComancheCosta RicanCreeCreekCroatianCrowCubanCypriotCzechCzechoslovakianDanishDelawareDominicanDutchDutch West IndianEastern EuropeanEcuadorianEgyptianEnglishEstonianEthiopianEuropeanFijianFilipinoFinnishFrenchFrench American IndianFrench CanadianGermanGerman RussianGhanaianGreekGuamanian/ChamorroGuatemalanGuyaneseHaitianHmongHonduranHopiHoumaHungarianIcelanderIndian (Asian)IndonesianInupiatIranianIraqiIrishIroquoisIsraeliItalianJamaicanJapaneseJordanianKenyanKiowaKoreanLaotianLatvianLebaneseLiberianLithuanianLumbeeLuxembourgerMacedonianMalaysianMalteseMarshalleseMenomineeMexicanMexican American IndianMongolianMoroccanNative HawaiianNavajoNepaleseNew ZealanderNicaraguanNigerianNorthern EuropeanNorwegianOkinawanOsageOttawaPaiutePakistaniPalestinianPanamanianParaguayanPennsylvania GermanPeruvianPimaPolishPortuguesePotawatomiPuebloPuerto RicanPuget Sound SalishRomanianRussianSalvadoranSamoanScandinavianScotch-IrishScottishSeminoleSenegaleseSerbianShoshoneSierra LeoneanSiouxSlavicSlovakSloveneSomaliSouth AfricanSouth AmericanSouth American IndianSoviet UnionSpaniardSpanishSpanish AmericanSpanish American IndianSri LankanSubsaharan AfricanSudaneseSwedishSwissSyrianTaiwaneseThaiTlingit-HaidaTohono O'OdhamTonganTrinidadian and TobagonianTsimshianTurkishU.S. Virgin IslanderUgandanUkrainianUruguayanUteVenezuelanVietnameseWelshWest IndianYakamaYaquiYugoslavianYumanYup'ikZimbabwean
Immigration
NonimmigrantsImmigrantsAfghanistanAfricaAlbaniaArgentinaArmeniaAsiaAustraliaAustriaBahamasBangladeshBarbadosBelarusBelgiumBelizeBoliviaBosnia and HerzegovinaBrazilBulgariaBurma/MyanmarCabo VerdeCambodiaCameroonCanadaCaribbeanCentral AmericaChileChinaColombiaCongoCosta RicaCroatiaCubaCzechoslovakiaDenmarkDominicaDominican RepublicEastern AfricaEastern AsiaEastern EuropeEcuadorEgyptEl SalvadorEnglandEritreaEthiopiaEuropeFijiFranceGermanyGhanaGreeceGrenadaGuatemalaGuyanaHaitiHondurasHong KongHungaryIndiaIndonesiaIranIraqIrelandIsraelItalyJamaicaJapanJordanKazakhstanKenyaKoreaKuwaitLaosLatin AmericaLatviaLebanonLiberiaLithuaniaMalaysiaMexicoMicronesiaMiddle AfricaMoldovaMoroccoNepalNetherlandsNicaraguaNigeriaNorth AmericaNorth MacedoniaNorthern AfricaNorthern EuropeNorwayOceaniaPakistanPanamaPeruPhilippinesPortugalRomaniaRussiaSaudi ArabiaScotlandSenegalSerbiaSierra LeoneSingaporeSomaliaSouth AfricaSouth AmericaSouth Central AsiaSouth Eastern AsiaSouthern EuropeSpainSri LankaSt. Vincent and the GrenadinesSudanSwedenSwitzerlandSyriaTaiwanThailandTrinidad and TobagoTurkeyUgandaUkraineUruguayUzbekistanVenezuelaVietnamWest IndiesWestern AfricaWestern AsiaWestern EuropeYemenZaireZimbabweAzores
Disability
Income
Poverty
Unemployment
Labor Participation
Family Structure
Vehicle Availability
Education Level
Disability

Immigrants from Poland Disability
Exceptional

11.1%
DISABILITY
99.1/ 100
METRIC RATING
81st/ 347
METRIC RANK

Immigrants from Poland Disability Correlation Chart

The statistical analysis conducted on geographies consisting of 304,838,062 people shows a substantial positive correlation between the proportion of Immigrants from Poland and percentage of population with a disability in the United States with a correlation coefficient (R) of 0.530 and weighted average of 11.1%. On average, for every 1% (one percent) increase in Immigrants from Poland within a typical geography, there is an increase of 0.40% in percentage of population with a disability.
Immigrants from Poland Disability
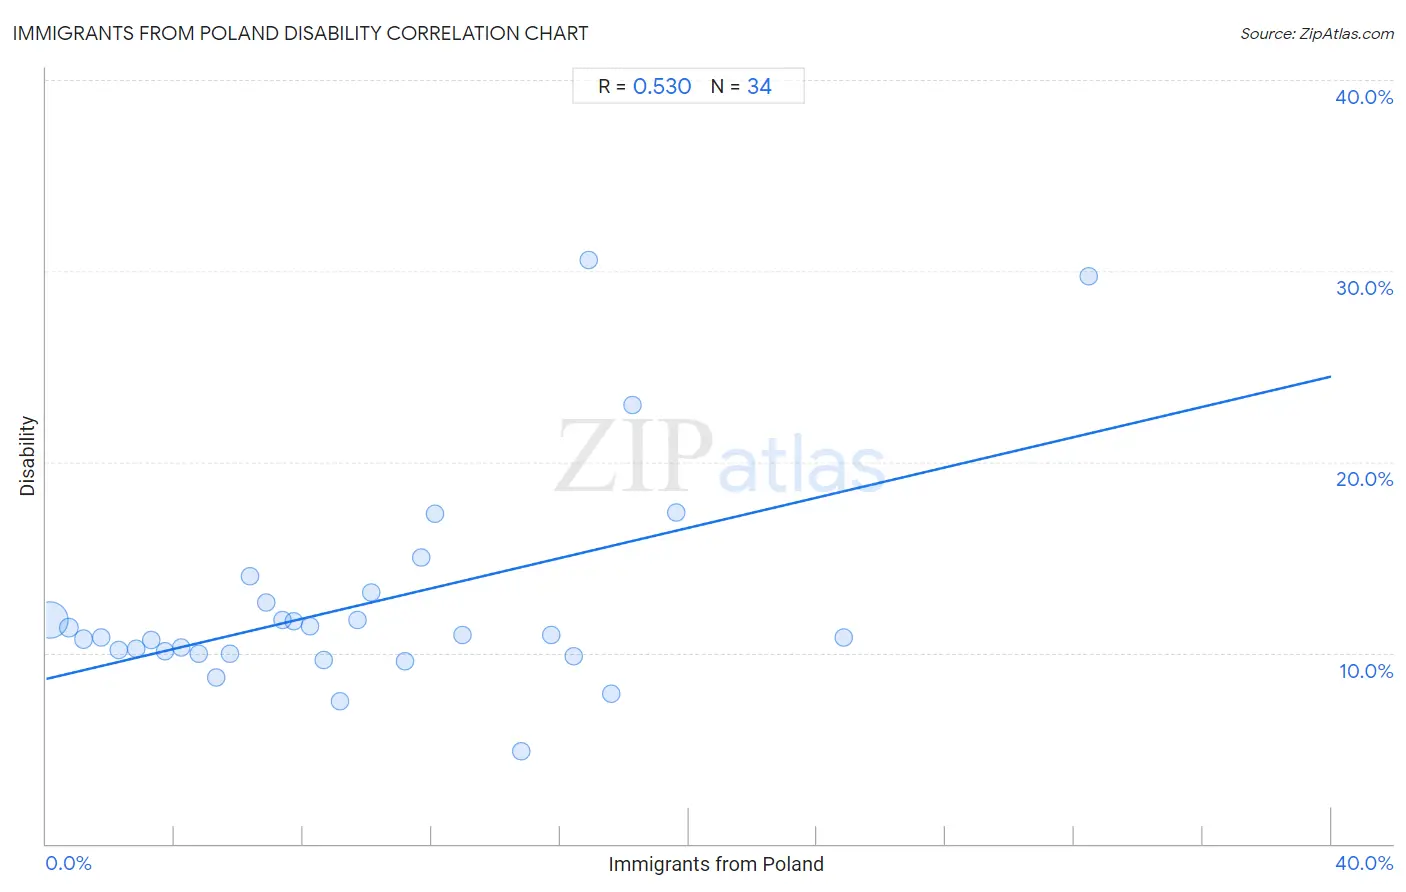
It is essential to understand that the correlation between the percentage of Immigrants from Poland and percentage of population with a disability does not imply a direct cause-and-effect relationship. It remains uncertain whether the presence of Immigrants from Poland influences an upward or downward trend in the level of percentage of population with a disability within an area, or if Immigrants from Poland simply ended up residing in those areas with higher or lower levels of percentage of population with a disability due to other factors.

Demographics Similar to Immigrants from Poland by Disability

In terms of disability, the demographic groups most similar to Immigrants from Poland are Chilean (11.1%, a difference of 0.050%), Immigrants from Switzerland (11.1%, a difference of 0.080%), Immigrants from Sierra Leone (11.1%, a difference of 0.090%), Immigrants from Belarus (11.1%, a difference of 0.24%), and Immigrants from Russia (11.1%, a difference of 0.24%).
DemographicsRating | RankDisability
Immigrants from Serbia
99.4
/100
|
#74
Exceptional
11.0%
Immigrants from Vietnam
99.4
/100
|
#75
Exceptional
11.0%
Sierra Leoneans
99.3
/100
|
#76
Exceptional
11.0%
Immigrants from Belgium
99.3
/100
|
#77
Exceptional
11.0%
Immigrants from Cameroon
99.3
/100
|
#78
Exceptional
11.1%
Immigrants from Jordan
99.3
/100
|
#79
Exceptional
11.1%
Immigrants from Ireland
99.3
/100
|
#80
Exceptional
11.1%
Immigrants from Poland
99.1
/100
|
#81
Exceptional
11.1%
Chileans
99.1
/100
|
#82
Exceptional
11.1%
Immigrants from Switzerland
99.0
/100
|
#83
Exceptional
11.1%
Immigrants from Sierra Leone
99.0
/100
|
#84
Exceptional
11.1%
Immigrants from Belarus
98.9
/100
|
#85
Exceptional
11.1%
Immigrants from Russia
98.9
/100
|
#86
Exceptional
11.1%
Palestinians
98.9
/100
|
#87
Exceptional
11.1%
Immigrants from Romania
98.5
/100
|
#88
Exceptional
11.2%

Immigrants from Poland Disability Correlation Summary

MeasurementImmigrants from Poland DataDisability Data
Minimum0.11%4.8%
Maximum32.4%30.6%
Range32.3%25.7%
Mean9.8%12.5%
Median8.4%10.9%
Interquartile 25% (IQ1)4.2%10.0%
Interquartile 75% (IQ3)14.8%12.6%
Interquartile Range (IQR)10.6%2.7%
Standard Deviation (Sample)7.3%5.5%
Standard Deviation (Population)7.2%5.4%

Correlation Details

Immigrants from Poland PercentileSample SizeDisability
[
0.0%
-
0.5%
]
0.11%
277,046,45511.7%
[
0.5%
-
1.0%
]
0.69%
14,801,07411.3%
[
1.0%
-
1.5%
]
1.15%
6,723,04510.7%
[
1.5%
-
2.0%
]
1.72%
1,501,42210.8%
[
2.0%
-
2.5%
]
2.26%
910,67410.1%
[
2.5%
-
3.0%
]
2.81%
872,04510.2%
[
3.0%
-
3.5%
]
3.27%
546,82510.6%
[
3.5%
-
4.0%
]
3.69%
320,27510.1%
[
4.0%
-
4.5%
]
4.22%
509,51910.3%
[
4.5%
-
5.0%
]
4.76%
120,6729.9%
[
5.0%
-
5.5%
]
5.30%
211,7568.7%
[
5.5%
-
6.0%
]
5.72%
271,36710.0%
[
6.0%
-
6.5%
]
6.33%
120,28014.0%
[
6.5%
-
7.0%
]
6.85%
73,10012.6%
[
7.0%
-
7.5%
]
7.35%
26,01111.7%
[
7.5%
-
8.0%
]
7.70%
77,89711.7%
[
8.0%
-
8.5%
]
8.20%
71,75311.4%
[
8.5%
-
9.0%
]
8.62%
168,6379.6%
[
9.0%
-
9.5%
]
9.14%
59,5307.5%
[
9.5%
-
10.0%
]
9.70%
48,30811.7%
[
10.0%
-
10.5%
]
10.11%
1,70213.2%
[
11.0%
-
11.5%
]
11.15%
208,3569.6%
[
11.5%
-
12.0%
]
11.68%
36,55615.0%
[
12.0%
-
12.5%
]
12.09%
1,71217.3%
[
12.5%
-
13.0%
]
12.96%
12,52510.9%
[
14.5%
-
15.0%
]
14.78%
23,2004.8%
[
15.5%
-
16.0%
]
15.72%
15,29111.0%
[
16.0%
-
16.5%
]
16.40%
24,2339.8%
[
16.5%
-
17.0%
]
16.91%
55630.6%
[
17.5%
-
18.0%
]
17.58%
8,9427.9%
[
18.0%
-
18.5%
]
18.25%
27423.0%
[
19.5%
-
20.0%
]
19.61%
35717.4%
[
24.5%
-
25.0%
]
24.82%
23,67610.8%
[
32.0%
-
32.5%
]
32.43%
3729.7%