Immigrants from Poland Disability Age Under 5
COMPARE
Immigrants from Poland
Select to Compare
Disability Age Under 5
Immigrants from Poland Disability Age Under 5
1.3%
DISABILITY | AGE UNDER 5
22.4/ 100
METRIC RATING
206th/ 347
METRIC RANK
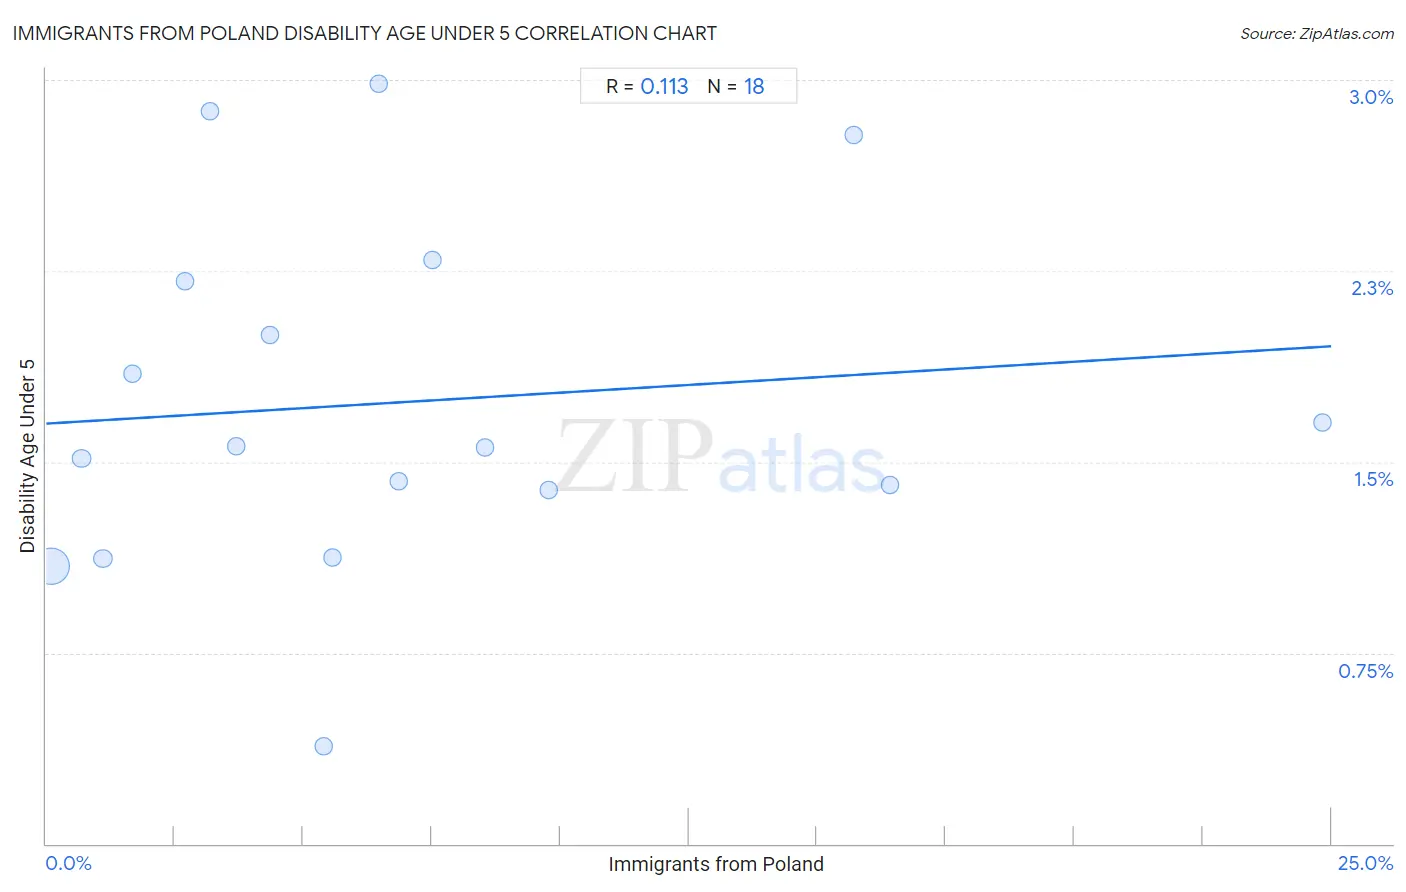
Immigrants from Poland Disability Age Under 5 Correlation Chart
The statistical analysis conducted on geographies consisting of 173,203,351 people shows a poor positive correlation between the proportion of Immigrants from Poland and percentage of population with a disability under the age of 5 in the United States with a correlation coefficient (R) of 0.113 and weighted average of 1.3%. On average, for every 1% (one percent) increase in Immigrants from Poland within a typical geography, there is an increase of 0.012% in percentage of population with a disability under the age of 5.
It is essential to understand that the correlation between the percentage of Immigrants from Poland and percentage of population with a disability under the age of 5 does not imply a direct cause-and-effect relationship. It remains uncertain whether the presence of Immigrants from Poland influences an upward or downward trend in the level of percentage of population with a disability under the age of 5 within an area, or if Immigrants from Poland simply ended up residing in those areas with higher or lower levels of percentage of population with a disability under the age of 5 due to other factors.
Demographics Similar to Immigrants from Poland by Disability Age Under 5
In terms of disability age under 5, the demographic groups most similar to Immigrants from Poland are Romanian (1.3%, a difference of 0.020%), Nigerian (1.3%, a difference of 0.15%), Immigrants from Europe (1.3%, a difference of 0.16%), Liberian (1.3%, a difference of 0.20%), and Mexican (1.3%, a difference of 0.21%).
| Demographics | Rating | Rank | Disability Age Under 5 |
| Jamaicans | 30.7 /100 | #199 | Fair 1.3% |
| Immigrants from Lithuania | 27.2 /100 | #200 | Fair 1.3% |
| Immigrants from Italy | 25.4 /100 | #201 | Fair 1.3% |
| Arapaho | 24.1 /100 | #202 | Fair 1.3% |
| Liberians | 24.0 /100 | #203 | Fair 1.3% |
| Immigrants from Europe | 23.6 /100 | #204 | Fair 1.3% |
| Romanians | 22.5 /100 | #205 | Fair 1.3% |
| Immigrants from Poland | 22.4 /100 | #206 | Fair 1.3% |
| Nigerians | 21.2 /100 | #207 | Fair 1.3% |
| Mexicans | 20.8 /100 | #208 | Fair 1.3% |
| Bulgarians | 19.5 /100 | #209 | Poor 1.3% |
| Pakistanis | 19.4 /100 | #210 | Poor 1.3% |
| Immigrants from Greece | 19.1 /100 | #211 | Poor 1.3% |
| Chileans | 18.8 /100 | #212 | Poor 1.3% |
| Immigrants from Sudan | 18.7 /100 | #213 | Poor 1.3% |
Immigrants from Poland Disability Age Under 5 Correlation Summary
| Measurement | Immigrants from Poland Data | Disability Age Under 5 Data |
| Minimum | 0.10% | 0.38% |
| Maximum | 24.8% | 3.0% |
| Range | 24.7% | 2.6% |
| Mean | 6.9% | 1.7% |
| Median | 5.5% | 1.6% |
| Interquartile 25% (IQ1) | 2.7% | 1.4% |
| Interquartile 75% (IQ3) | 8.5% | 2.2% |
| Interquartile Range (IQR) | 5.8% | 0.82% |
| Standard Deviation (Sample) | 6.4% | 0.69% |
| Standard Deviation (Population) | 6.2% | 0.67% |
Correlation Details
| Immigrants from Poland Percentile | Sample Size | Disability Age Under 5 |
[ 0.0% - 0.5% ] 0.10% | 162,969,199 | 1.1% |
[ 0.5% - 1.0% ] 0.68% | 5,307,419 | 1.5% |
[ 1.0% - 1.5% ] 1.10% | 3,661,462 | 1.1% |
[ 1.5% - 2.0% ] 1.67% | 233,264 | 1.8% |
[ 2.5% - 3.0% ] 2.70% | 173,839 | 2.2% |
[ 3.0% - 3.5% ] 3.19% | 22,435 | 2.9% |
[ 3.5% - 4.0% ] 3.69% | 109,983 | 1.6% |
[ 4.0% - 4.5% ] 4.35% | 214,686 | 2.0% |
[ 5.0% - 5.5% ] 5.41% | 116,676 | 0.38% |
[ 5.5% - 6.0% ] 5.58% | 61,988 | 1.1% |
[ 6.0% - 6.5% ] 6.48% | 74,212 | 3.0% |
[ 6.5% - 7.0% ] 6.86% | 71,482 | 1.4% |
[ 7.5% - 8.0% ] 7.52% | 30,857 | 2.3% |
[ 8.5% - 9.0% ] 8.53% | 58,244 | 1.6% |
[ 9.5% - 10.0% ] 9.77% | 34,405 | 1.4% |
[ 15.5% - 16.0% ] 15.72% | 15,291 | 2.8% |
[ 16.0% - 16.5% ] 16.40% | 24,233 | 1.4% |
[ 24.5% - 25.0% ] 24.82% | 23,676 | 1.7% |