Immigrants from Poland Self-Care Disability

COMPARE

Immigrants from Poland
Race
Ancestry
AfghanAfricanAlaska NativeAlaskan AthabascanAlbanianAleutAlsatianAmericanApacheArabArapahoArgentineanArmenianAssyrian/Chaldean/SyriacAustralianAustrianBahamianBangladeshiBarbadianBasqueBelgianBelizeanBermudanBhutaneseBlackfeetBolivianBrazilianBritishBritish West IndianBulgarianBurmeseCajunCambodianCanadianCape VerdeanCarpatho RusynCelticCentral AmericanCentral American IndianCherokeeCheyenneChickasawChileanChineseChippewaChoctawColombianColvilleComancheCosta RicanCreeCreekCroatianCrowCubanCypriotCzechCzechoslovakianDanishDelawareDominicanDutchDutch West IndianEastern EuropeanEcuadorianEgyptianEnglishEstonianEthiopianEuropeanFijianFilipinoFinnishFrenchFrench American IndianFrench CanadianGermanGerman RussianGhanaianGreekGuamanian/ChamorroGuatemalanGuyaneseHaitianHmongHonduranHopiHoumaHungarianIcelanderIndian (Asian)IndonesianInupiatIranianIraqiIrishIroquoisIsraeliItalianJamaicanJapaneseJordanianKenyanKiowaKoreanLaotianLatvianLebaneseLiberianLithuanianLumbeeLuxembourgerMacedonianMalaysianMalteseMarshalleseMenomineeMexicanMexican American IndianMongolianMoroccanNative HawaiianNavajoNepaleseNew ZealanderNicaraguanNigerianNorthern EuropeanNorwegianOkinawanOsageOttawaPaiutePakistaniPalestinianPanamanianParaguayanPennsylvania GermanPeruvianPimaPolishPortuguesePotawatomiPuebloPuerto RicanPuget Sound SalishRomanianRussianSalvadoranSamoanScandinavianScotch-IrishScottishSeminoleSenegaleseSerbianShoshoneSierra LeoneanSiouxSlavicSlovakSloveneSomaliSouth AfricanSouth AmericanSouth American IndianSoviet UnionSpaniardSpanishSpanish AmericanSpanish American IndianSri LankanSubsaharan AfricanSudaneseSwedishSwissSyrianTaiwaneseThaiTlingit-HaidaTohono O'OdhamTonganTrinidadian and TobagonianTsimshianTurkishU.S. Virgin IslanderUgandanUkrainianUruguayanUteVenezuelanVietnameseWelshWest IndianYakamaYaquiYugoslavianYumanYup'ikZimbabwean
Immigration
NonimmigrantsImmigrantsAfghanistanAfricaAlbaniaArgentinaArmeniaAsiaAustraliaAustriaBahamasBangladeshBarbadosBelarusBelgiumBelizeBoliviaBosnia and HerzegovinaBrazilBulgariaBurma/MyanmarCabo VerdeCambodiaCameroonCanadaCaribbeanCentral AmericaChileChinaColombiaCongoCosta RicaCroatiaCubaCzechoslovakiaDenmarkDominicaDominican RepublicEastern AfricaEastern AsiaEastern EuropeEcuadorEgyptEl SalvadorEnglandEritreaEthiopiaEuropeFijiFranceGermanyGhanaGreeceGrenadaGuatemalaGuyanaHaitiHondurasHong KongHungaryIndiaIndonesiaIranIraqIrelandIsraelItalyJamaicaJapanJordanKazakhstanKenyaKoreaKuwaitLaosLatin AmericaLatviaLebanonLiberiaLithuaniaMalaysiaMexicoMicronesiaMiddle AfricaMoldovaMoroccoNepalNetherlandsNicaraguaNigeriaNorth AmericaNorth MacedoniaNorthern AfricaNorthern EuropeNorwayOceaniaPakistanPanamaPeruPhilippinesPolandPortugalRomaniaRussiaSaudi ArabiaScotlandSenegalSerbiaSierra LeoneSingaporeSomaliaSouth AfricaSouth AmericaSouth Central AsiaSouth Eastern AsiaSouthern EuropeSpainSri LankaSt. Vincent and the GrenadinesSudanSwedenSwitzerlandSyriaTaiwanThailandTrinidad and TobagoTurkeyUgandaUkraineUruguayUzbekistanVenezuelaVietnamWest IndiesWestern AfricaWestern AsiaWestern EuropeYemenZaireZimbabweAzores
Select to Compare
Race
Ancestry
AfghanAfricanAlaska NativeAlaskan AthabascanAlbanianAleutAlsatianAmericanApacheArabArapahoArgentineanArmenianAssyrian/Chaldean/SyriacAustralianAustrianBahamianBangladeshiBarbadianBasqueBelgianBelizeanBermudanBhutaneseBlackfeetBolivianBrazilianBritishBritish West IndianBulgarianBurmeseCajunCambodianCanadianCape VerdeanCarpatho RusynCelticCentral AmericanCentral American IndianCherokeeCheyenneChickasawChileanChineseChippewaChoctawColombianColvilleComancheCosta RicanCreeCreekCroatianCrowCubanCypriotCzechCzechoslovakianDanishDelawareDominicanDutchDutch West IndianEastern EuropeanEcuadorianEgyptianEnglishEstonianEthiopianEuropeanFijianFilipinoFinnishFrenchFrench American IndianFrench CanadianGermanGerman RussianGhanaianGreekGuamanian/ChamorroGuatemalanGuyaneseHaitianHmongHonduranHopiHoumaHungarianIcelanderIndian (Asian)IndonesianInupiatIranianIraqiIrishIroquoisIsraeliItalianJamaicanJapaneseJordanianKenyanKiowaKoreanLaotianLatvianLebaneseLiberianLithuanianLumbeeLuxembourgerMacedonianMalaysianMalteseMarshalleseMenomineeMexicanMexican American IndianMongolianMoroccanNative HawaiianNavajoNepaleseNew ZealanderNicaraguanNigerianNorthern EuropeanNorwegianOkinawanOsageOttawaPaiutePakistaniPalestinianPanamanianParaguayanPennsylvania GermanPeruvianPimaPolishPortuguesePotawatomiPuebloPuerto RicanPuget Sound SalishRomanianRussianSalvadoranSamoanScandinavianScotch-IrishScottishSeminoleSenegaleseSerbianShoshoneSierra LeoneanSiouxSlavicSlovakSloveneSomaliSouth AfricanSouth AmericanSouth American IndianSoviet UnionSpaniardSpanishSpanish AmericanSpanish American IndianSri LankanSubsaharan AfricanSudaneseSwedishSwissSyrianTaiwaneseThaiTlingit-HaidaTohono O'OdhamTonganTrinidadian and TobagonianTsimshianTurkishU.S. Virgin IslanderUgandanUkrainianUruguayanUteVenezuelanVietnameseWelshWest IndianYakamaYaquiYugoslavianYumanYup'ikZimbabwean
Immigration
NonimmigrantsImmigrantsAfghanistanAfricaAlbaniaArgentinaArmeniaAsiaAustraliaAustriaBahamasBangladeshBarbadosBelarusBelgiumBelizeBoliviaBosnia and HerzegovinaBrazilBulgariaBurma/MyanmarCabo VerdeCambodiaCameroonCanadaCaribbeanCentral AmericaChileChinaColombiaCongoCosta RicaCroatiaCubaCzechoslovakiaDenmarkDominicaDominican RepublicEastern AfricaEastern AsiaEastern EuropeEcuadorEgyptEl SalvadorEnglandEritreaEthiopiaEuropeFijiFranceGermanyGhanaGreeceGrenadaGuatemalaGuyanaHaitiHondurasHong KongHungaryIndiaIndonesiaIranIraqIrelandIsraelItalyJamaicaJapanJordanKazakhstanKenyaKoreaKuwaitLaosLatin AmericaLatviaLebanonLiberiaLithuaniaMalaysiaMexicoMicronesiaMiddle AfricaMoldovaMoroccoNepalNetherlandsNicaraguaNigeriaNorth AmericaNorth MacedoniaNorthern AfricaNorthern EuropeNorwayOceaniaPakistanPanamaPeruPhilippinesPortugalRomaniaRussiaSaudi ArabiaScotlandSenegalSerbiaSierra LeoneSingaporeSomaliaSouth AfricaSouth AmericaSouth Central AsiaSouth Eastern AsiaSouthern EuropeSpainSri LankaSt. Vincent and the GrenadinesSudanSwedenSwitzerlandSyriaTaiwanThailandTrinidad and TobagoTurkeyUgandaUkraineUruguayUzbekistanVenezuelaVietnamWest IndiesWestern AfricaWestern AsiaWestern EuropeYemenZaireZimbabweAzores
Self-Care Disability
Income
Poverty
Unemployment
Labor Participation
Family Structure
Vehicle Availability
Education Level
Disability

Immigrants from Poland Self-Care Disability
Exceptional

2.4%
SELF-CARE DISABILITY
96.4/ 100
METRIC RATING
98th/ 347
METRIC RANK

Immigrants from Poland Self-Care Disability Correlation Chart

The statistical analysis conducted on geographies consisting of 304,690,166 people shows a weak positive correlation between the proportion of Immigrants from Poland and percentage of population with self-care disability in the United States with a correlation coefficient (R) of 0.251 and weighted average of 2.4%. On average, for every 1% (one percent) increase in Immigrants from Poland within a typical geography, there is an increase of 0.031% in percentage of population with self-care disability.
Immigrants from Poland Self-Care Disability
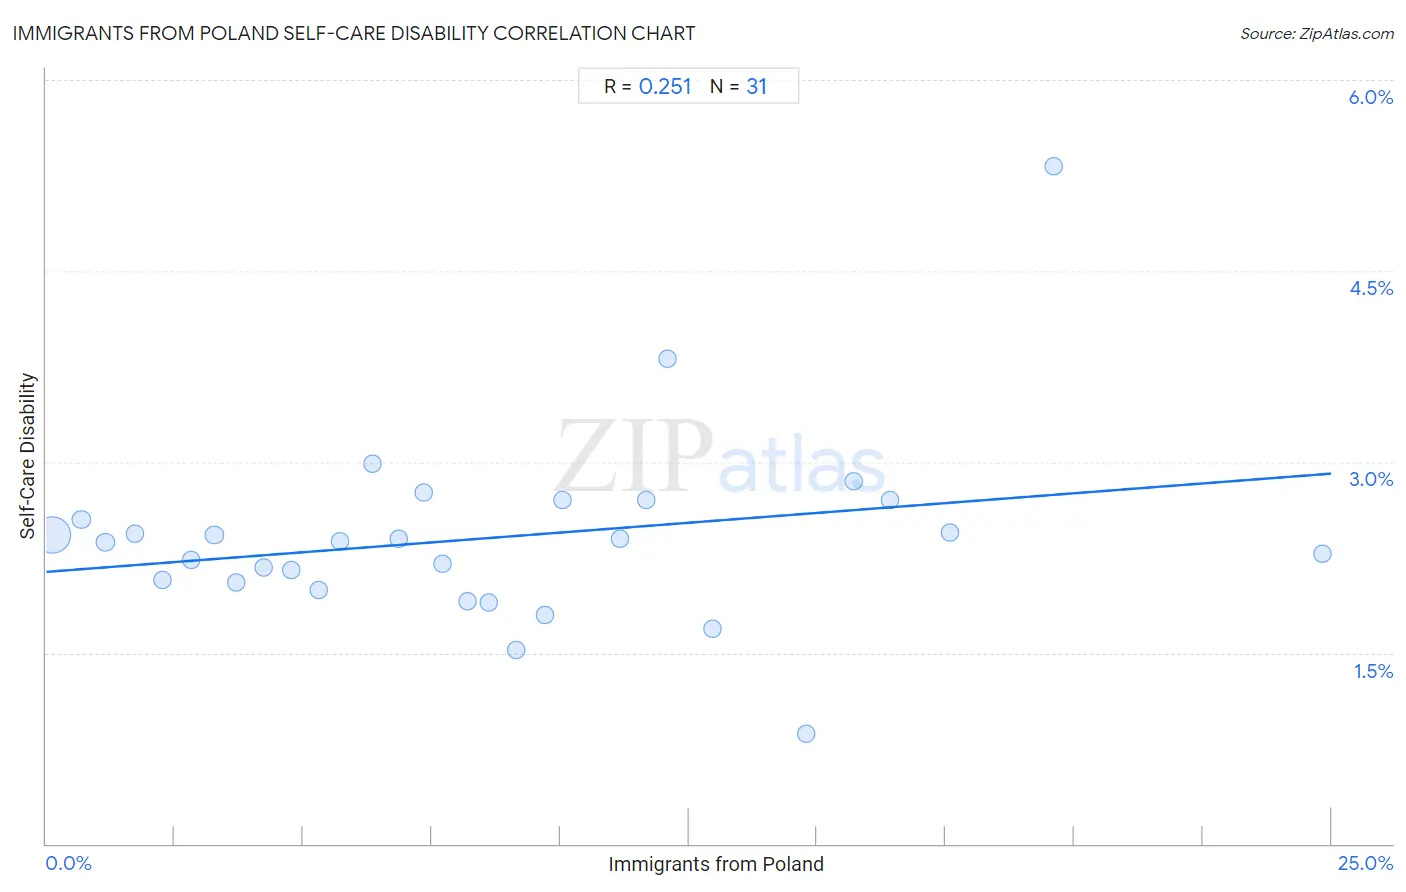
It is essential to understand that the correlation between the percentage of Immigrants from Poland and percentage of population with self-care disability does not imply a direct cause-and-effect relationship. It remains uncertain whether the presence of Immigrants from Poland influences an upward or downward trend in the level of percentage of population with self-care disability within an area, or if Immigrants from Poland simply ended up residing in those areas with higher or lower levels of percentage of population with self-care disability due to other factors.

Demographics Similar to Immigrants from Poland by Self-Care Disability

In terms of self-care disability, the demographic groups most similar to Immigrants from Poland are Immigrants from Israel (2.4%, a difference of 0.080%), Swiss (2.4%, a difference of 0.090%), Immigrants from Chile (2.4%, a difference of 0.14%), European (2.4%, a difference of 0.18%), and Immigrants from Asia (2.4%, a difference of 0.19%).
DemographicsRating | RankSelf-Care Disability
Immigrants from Jordan
97.7
/100
|
#91
Exceptional
2.4%
Icelanders
97.4
/100
|
#92
Exceptional
2.4%
Immigrants from Latvia
97.0
/100
|
#93
Exceptional
2.4%
Macedonians
96.9
/100
|
#94
Exceptional
2.4%
Immigrants from Asia
96.9
/100
|
#95
Exceptional
2.4%
Immigrants from Chile
96.7
/100
|
#96
Exceptional
2.4%
Swiss
96.6
/100
|
#97
Exceptional
2.4%
Immigrants from Poland
96.4
/100
|
#98
Exceptional
2.4%
Immigrants from Israel
96.1
/100
|
#99
Exceptional
2.4%
Europeans
95.8
/100
|
#100
Exceptional
2.4%
Immigrants from Scotland
95.7
/100
|
#101
Exceptional
2.4%
Croatians
95.0
/100
|
#102
Exceptional
2.4%
Alsatians
94.9
/100
|
#103
Exceptional
2.4%
Bhutanese
94.5
/100
|
#104
Exceptional
2.4%
Carpatho Rusyns
94.4
/100
|
#105
Exceptional
2.4%

Immigrants from Poland Self-Care Disability Correlation Summary

MeasurementImmigrants from Poland DataSelf-Care Disability Data
Minimum0.11%0.86%
Maximum24.8%5.3%
Range24.7%4.5%
Mean8.6%2.4%
Median7.7%2.4%
Interquartile 25% (IQ1)3.7%2.1%
Interquartile 75% (IQ3)12.1%2.7%
Interquartile Range (IQR)8.4%0.65%
Standard Deviation (Sample)6.0%0.74%
Standard Deviation (Population)5.9%0.73%

Correlation Details

Immigrants from Poland PercentileSample SizeSelf-Care Disability
[
0.0%
-
0.5%
]
0.11%
276,983,5242.4%
[
0.5%
-
1.0%
]
0.69%
14,772,9872.5%
[
1.0%
-
1.5%
]
1.15%
6,704,1022.4%
[
1.5%
-
2.0%
]
1.72%
1,481,5362.4%
[
2.0%
-
2.5%
]
2.26%
908,6512.1%
[
2.5%
-
3.0%
]
2.81%
869,4862.2%
[
3.0%
-
3.5%
]
3.27%
542,4492.4%
[
3.5%
-
4.0%
]
3.69%
320,2212.1%
[
4.0%
-
4.5%
]
4.22%
508,7282.2%
[
4.5%
-
5.0%
]
4.76%
118,9012.1%
[
5.0%
-
5.5%
]
5.30%
211,7562.0%
[
5.5%
-
6.0%
]
5.72%
271,1502.4%
[
6.0%
-
6.5%
]
6.34%
118,9363.0%
[
6.5%
-
7.0%
]
6.86%
71,7502.4%
[
7.0%
-
7.5%
]
7.35%
25,8582.8%
[
7.5%
-
8.0%
]
7.70%
77,5952.2%
[
8.0%
-
8.5%
]
8.20%
70,1771.9%
[
8.5%
-
9.0%
]
8.62%
168,6371.9%
[
9.0%
-
9.5%
]
9.14%
59,5301.5%
[
9.5%
-
10.0%
]
9.70%
48,3081.8%
[
10.0%
-
10.5%
]
10.04%
1,0362.7%
[
11.0%
-
11.5%
]
11.15%
208,3562.4%
[
11.5%
-
12.0%
]
11.68%
36,5562.7%
[
12.0%
-
12.5%
]
12.09%
1,7123.8%
[
12.5%
-
13.0%
]
12.96%
12,5251.7%
[
14.5%
-
15.0%
]
14.78%
23,2000.86%
[
15.5%
-
16.0%
]
15.72%
15,2912.8%
[
16.0%
-
16.5%
]
16.40%
24,2332.7%
[
17.5%
-
18.0%
]
17.58%
8,9422.4%
[
19.5%
-
20.0%
]
19.61%
3575.3%
[
24.5%
-
25.0%
]
24.82%
23,6762.3%