Immigrants from Poland 1 or more Vehicles in Household

COMPARE

Immigrants from Poland
Race
Ancestry
AfghanAfricanAlaska NativeAlaskan AthabascanAlbanianAleutAlsatianAmericanApacheArabArapahoArgentineanArmenianAssyrian/Chaldean/SyriacAustralianAustrianBahamianBangladeshiBarbadianBasqueBelgianBelizeanBermudanBhutaneseBlackfeetBolivianBrazilianBritishBritish West IndianBulgarianBurmeseCajunCambodianCanadianCape VerdeanCarpatho RusynCelticCentral AmericanCentral American IndianCherokeeCheyenneChickasawChileanChineseChippewaChoctawColombianColvilleComancheCosta RicanCreeCreekCroatianCrowCubanCypriotCzechCzechoslovakianDanishDelawareDominicanDutchDutch West IndianEastern EuropeanEcuadorianEgyptianEnglishEstonianEthiopianEuropeanFijianFilipinoFinnishFrenchFrench American IndianFrench CanadianGermanGerman RussianGhanaianGreekGuamanian/ChamorroGuatemalanGuyaneseHaitianHmongHonduranHopiHoumaHungarianIcelanderIndian (Asian)IndonesianInupiatIranianIraqiIrishIroquoisIsraeliItalianJamaicanJapaneseJordanianKenyanKiowaKoreanLaotianLatvianLebaneseLiberianLithuanianLumbeeLuxembourgerMacedonianMalaysianMalteseMarshalleseMenomineeMexicanMexican American IndianMongolianMoroccanNative HawaiianNavajoNepaleseNew ZealanderNicaraguanNigerianNorthern EuropeanNorwegianOkinawanOsageOttawaPaiutePakistaniPalestinianPanamanianParaguayanPennsylvania GermanPeruvianPimaPolishPortuguesePotawatomiPuebloPuerto RicanPuget Sound SalishRomanianRussianSalvadoranSamoanScandinavianScotch-IrishScottishSeminoleSenegaleseSerbianShoshoneSierra LeoneanSiouxSlavicSlovakSloveneSomaliSouth AfricanSouth AmericanSouth American IndianSoviet UnionSpaniardSpanishSpanish AmericanSpanish American IndianSri LankanSubsaharan AfricanSudaneseSwedishSwissSyrianTaiwaneseThaiTlingit-HaidaTohono O'OdhamTonganTrinidadian and TobagonianTsimshianTurkishU.S. Virgin IslanderUgandanUkrainianUruguayanUteVenezuelanVietnameseWelshWest IndianYakamaYaquiYugoslavianYumanYup'ikZimbabwean
Immigration
NonimmigrantsImmigrantsAfghanistanAfricaAlbaniaArgentinaArmeniaAsiaAustraliaAustriaBahamasBangladeshBarbadosBelarusBelgiumBelizeBoliviaBosnia and HerzegovinaBrazilBulgariaBurma/MyanmarCabo VerdeCambodiaCameroonCanadaCaribbeanCentral AmericaChileChinaColombiaCongoCosta RicaCroatiaCubaCzechoslovakiaDenmarkDominicaDominican RepublicEastern AfricaEastern AsiaEastern EuropeEcuadorEgyptEl SalvadorEnglandEritreaEthiopiaEuropeFijiFranceGermanyGhanaGreeceGrenadaGuatemalaGuyanaHaitiHondurasHong KongHungaryIndiaIndonesiaIranIraqIrelandIsraelItalyJamaicaJapanJordanKazakhstanKenyaKoreaKuwaitLaosLatin AmericaLatviaLebanonLiberiaLithuaniaMalaysiaMexicoMicronesiaMiddle AfricaMoldovaMoroccoNepalNetherlandsNicaraguaNigeriaNorth AmericaNorth MacedoniaNorthern AfricaNorthern EuropeNorwayOceaniaPakistanPanamaPeruPhilippinesPolandPortugalRomaniaRussiaSaudi ArabiaScotlandSenegalSerbiaSierra LeoneSingaporeSomaliaSouth AfricaSouth AmericaSouth Central AsiaSouth Eastern AsiaSouthern EuropeSpainSri LankaSt. Vincent and the GrenadinesSudanSwedenSwitzerlandSyriaTaiwanThailandTrinidad and TobagoTurkeyUgandaUkraineUruguayUzbekistanVenezuelaVietnamWest IndiesWestern AfricaWestern AsiaWestern EuropeYemenZaireZimbabweAzores
Select to Compare
Race
Ancestry
AfghanAfricanAlaska NativeAlaskan AthabascanAlbanianAleutAlsatianAmericanApacheArabArapahoArgentineanArmenianAssyrian/Chaldean/SyriacAustralianAustrianBahamianBangladeshiBarbadianBasqueBelgianBelizeanBermudanBhutaneseBlackfeetBolivianBrazilianBritishBritish West IndianBulgarianBurmeseCajunCambodianCanadianCape VerdeanCarpatho RusynCelticCentral AmericanCentral American IndianCherokeeCheyenneChickasawChileanChineseChippewaChoctawColombianColvilleComancheCosta RicanCreeCreekCroatianCrowCubanCypriotCzechCzechoslovakianDanishDelawareDominicanDutchDutch West IndianEastern EuropeanEcuadorianEgyptianEnglishEstonianEthiopianEuropeanFijianFilipinoFinnishFrenchFrench American IndianFrench CanadianGermanGerman RussianGhanaianGreekGuamanian/ChamorroGuatemalanGuyaneseHaitianHmongHonduranHopiHoumaHungarianIcelanderIndian (Asian)IndonesianInupiatIranianIraqiIrishIroquoisIsraeliItalianJamaicanJapaneseJordanianKenyanKiowaKoreanLaotianLatvianLebaneseLiberianLithuanianLumbeeLuxembourgerMacedonianMalaysianMalteseMarshalleseMenomineeMexicanMexican American IndianMongolianMoroccanNative HawaiianNavajoNepaleseNew ZealanderNicaraguanNigerianNorthern EuropeanNorwegianOkinawanOsageOttawaPaiutePakistaniPalestinianPanamanianParaguayanPennsylvania GermanPeruvianPimaPolishPortuguesePotawatomiPuebloPuerto RicanPuget Sound SalishRomanianRussianSalvadoranSamoanScandinavianScotch-IrishScottishSeminoleSenegaleseSerbianShoshoneSierra LeoneanSiouxSlavicSlovakSloveneSomaliSouth AfricanSouth AmericanSouth American IndianSoviet UnionSpaniardSpanishSpanish AmericanSpanish American IndianSri LankanSubsaharan AfricanSudaneseSwedishSwissSyrianTaiwaneseThaiTlingit-HaidaTohono O'OdhamTonganTrinidadian and TobagonianTsimshianTurkishU.S. Virgin IslanderUgandanUkrainianUruguayanUteVenezuelanVietnameseWelshWest IndianYakamaYaquiYugoslavianYumanYup'ikZimbabwean
Immigration
NonimmigrantsImmigrantsAfghanistanAfricaAlbaniaArgentinaArmeniaAsiaAustraliaAustriaBahamasBangladeshBarbadosBelarusBelgiumBelizeBoliviaBosnia and HerzegovinaBrazilBulgariaBurma/MyanmarCabo VerdeCambodiaCameroonCanadaCaribbeanCentral AmericaChileChinaColombiaCongoCosta RicaCroatiaCubaCzechoslovakiaDenmarkDominicaDominican RepublicEastern AfricaEastern AsiaEastern EuropeEcuadorEgyptEl SalvadorEnglandEritreaEthiopiaEuropeFijiFranceGermanyGhanaGreeceGrenadaGuatemalaGuyanaHaitiHondurasHong KongHungaryIndiaIndonesiaIranIraqIrelandIsraelItalyJamaicaJapanJordanKazakhstanKenyaKoreaKuwaitLaosLatin AmericaLatviaLebanonLiberiaLithuaniaMalaysiaMexicoMicronesiaMiddle AfricaMoldovaMoroccoNepalNetherlandsNicaraguaNigeriaNorth AmericaNorth MacedoniaNorthern AfricaNorthern EuropeNorwayOceaniaPakistanPanamaPeruPhilippinesPortugalRomaniaRussiaSaudi ArabiaScotlandSenegalSerbiaSierra LeoneSingaporeSomaliaSouth AfricaSouth AmericaSouth Central AsiaSouth Eastern AsiaSouthern EuropeSpainSri LankaSt. Vincent and the GrenadinesSudanSwedenSwitzerlandSyriaTaiwanThailandTrinidad and TobagoTurkeyUgandaUkraineUruguayUzbekistanVenezuelaVietnamWest IndiesWestern AfricaWestern AsiaWestern EuropeYemenZaireZimbabweAzores
1 or more Vehicles in Household
Income
Poverty
Unemployment
Labor Participation
Family Structure
Vehicle Availability
Education Level
Disability

Immigrants from Poland 1 or more Vehicles in Household
Fair

89.5%
1+ VEHICLES AVAILABLE
37.1/ 100
METRIC RATING
191st/ 347
METRIC RANK

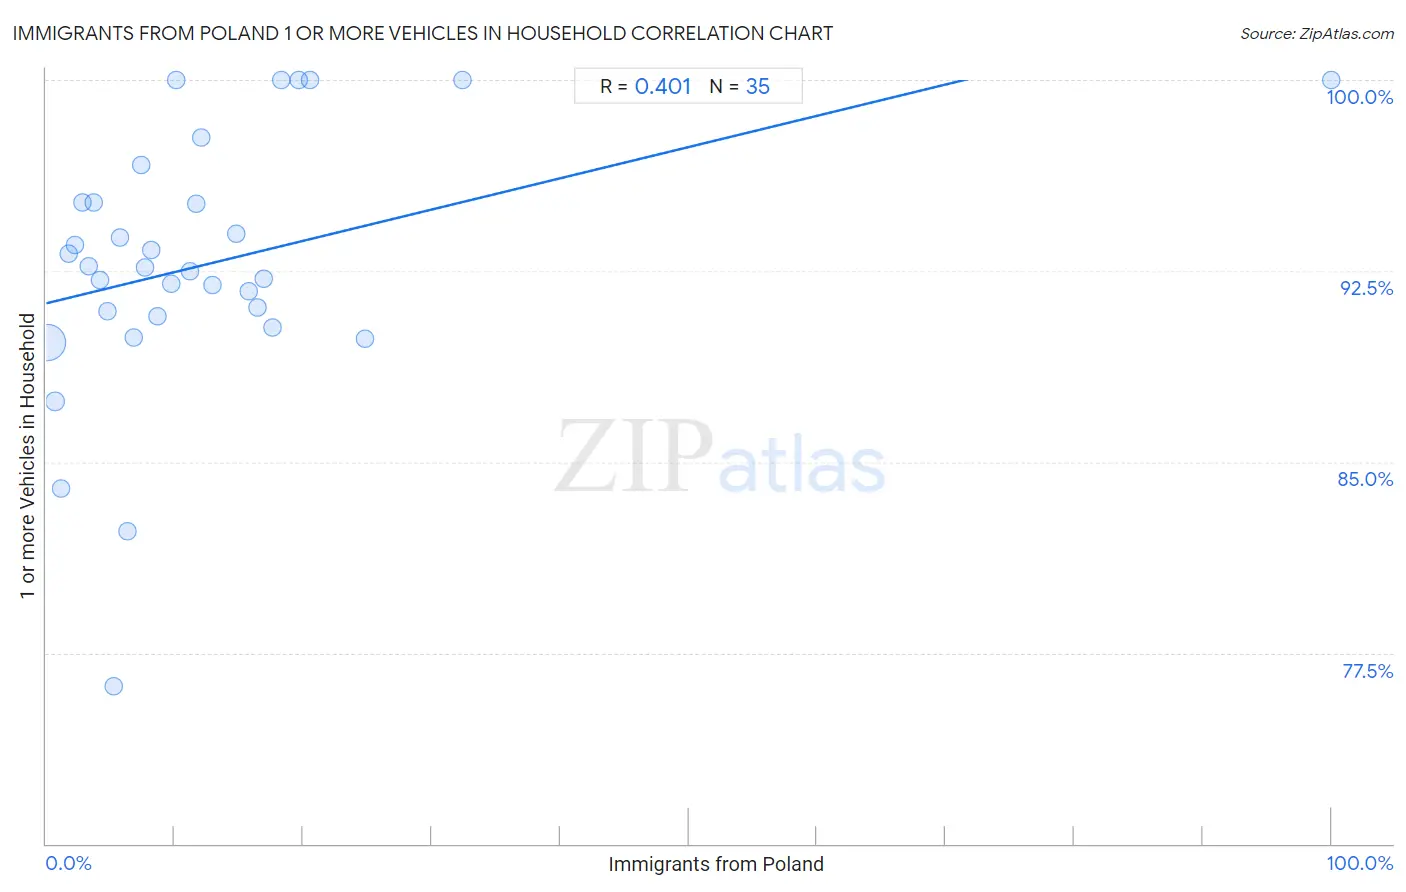
Immigrants from Poland 1 or more Vehicles in Household Correlation Chart

The statistical analysis conducted on geographies consisting of 304,721,875 people shows a moderate positive correlation between the proportion of Immigrants from Poland and percentage of households with 1 or more vehicles available in the United States with a correlation coefficient (R) of 0.401 and weighted average of 89.5%. On average, for every 1% (one percent) increase in Immigrants from Poland within a typical geography, there is an increase of 0.12% in percentage of households with 1 or more vehicles available.
Immigrants from Poland 1 or more Vehicles in Household
It is essential to understand that the correlation between the percentage of Immigrants from Poland and percentage of households with 1 or more vehicles available does not imply a direct cause-and-effect relationship. It remains uncertain whether the presence of Immigrants from Poland influences an upward or downward trend in the level of percentage of households with 1 or more vehicles available within an area, or if Immigrants from Poland simply ended up residing in those areas with higher or lower levels of percentage of households with 1 or more vehicles available due to other factors.

Demographics Similar to Immigrants from Poland by 1 or more Vehicles in Household

In terms of 1 or more vehicles in household, the demographic groups most similar to Immigrants from Poland are Carpatho Rusyn (89.5%, a difference of 0.010%), Shoshone (89.5%, a difference of 0.010%), Immigrants from North Macedonia (89.5%, a difference of 0.010%), Immigrants from Nepal (89.5%, a difference of 0.030%), and Immigrants from Northern Europe (89.5%, a difference of 0.030%).
DemographicsRating | Rank1 or more Vehicles in Household
Immigrants from Bulgaria
40.7
/100
|
#184
Average
89.6%
Immigrants from Brazil
40.1
/100
|
#185
Average
89.6%
Pueblo
39.9
/100
|
#186
Fair
89.6%
South Americans
39.6
/100
|
#187
Fair
89.5%
Immigrants from Nepal
38.9
/100
|
#188
Fair
89.5%
Carpatho Rusyns
37.8
/100
|
#189
Fair
89.5%
Shoshone
37.5
/100
|
#190
Fair
89.5%
Immigrants from Poland
37.1
/100
|
#191
Fair
89.5%
Immigrants from North Macedonia
36.5
/100
|
#192
Fair
89.5%
Immigrants from Northern Europe
35.5
/100
|
#193
Fair
89.5%
Immigrants from Eritrea
33.2
/100
|
#194
Fair
89.4%
Immigrants from Armenia
31.8
/100
|
#195
Fair
89.4%
Crow
24.3
/100
|
#196
Fair
89.3%
Immigrants from Sweden
23.6
/100
|
#197
Fair
89.3%
Pennsylvania Germans
22.9
/100
|
#198
Fair
89.3%

Immigrants from Poland 1 or more Vehicles in Household Correlation Summary

MeasurementImmigrants from Poland Data1 or more Vehicles in Household Data
Minimum0.11%76.2%
Maximum100.0%100.0%
Range99.9%23.8%
Mean12.7%92.8%
Median8.6%92.6%
Interquartile 25% (IQ1)4.2%90.7%
Interquartile 75% (IQ3)16.4%95.2%
Interquartile Range (IQR)12.2%4.5%
Standard Deviation (Sample)16.9%5.2%
Standard Deviation (Population)16.7%5.1%

Correlation Details

Immigrants from Poland PercentileSample Size1 or more Vehicles in Household
[
0.0%
-
0.5%
]
0.11%
277,001,54689.7%
[
0.5%
-
1.0%
]
0.69%
14,789,26987.4%
[
1.0%
-
1.5%
]
1.15%
6,723,04584.0%
[
1.5%
-
2.0%
]
1.72%
1,501,42293.2%
[
2.0%
-
2.5%
]
2.26%
910,67493.5%
[
2.5%
-
3.0%
]
2.81%
872,29495.2%
[
3.0%
-
3.5%
]
3.27%
546,31492.7%
[
3.5%
-
4.0%
]
3.69%
320,27595.2%
[
4.0%
-
4.5%
]
4.22%
509,51992.1%
[
4.5%
-
5.0%
]
4.76%
120,67290.9%
[
5.0%
-
5.5%
]
5.30%
211,75676.2%
[
5.5%
-
6.0%
]
5.72%
271,36793.8%
[
6.0%
-
6.5%
]
6.33%
120,28082.3%
[
6.5%
-
7.0%
]
6.85%
73,10089.9%
[
7.0%
-
7.5%
]
7.35%
26,01196.7%
[
7.5%
-
8.0%
]
7.70%
77,89792.6%
[
8.0%
-
8.5%
]
8.20%
71,76593.3%
[
8.5%
-
9.0%
]
8.62%
168,63790.7%
[
9.5%
-
10.0%
]
9.70%
48,30892.0%
[
10.0%
-
10.5%
]
10.11%
1,702100.0%
[
11.0%
-
11.5%
]
11.15%
208,35692.5%
[
11.5%
-
12.0%
]
11.68%
36,55695.1%
[
12.0%
-
12.5%
]
12.09%
1,71297.7%
[
12.5%
-
13.0%
]
12.96%
12,52592.0%
[
14.5%
-
15.0%
]
14.78%
23,20094.0%
[
15.5%
-
16.0%
]
15.72%
15,46991.7%
[
16.0%
-
16.5%
]
16.40%
24,23391.1%
[
16.5%
-
17.0%
]
16.91%
55692.2%
[
17.5%
-
18.0%
]
17.58%
9,02690.3%
[
18.0%
-
18.5%
]
18.25%
274100.0%
[
19.5%
-
20.0%
]
19.61%
357100.0%
[
20.5%
-
21.0%
]
20.51%
39100.0%
[
24.5%
-
25.0%
]
24.82%
23,67689.8%
[
32.0%
-
32.5%
]
32.43%
37100.0%
[
99.5%
-
100.0%
]
100.00%
6100.0%