Immigrants from Poland Disability Age 5 to 17
COMPARE
Immigrants from Poland
Select to Compare
Disability Age 5 to 17
Immigrants from Poland Disability Age 5 to 17
5.1%
DISABILITY | AGE 5 TO 17
99.9/ 100
METRIC RATING
57th/ 347
METRIC RANK
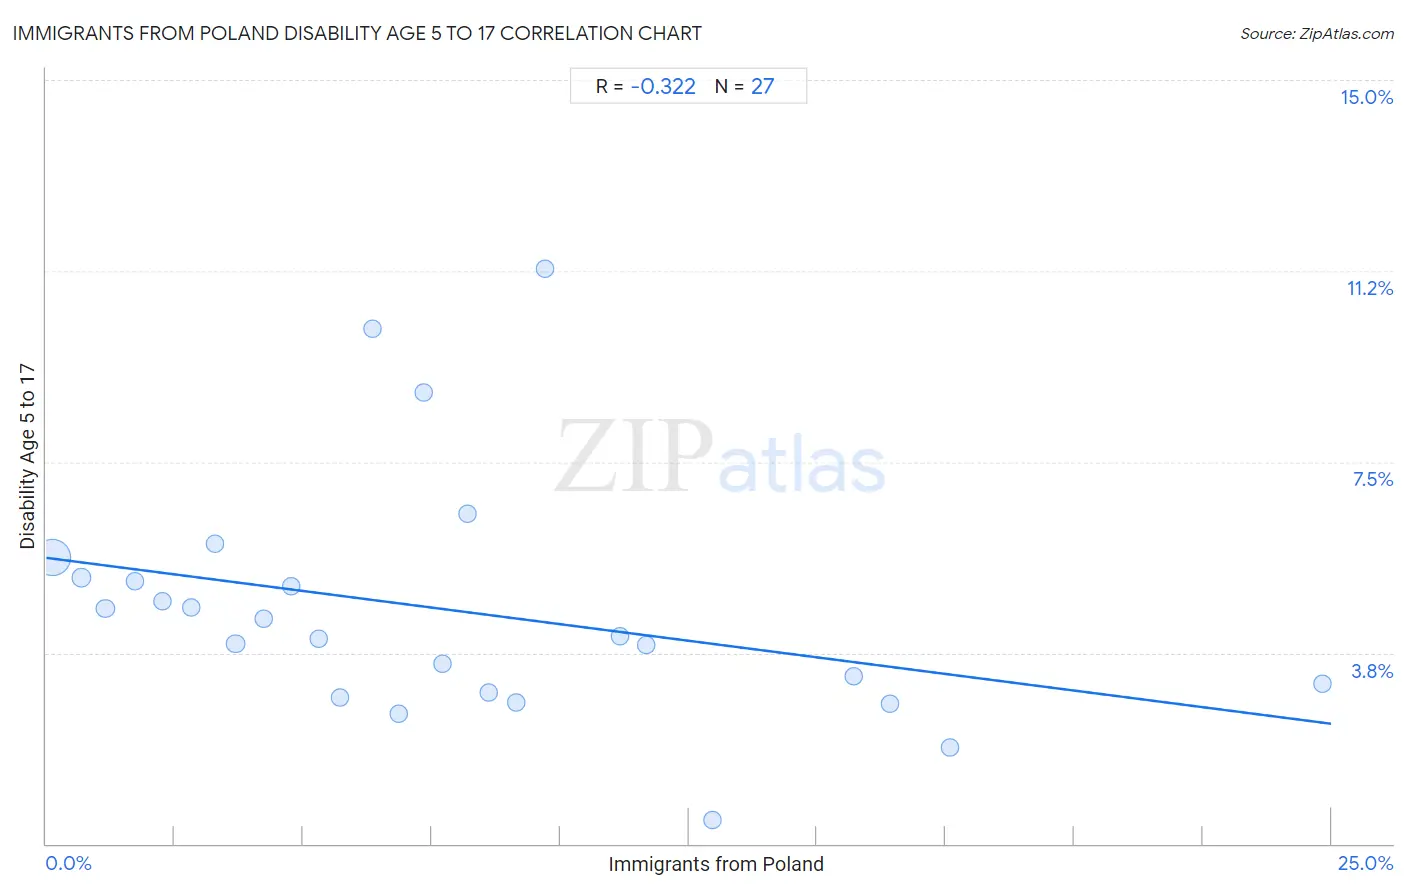
Immigrants from Poland Disability Age 5 to 17 Correlation Chart
The statistical analysis conducted on geographies consisting of 302,444,917 people shows a mild negative correlation between the proportion of Immigrants from Poland and percentage of population with a disability between the ages 5 and 17 in the United States with a correlation coefficient (R) of -0.322 and weighted average of 5.1%. On average, for every 1% (one percent) increase in Immigrants from Poland within a typical geography, there is a decrease of 0.13% in percentage of population with a disability between the ages 5 and 17.
It is essential to understand that the correlation between the percentage of Immigrants from Poland and percentage of population with a disability between the ages 5 and 17 does not imply a direct cause-and-effect relationship. It remains uncertain whether the presence of Immigrants from Poland influences an upward or downward trend in the level of percentage of population with a disability between the ages 5 and 17 within an area, or if Immigrants from Poland simply ended up residing in those areas with higher or lower levels of percentage of population with a disability between the ages 5 and 17 due to other factors.
Demographics Similar to Immigrants from Poland by Disability Age 5 to 17
In terms of disability age 5 to 17, the demographic groups most similar to Immigrants from Poland are Immigrants from Ukraine (5.1%, a difference of 0.090%), Immigrants from Turkey (5.1%, a difference of 0.14%), Laotian (5.1%, a difference of 0.16%), Paraguayan (5.1%, a difference of 0.20%), and Immigrants from Lithuania (5.1%, a difference of 0.23%).
| Demographics | Rating | Rank | Disability Age 5 to 17 |
| Argentineans | 99.9 /100 | #50 | Exceptional 5.1% |
| Turks | 99.9 /100 | #51 | Exceptional 5.1% |
| Immigrants from Fiji | 99.9 /100 | #52 | Exceptional 5.1% |
| Immigrants from Lithuania | 99.9 /100 | #53 | Exceptional 5.1% |
| Paraguayans | 99.9 /100 | #54 | Exceptional 5.1% |
| Laotians | 99.9 /100 | #55 | Exceptional 5.1% |
| Immigrants from Turkey | 99.9 /100 | #56 | Exceptional 5.1% |
| Immigrants from Poland | 99.9 /100 | #57 | Exceptional 5.1% |
| Immigrants from Ukraine | 99.9 /100 | #58 | Exceptional 5.1% |
| Immigrants from North Macedonia | 99.9 /100 | #59 | Exceptional 5.1% |
| Immigrants from Eastern Europe | 99.9 /100 | #60 | Exceptional 5.1% |
| Immigrants from Switzerland | 99.8 /100 | #61 | Exceptional 5.2% |
| Immigrants from Ireland | 99.8 /100 | #62 | Exceptional 5.2% |
| Immigrants from Bangladesh | 99.8 /100 | #63 | Exceptional 5.2% |
| Immigrants from South Eastern Asia | 99.8 /100 | #64 | Exceptional 5.2% |
Immigrants from Poland Disability Age 5 to 17 Correlation Summary
| Measurement | Immigrants from Poland Data | Disability Age 5 to 17 Data |
| Minimum | 0.11% | 0.46% |
| Maximum | 24.8% | 11.3% |
| Range | 24.7% | 10.8% |
| Mean | 7.8% | 4.6% |
| Median | 6.9% | 4.1% |
| Interquartile 25% (IQ1) | 3.3% | 3.0% |
| Interquartile 75% (IQ3) | 11.2% | 5.2% |
| Interquartile Range (IQR) | 7.9% | 2.3% |
| Standard Deviation (Sample) | 5.9% | 2.4% |
| Standard Deviation (Population) | 5.8% | 2.3% |
Correlation Details
| Immigrants from Poland Percentile | Sample Size | Disability Age 5 to 17 |
[ 0.0% - 0.5% ] 0.11% | 275,607,173 | 5.6% |
[ 0.5% - 1.0% ] 0.69% | 14,241,429 | 5.2% |
[ 1.0% - 1.5% ] 1.15% | 6,615,386 | 4.6% |
[ 1.5% - 2.0% ] 1.71% | 1,403,009 | 5.2% |
[ 2.0% - 2.5% ] 2.27% | 844,008 | 4.8% |
[ 2.5% - 3.0% ] 2.82% | 858,087 | 4.6% |
[ 3.0% - 3.5% ] 3.27% | 539,084 | 5.9% |
[ 3.5% - 4.0% ] 3.68% | 302,645 | 3.9% |
[ 4.0% - 4.5% ] 4.22% | 503,047 | 4.4% |
[ 4.5% - 5.0% ] 4.76% | 109,539 | 5.1% |
[ 5.0% - 5.5% ] 5.30% | 207,763 | 4.0% |
[ 5.5% - 6.0% ] 5.71% | 263,086 | 2.9% |
[ 6.0% - 6.5% ] 6.35% | 112,885 | 10.1% |
[ 6.5% - 7.0% ] 6.86% | 71,482 | 2.6% |
[ 7.0% - 7.5% ] 7.35% | 24,670 | 8.9% |
[ 7.5% - 8.0% ] 7.70% | 77,595 | 3.5% |
[ 8.0% - 8.5% ] 8.21% | 65,725 | 6.5% |
[ 8.5% - 9.0% ] 8.62% | 168,637 | 3.0% |
[ 9.0% - 9.5% ] 9.15% | 54,330 | 2.8% |
[ 9.5% - 10.0% ] 9.70% | 48,308 | 11.3% |
[ 11.0% - 11.5% ] 11.15% | 205,806 | 4.1% |
[ 11.5% - 12.0% ] 11.68% | 36,556 | 3.9% |
[ 12.5% - 13.0% ] 12.96% | 12,525 | 0.46% |
[ 15.5% - 16.0% ] 15.72% | 15,291 | 3.3% |
[ 16.0% - 16.5% ] 16.40% | 24,233 | 2.7% |
[ 17.5% - 18.0% ] 17.58% | 8,942 | 1.9% |
[ 24.5% - 25.0% ] 24.82% | 23,676 | 3.1% |