Immigrants from Poland GED/Equivalency
COMPARE
Immigrants from Poland
Select to Compare
GED/Equivalency
Immigrants from Poland GED/Equivalency
86.3%
GED/EQUIVALENCY
79.3/ 100
METRIC RATING
148th/ 347
METRIC RANK
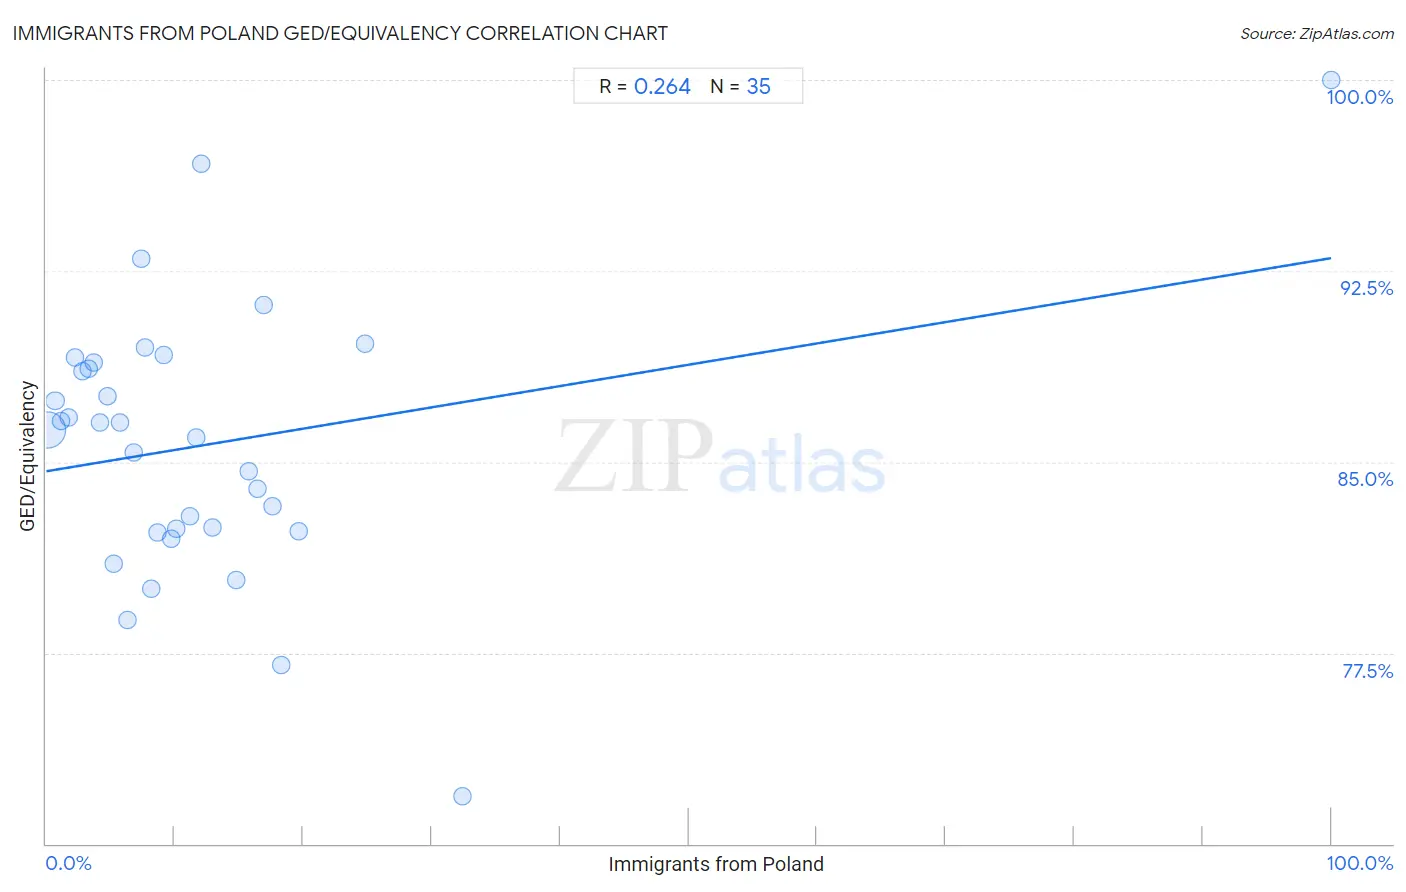
Immigrants from Poland GED/Equivalency Correlation Chart
The statistical analysis conducted on geographies consisting of 304,861,877 people shows a weak positive correlation between the proportion of Immigrants from Poland and percentage of population with at least ged/equivalency education in the United States with a correlation coefficient (R) of 0.264 and weighted average of 86.3%. On average, for every 1% (one percent) increase in Immigrants from Poland within a typical geography, there is an increase of 0.084% in percentage of population with at least ged/equivalency education.
It is essential to understand that the correlation between the percentage of Immigrants from Poland and percentage of population with at least ged/equivalency education does not imply a direct cause-and-effect relationship. It remains uncertain whether the presence of Immigrants from Poland influences an upward or downward trend in the level of percentage of population with at least ged/equivalency education within an area, or if Immigrants from Poland simply ended up residing in those areas with higher or lower levels of percentage of population with at least ged/equivalency education due to other factors.
Demographics Similar to Immigrants from Poland by GED/Equivalency
In terms of ged/equivalency, the demographic groups most similar to Immigrants from Poland are Basque (86.4%, a difference of 0.0%), Immigrants from Northern Africa (86.3%, a difference of 0.0%), Menominee (86.3%, a difference of 0.0%), Immigrants from Western Asia (86.3%, a difference of 0.020%), and Pakistani (86.4%, a difference of 0.030%).
| Demographics | Rating | Rank | GED/Equivalency |
| Laotians | 83.2 /100 | #141 | Excellent 86.5% |
| Immigrants from Indonesia | 82.4 /100 | #142 | Excellent 86.4% |
| Immigrants from Pakistan | 82.4 /100 | #143 | Excellent 86.4% |
| Bolivians | 82.1 /100 | #144 | Excellent 86.4% |
| Pakistanis | 80.4 /100 | #145 | Excellent 86.4% |
| Basques | 79.5 /100 | #146 | Good 86.4% |
| Immigrants from Northern Africa | 79.3 /100 | #147 | Good 86.3% |
| Immigrants from Poland | 79.3 /100 | #148 | Good 86.3% |
| Menominee | 79.3 /100 | #149 | Good 86.3% |
| Immigrants from Western Asia | 78.8 /100 | #150 | Good 86.3% |
| Immigrants from Bosnia and Herzegovina | 77.9 /100 | #151 | Good 86.3% |
| Brazilians | 77.2 /100 | #152 | Good 86.3% |
| Kenyans | 76.6 /100 | #153 | Good 86.3% |
| Armenians | 76.4 /100 | #154 | Good 86.3% |
| Iraqis | 75.2 /100 | #155 | Good 86.2% |
Immigrants from Poland GED/Equivalency Correlation Summary
| Measurement | Immigrants from Poland Data | GED/Equivalency Data |
| Minimum | 0.11% | 71.9% |
| Maximum | 100.0% | 100.0% |
| Range | 99.9% | 28.1% |
| Mean | 12.4% | 85.7% |
| Median | 8.6% | 86.2% |
| Interquartile 25% (IQ1) | 4.2% | 82.3% |
| Interquartile 75% (IQ3) | 15.7% | 88.9% |
| Interquartile Range (IQR) | 11.5% | 6.6% |
| Standard Deviation (Sample) | 16.9% | 5.4% |
| Standard Deviation (Population) | 16.6% | 5.3% |
Correlation Details
| Immigrants from Poland Percentile | Sample Size | GED/Equivalency |
[ 0.0% - 0.5% ] 0.11% | 277,069,324 | 86.2% |
[ 0.5% - 1.0% ] 0.69% | 14,801,074 | 87.4% |
[ 1.0% - 1.5% ] 1.15% | 6,723,045 | 86.6% |
[ 1.5% - 2.0% ] 1.72% | 1,501,422 | 86.8% |
[ 2.0% - 2.5% ] 2.26% | 910,674 | 89.1% |
[ 2.5% - 3.0% ] 2.81% | 872,294 | 88.6% |
[ 3.0% - 3.5% ] 3.27% | 547,066 | 88.6% |
[ 3.5% - 4.0% ] 3.69% | 320,451 | 88.9% |
[ 4.0% - 4.5% ] 4.22% | 509,519 | 86.6% |
[ 4.5% - 5.0% ] 4.76% | 120,672 | 87.6% |
[ 5.0% - 5.5% ] 5.30% | 211,756 | 81.0% |
[ 5.5% - 6.0% ] 5.72% | 271,367 | 86.6% |
[ 6.0% - 6.5% ] 6.33% | 120,280 | 78.8% |
[ 6.5% - 7.0% ] 6.85% | 73,100 | 85.4% |
[ 7.0% - 7.5% ] 7.35% | 26,011 | 93.0% |
[ 7.5% - 8.0% ] 7.70% | 77,897 | 89.5% |
[ 8.0% - 8.5% ] 8.20% | 71,765 | 80.0% |
[ 8.5% - 9.0% ] 8.62% | 168,637 | 82.2% |
[ 9.0% - 9.5% ] 9.14% | 59,530 | 89.2% |
[ 9.5% - 10.0% ] 9.70% | 48,308 | 82.0% |
[ 10.0% - 10.5% ] 10.11% | 1,702 | 82.4% |
[ 11.0% - 11.5% ] 11.15% | 208,356 | 82.9% |
[ 11.5% - 12.0% ] 11.68% | 36,556 | 86.0% |
[ 12.0% - 12.5% ] 12.09% | 1,712 | 96.7% |
[ 12.5% - 13.0% ] 12.96% | 12,525 | 82.4% |
[ 14.5% - 15.0% ] 14.78% | 23,200 | 80.3% |
[ 15.5% - 16.0% ] 15.72% | 15,469 | 84.6% |
[ 16.0% - 16.5% ] 16.40% | 24,233 | 84.0% |
[ 16.5% - 17.0% ] 16.91% | 556 | 91.2% |
[ 17.5% - 18.0% ] 17.58% | 9,026 | 83.3% |
[ 18.0% - 18.5% ] 18.25% | 274 | 77.0% |
[ 19.5% - 20.0% ] 19.61% | 357 | 82.3% |
[ 24.5% - 25.0% ] 24.82% | 23,676 | 89.7% |
[ 32.0% - 32.5% ] 32.43% | 37 | 71.9% |
[ 99.5% - 100.0% ] 100.00% | 6 | 100.0% |