Immigrants from Poland Married-couple Households
COMPARE
Immigrants from Poland
Select to Compare
Married-couple Households
Immigrants from Poland Married-couple Households
48.1%
MARRIED-COUPLE HOUSEHOLDS
97.7/ 100
METRIC RATING
82nd/ 347
METRIC RANK
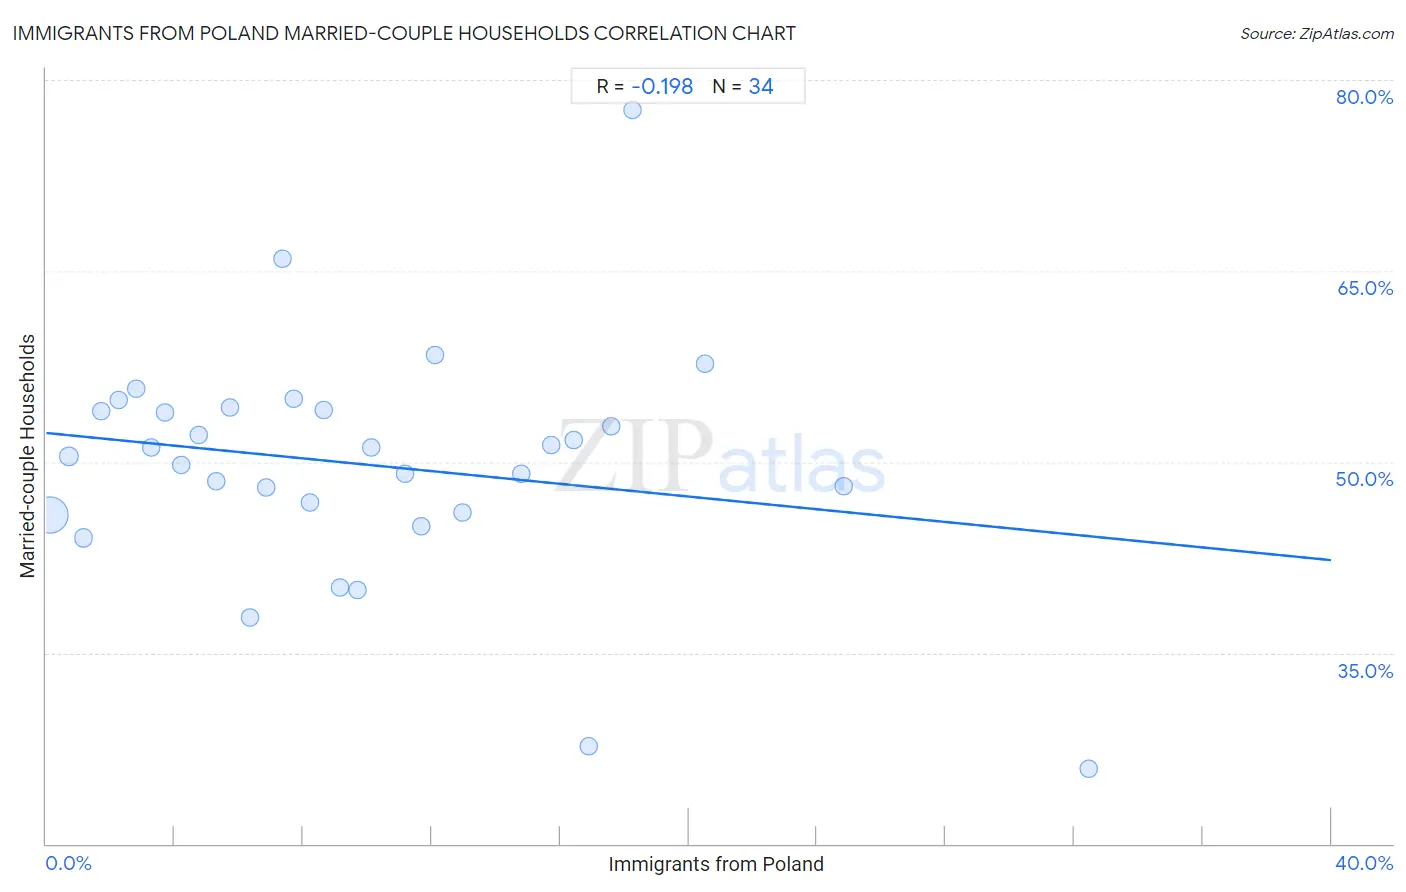
Immigrants from Poland Married-couple Households Correlation Chart
The statistical analysis conducted on geographies consisting of 304,780,020 people shows a poor negative correlation between the proportion of Immigrants from Poland and percentage of married-couple family households in the United States with a correlation coefficient (R) of -0.198 and weighted average of 48.1%. On average, for every 1% (one percent) increase in Immigrants from Poland within a typical geography, there is a decrease of 0.25% in percentage of married-couple family households.
It is essential to understand that the correlation between the percentage of Immigrants from Poland and percentage of married-couple family households does not imply a direct cause-and-effect relationship. It remains uncertain whether the presence of Immigrants from Poland influences an upward or downward trend in the level of percentage of married-couple family households within an area, or if Immigrants from Poland simply ended up residing in those areas with higher or lower levels of percentage of married-couple family households due to other factors.
Demographics Similar to Immigrants from Poland by Married-couple Households
In terms of married-couple households, the demographic groups most similar to Immigrants from Poland are Guamanian/Chamorro (48.1%, a difference of 0.020%), Ukrainian (48.1%, a difference of 0.040%), Immigrants from Israel (48.0%, a difference of 0.090%), Belgian (48.0%, a difference of 0.11%), and Immigrants from Ireland (48.0%, a difference of 0.13%).
| Demographics | Rating | Rank | Married-couple Households |
| Immigrants from England | 98.4 /100 | #75 | Exceptional 48.2% |
| Immigrants from Fiji | 98.4 /100 | #76 | Exceptional 48.2% |
| Canadians | 98.2 /100 | #77 | Exceptional 48.2% |
| Egyptians | 98.2 /100 | #78 | Exceptional 48.2% |
| Immigrants from Netherlands | 98.2 /100 | #79 | Exceptional 48.2% |
| Russians | 98.1 /100 | #80 | Exceptional 48.2% |
| Finns | 98.0 /100 | #81 | Exceptional 48.1% |
| Immigrants from Poland | 97.7 /100 | #82 | Exceptional 48.1% |
| Guamanians/Chamorros | 97.6 /100 | #83 | Exceptional 48.1% |
| Ukrainians | 97.6 /100 | #84 | Exceptional 48.1% |
| Immigrants from Israel | 97.4 /100 | #85 | Exceptional 48.0% |
| Belgians | 97.4 /100 | #86 | Exceptional 48.0% |
| Immigrants from Ireland | 97.3 /100 | #87 | Exceptional 48.0% |
| Afghans | 97.3 /100 | #88 | Exceptional 48.0% |
| Cypriots | 97.2 /100 | #89 | Exceptional 48.0% |
Immigrants from Poland Married-couple Households Correlation Summary
| Measurement | Immigrants from Poland Data | Married-couple Households Data |
| Minimum | 0.11% | 25.9% |
| Maximum | 32.4% | 77.7% |
| Range | 32.3% | 51.8% |
| Mean | 9.9% | 49.8% |
| Median | 8.4% | 50.8% |
| Interquartile 25% (IQ1) | 4.2% | 46.0% |
| Interquartile 75% (IQ3) | 14.8% | 54.1% |
| Interquartile Range (IQR) | 10.6% | 8.1% |
| Standard Deviation (Sample) | 7.4% | 9.3% |
| Standard Deviation (Population) | 7.3% | 9.2% |
Correlation Details
| Immigrants from Poland Percentile | Sample Size | Married-couple Households |
[ 0.0% - 0.5% ] 0.11% | 277,000,746 | 45.8% |
[ 0.5% - 1.0% ] 0.69% | 14,789,269 | 50.4% |
[ 1.0% - 1.5% ] 1.15% | 6,723,045 | 44.0% |
[ 1.5% - 2.0% ] 1.72% | 1,501,422 | 54.0% |
[ 2.0% - 2.5% ] 2.26% | 910,674 | 54.8% |
[ 2.5% - 3.0% ] 2.81% | 872,294 | 55.8% |
[ 3.0% - 3.5% ] 3.27% | 546,092 | 51.2% |
[ 3.5% - 4.0% ] 3.69% | 320,275 | 53.9% |
[ 4.0% - 4.5% ] 4.22% | 509,519 | 49.8% |
[ 4.5% - 5.0% ] 4.76% | 120,672 | 52.1% |
[ 5.0% - 5.5% ] 5.30% | 211,756 | 48.4% |
[ 5.5% - 6.0% ] 5.72% | 271,367 | 54.2% |
[ 6.0% - 6.5% ] 6.33% | 120,280 | 37.8% |
[ 6.5% - 7.0% ] 6.85% | 73,100 | 48.0% |
[ 7.0% - 7.5% ] 7.35% | 26,011 | 65.9% |
[ 7.5% - 8.0% ] 7.70% | 77,897 | 54.9% |
[ 8.0% - 8.5% ] 8.20% | 71,765 | 46.8% |
[ 8.5% - 9.0% ] 8.62% | 168,637 | 54.1% |
[ 9.0% - 9.5% ] 9.14% | 59,530 | 40.2% |
[ 9.5% - 10.0% ] 9.70% | 48,308 | 39.9% |
[ 10.0% - 10.5% ] 10.11% | 1,702 | 51.1% |
[ 11.0% - 11.5% ] 11.15% | 208,356 | 49.1% |
[ 11.5% - 12.0% ] 11.68% | 36,556 | 45.0% |
[ 12.0% - 12.5% ] 12.09% | 1,712 | 58.4% |
[ 12.5% - 13.0% ] 12.96% | 12,525 | 46.0% |
[ 14.5% - 15.0% ] 14.78% | 23,200 | 49.1% |
[ 15.5% - 16.0% ] 15.72% | 15,469 | 51.3% |
[ 16.0% - 16.5% ] 16.40% | 24,233 | 51.8% |
[ 16.5% - 17.0% ] 16.91% | 556 | 27.6% |
[ 17.5% - 18.0% ] 17.58% | 9,026 | 52.8% |
[ 18.0% - 18.5% ] 18.25% | 274 | 77.7% |
[ 20.5% - 21.0% ] 20.51% | 39 | 57.7% |
[ 24.5% - 25.0% ] 24.82% | 23,676 | 48.1% |
[ 32.0% - 32.5% ] 32.43% | 37 | 25.9% |