Immigrants from Poland Wage/Income Gap

COMPARE

Immigrants from Poland
Race
Ancestry
AfghanAfricanAlaska NativeAlaskan AthabascanAlbanianAleutAlsatianAmericanApacheArabArapahoArgentineanArmenianAssyrian/Chaldean/SyriacAustralianAustrianBahamianBangladeshiBarbadianBasqueBelgianBelizeanBermudanBhutaneseBlackfeetBolivianBrazilianBritishBritish West IndianBulgarianBurmeseCajunCambodianCanadianCape VerdeanCarpatho RusynCelticCentral AmericanCentral American IndianCherokeeCheyenneChickasawChileanChineseChippewaChoctawColombianColvilleComancheCosta RicanCreeCreekCroatianCrowCubanCypriotCzechCzechoslovakianDanishDelawareDominicanDutchDutch West IndianEastern EuropeanEcuadorianEgyptianEnglishEstonianEthiopianEuropeanFijianFilipinoFinnishFrenchFrench American IndianFrench CanadianGermanGerman RussianGhanaianGreekGuamanian/ChamorroGuatemalanGuyaneseHaitianHmongHonduranHopiHoumaHungarianIcelanderIndian (Asian)IndonesianInupiatIranianIraqiIrishIroquoisIsraeliItalianJamaicanJapaneseJordanianKenyanKiowaKoreanLaotianLatvianLebaneseLiberianLithuanianLumbeeLuxembourgerMacedonianMalaysianMalteseMarshalleseMenomineeMexicanMexican American IndianMongolianMoroccanNative HawaiianNavajoNepaleseNew ZealanderNicaraguanNigerianNorthern EuropeanNorwegianOkinawanOsageOttawaPaiutePakistaniPalestinianPanamanianParaguayanPennsylvania GermanPeruvianPimaPolishPortuguesePotawatomiPuebloPuerto RicanPuget Sound SalishRomanianRussianSalvadoranSamoanScandinavianScotch-IrishScottishSeminoleSenegaleseSerbianShoshoneSierra LeoneanSiouxSlavicSlovakSloveneSomaliSouth AfricanSouth AmericanSouth American IndianSoviet UnionSpaniardSpanishSpanish AmericanSpanish American IndianSri LankanSubsaharan AfricanSudaneseSwedishSwissSyrianTaiwaneseThaiTlingit-HaidaTohono O'OdhamTonganTrinidadian and TobagonianTsimshianTurkishU.S. Virgin IslanderUgandanUkrainianUruguayanUteVenezuelanVietnameseWelshWest IndianYakamaYaquiYugoslavianYumanYup'ikZimbabwean
Immigration
NonimmigrantsImmigrantsAfghanistanAfricaAlbaniaArgentinaArmeniaAsiaAustraliaAustriaBahamasBangladeshBarbadosBelarusBelgiumBelizeBoliviaBosnia and HerzegovinaBrazilBulgariaBurma/MyanmarCabo VerdeCambodiaCameroonCanadaCaribbeanCentral AmericaChileChinaColombiaCongoCosta RicaCroatiaCubaCzechoslovakiaDenmarkDominicaDominican RepublicEastern AfricaEastern AsiaEastern EuropeEcuadorEgyptEl SalvadorEnglandEritreaEthiopiaEuropeFijiFranceGermanyGhanaGreeceGrenadaGuatemalaGuyanaHaitiHondurasHong KongHungaryIndiaIndonesiaIranIraqIrelandIsraelItalyJamaicaJapanJordanKazakhstanKenyaKoreaKuwaitLaosLatin AmericaLatviaLebanonLiberiaLithuaniaMalaysiaMexicoMicronesiaMiddle AfricaMoldovaMoroccoNepalNetherlandsNicaraguaNigeriaNorth AmericaNorth MacedoniaNorthern AfricaNorthern EuropeNorwayOceaniaPakistanPanamaPeruPhilippinesPolandPortugalRomaniaRussiaSaudi ArabiaScotlandSenegalSerbiaSierra LeoneSingaporeSomaliaSouth AfricaSouth AmericaSouth Central AsiaSouth Eastern AsiaSouthern EuropeSpainSri LankaSt. Vincent and the GrenadinesSudanSwedenSwitzerlandSyriaTaiwanThailandTrinidad and TobagoTurkeyUgandaUkraineUruguayUzbekistanVenezuelaVietnamWest IndiesWestern AfricaWestern AsiaWestern EuropeYemenZaireZimbabweAzores
Select to Compare
Race
Ancestry
AfghanAfricanAlaska NativeAlaskan AthabascanAlbanianAleutAlsatianAmericanApacheArabArapahoArgentineanArmenianAssyrian/Chaldean/SyriacAustralianAustrianBahamianBangladeshiBarbadianBasqueBelgianBelizeanBermudanBhutaneseBlackfeetBolivianBrazilianBritishBritish West IndianBulgarianBurmeseCajunCambodianCanadianCape VerdeanCarpatho RusynCelticCentral AmericanCentral American IndianCherokeeCheyenneChickasawChileanChineseChippewaChoctawColombianColvilleComancheCosta RicanCreeCreekCroatianCrowCubanCypriotCzechCzechoslovakianDanishDelawareDominicanDutchDutch West IndianEastern EuropeanEcuadorianEgyptianEnglishEstonianEthiopianEuropeanFijianFilipinoFinnishFrenchFrench American IndianFrench CanadianGermanGerman RussianGhanaianGreekGuamanian/ChamorroGuatemalanGuyaneseHaitianHmongHonduranHopiHoumaHungarianIcelanderIndian (Asian)IndonesianInupiatIranianIraqiIrishIroquoisIsraeliItalianJamaicanJapaneseJordanianKenyanKiowaKoreanLaotianLatvianLebaneseLiberianLithuanianLumbeeLuxembourgerMacedonianMalaysianMalteseMarshalleseMenomineeMexicanMexican American IndianMongolianMoroccanNative HawaiianNavajoNepaleseNew ZealanderNicaraguanNigerianNorthern EuropeanNorwegianOkinawanOsageOttawaPaiutePakistaniPalestinianPanamanianParaguayanPennsylvania GermanPeruvianPimaPolishPortuguesePotawatomiPuebloPuerto RicanPuget Sound SalishRomanianRussianSalvadoranSamoanScandinavianScotch-IrishScottishSeminoleSenegaleseSerbianShoshoneSierra LeoneanSiouxSlavicSlovakSloveneSomaliSouth AfricanSouth AmericanSouth American IndianSoviet UnionSpaniardSpanishSpanish AmericanSpanish American IndianSri LankanSubsaharan AfricanSudaneseSwedishSwissSyrianTaiwaneseThaiTlingit-HaidaTohono O'OdhamTonganTrinidadian and TobagonianTsimshianTurkishU.S. Virgin IslanderUgandanUkrainianUruguayanUteVenezuelanVietnameseWelshWest IndianYakamaYaquiYugoslavianYumanYup'ikZimbabwean
Immigration
NonimmigrantsImmigrantsAfghanistanAfricaAlbaniaArgentinaArmeniaAsiaAustraliaAustriaBahamasBangladeshBarbadosBelarusBelgiumBelizeBoliviaBosnia and HerzegovinaBrazilBulgariaBurma/MyanmarCabo VerdeCambodiaCameroonCanadaCaribbeanCentral AmericaChileChinaColombiaCongoCosta RicaCroatiaCubaCzechoslovakiaDenmarkDominicaDominican RepublicEastern AfricaEastern AsiaEastern EuropeEcuadorEgyptEl SalvadorEnglandEritreaEthiopiaEuropeFijiFranceGermanyGhanaGreeceGrenadaGuatemalaGuyanaHaitiHondurasHong KongHungaryIndiaIndonesiaIranIraqIrelandIsraelItalyJamaicaJapanJordanKazakhstanKenyaKoreaKuwaitLaosLatin AmericaLatviaLebanonLiberiaLithuaniaMalaysiaMexicoMicronesiaMiddle AfricaMoldovaMoroccoNepalNetherlandsNicaraguaNigeriaNorth AmericaNorth MacedoniaNorthern AfricaNorthern EuropeNorwayOceaniaPakistanPanamaPeruPhilippinesPortugalRomaniaRussiaSaudi ArabiaScotlandSenegalSerbiaSierra LeoneSingaporeSomaliaSouth AfricaSouth AmericaSouth Central AsiaSouth Eastern AsiaSouthern EuropeSpainSri LankaSt. Vincent and the GrenadinesSudanSwedenSwitzerlandSyriaTaiwanThailandTrinidad and TobagoTurkeyUgandaUkraineUruguayUzbekistanVenezuelaVietnamWest IndiesWestern AfricaWestern AsiaWestern EuropeYemenZaireZimbabweAzores
Wage/Income Gap
Income
Poverty
Unemployment
Labor Participation
Family Structure
Vehicle Availability
Education Level
Disability

Immigrants from Poland Wage/Income Gap
Tragic

26.7%
WAGE/INCOME GAP
8.9/ 100
METRIC RATING
219th/ 347
METRIC RANK

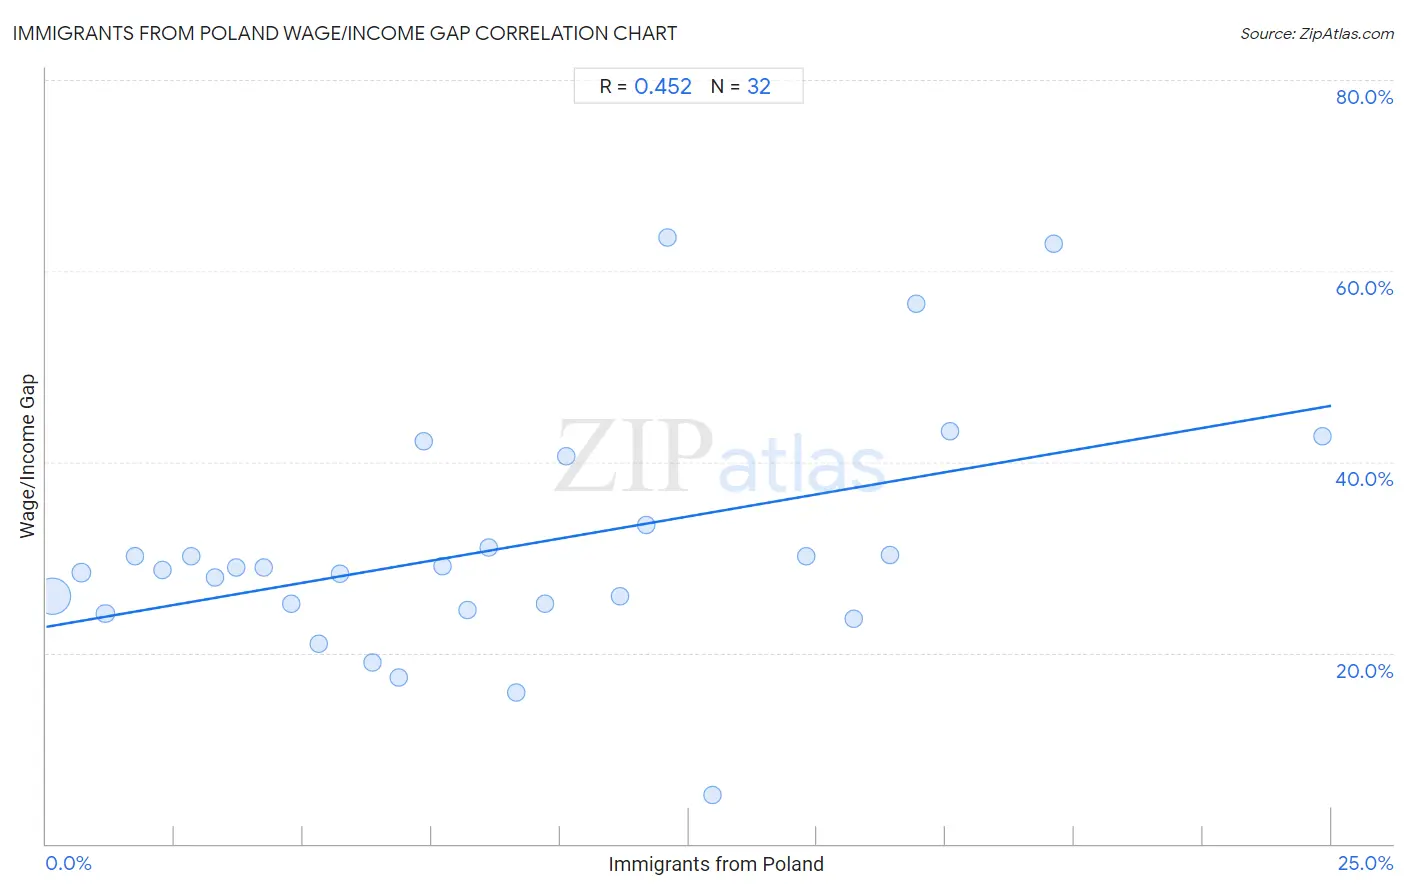
Immigrants from Poland Wage/Income Gap Correlation Chart

The statistical analysis conducted on geographies consisting of 304,701,845 people shows a moderate positive correlation between the proportion of Immigrants from Poland and wage/income gap percentage in the United States with a correlation coefficient (R) of 0.452 and weighted average of 26.7%. On average, for every 1% (one percent) increase in Immigrants from Poland within a typical geography, there is an increase of 0.93% in wage/income gap percentage.
Immigrants from Poland Wage/Income Gap
It is essential to understand that the correlation between the percentage of Immigrants from Poland and wage/income gap percentage does not imply a direct cause-and-effect relationship. It remains uncertain whether the presence of Immigrants from Poland influences an upward or downward trend in the level of wage/income gap percentage within an area, or if Immigrants from Poland simply ended up residing in those areas with higher or lower levels of wage/income gap percentage due to other factors.

Demographics Similar to Immigrants from Poland by Wage/Income Gap

In terms of wage/income gap, the demographic groups most similar to Immigrants from Poland are Immigrants from Latvia (26.7%, a difference of 0.010%), Immigrants from Saudi Arabia (26.7%, a difference of 0.030%), Brazilian (26.7%, a difference of 0.050%), Immigrants from Spain (26.8%, a difference of 0.080%), and Immigrants from Portugal (26.7%, a difference of 0.11%).
DemographicsRating | RankWage/Income Gap
Iraqis
11.2
/100
|
#212
Poor
26.6%
Immigrants from Iraq
10.3
/100
|
#213
Poor
26.7%
Immigrants from China
10.3
/100
|
#214
Poor
26.7%
Yugoslavians
9.7
/100
|
#215
Tragic
26.7%
Immigrants from Portugal
9.5
/100
|
#216
Tragic
26.7%
Brazilians
9.2
/100
|
#217
Tragic
26.7%
Immigrants from Saudi Arabia
9.1
/100
|
#218
Tragic
26.7%
Immigrants from Poland
8.9
/100
|
#219
Tragic
26.7%
Immigrants from Latvia
8.9
/100
|
#220
Tragic
26.7%
Immigrants from Spain
8.5
/100
|
#221
Tragic
26.8%
Bolivians
8.3
/100
|
#222
Tragic
26.8%
Jordanians
8.0
/100
|
#223
Tragic
26.8%
Immigrants from Argentina
7.2
/100
|
#224
Tragic
26.8%
Immigrants from Ireland
6.5
/100
|
#225
Tragic
26.9%
Asians
5.9
/100
|
#226
Tragic
26.9%

Immigrants from Poland Wage/Income Gap Correlation Summary

MeasurementImmigrants from Poland DataWage/Income Gap Data
Minimum0.11%5.1%
Maximum24.8%63.5%
Range24.7%58.4%
Mean8.9%30.9%
Median8.0%28.8%
Interquartile 25% (IQ1)4.0%24.8%
Interquartile 75% (IQ3)12.5%32.3%
Interquartile Range (IQR)8.6%7.5%
Standard Deviation (Sample)6.1%12.5%
Standard Deviation (Population)6.0%12.3%

Correlation Details

Immigrants from Poland PercentileSample SizeWage/Income Gap
[
0.0%
-
0.5%
]
0.11%
277,012,30125.9%
[
0.5%
-
1.0%
]
0.69%
14,759,43828.4%
[
1.0%
-
1.5%
]
1.15%
6,700,79924.1%
[
1.5%
-
2.0%
]
1.72%
1,489,25930.1%
[
2.0%
-
2.5%
]
2.26%
896,34328.6%
[
2.5%
-
3.0%
]
2.81%
866,71530.1%
[
3.0%
-
3.5%
]
3.27%
546,69027.9%
[
3.5%
-
4.0%
]
3.69%
319,36929.0%
[
4.0%
-
4.5%
]
4.22%
507,68329.0%
[
4.5%
-
5.0%
]
4.76%
120,49925.1%
[
5.0%
-
5.5%
]
5.30%
211,75621.0%
[
5.5%
-
6.0%
]
5.72%
270,77528.3%
[
6.0%
-
6.5%
]
6.34%
118,85918.9%
[
6.5%
-
7.0%
]
6.86%
72,57317.5%
[
7.0%
-
7.5%
]
7.35%
26,01142.2%
[
7.5%
-
8.0%
]
7.70%
77,59529.0%
[
8.0%
-
8.5%
]
8.20%
71,75324.5%
[
8.5%
-
9.0%
]
8.62%
168,63731.1%
[
9.0%
-
9.5%
]
9.14%
59,53015.9%
[
9.5%
-
10.0%
]
9.70%
48,30825.1%
[
10.0%
-
10.5%
]
10.11%
1,70240.6%
[
11.0%
-
11.5%
]
11.15%
208,35625.9%
[
11.5%
-
12.0%
]
11.68%
36,55633.4%
[
12.0%
-
12.5%
]
12.09%
1,71263.5%
[
12.5%
-
13.0%
]
12.96%
12,5255.1%
[
14.5%
-
15.0%
]
14.78%
23,20030.2%
[
15.5%
-
16.0%
]
15.72%
15,29123.5%
[
16.0%
-
16.5%
]
16.40%
24,23330.2%
[
16.5%
-
17.0%
]
16.92%
40256.5%
[
17.5%
-
18.0%
]
17.58%
8,94243.2%
[
19.5%
-
20.0%
]
19.61%
35762.9%
[
24.5%
-
25.0%
]
24.82%
23,67642.7%