Immigrants from Jordan vs Immigrants from West Indies Married-Couple Family Poverty
COMPARE
Immigrants from Jordan
Immigrants from West Indies
Married-Couple Family Poverty
Married-Couple Family Poverty Comparison
Immigrants from Jordan
Immigrants from West Indies
5.1%
MARRIED-COUPLE FAMILY POVERTY
66.5/ 100
METRIC RATING
162nd/ 347
METRIC RANK
6.2%
MARRIED-COUPLE FAMILY POVERTY
0.1/ 100
METRIC RATING
269th/ 347
METRIC RANK
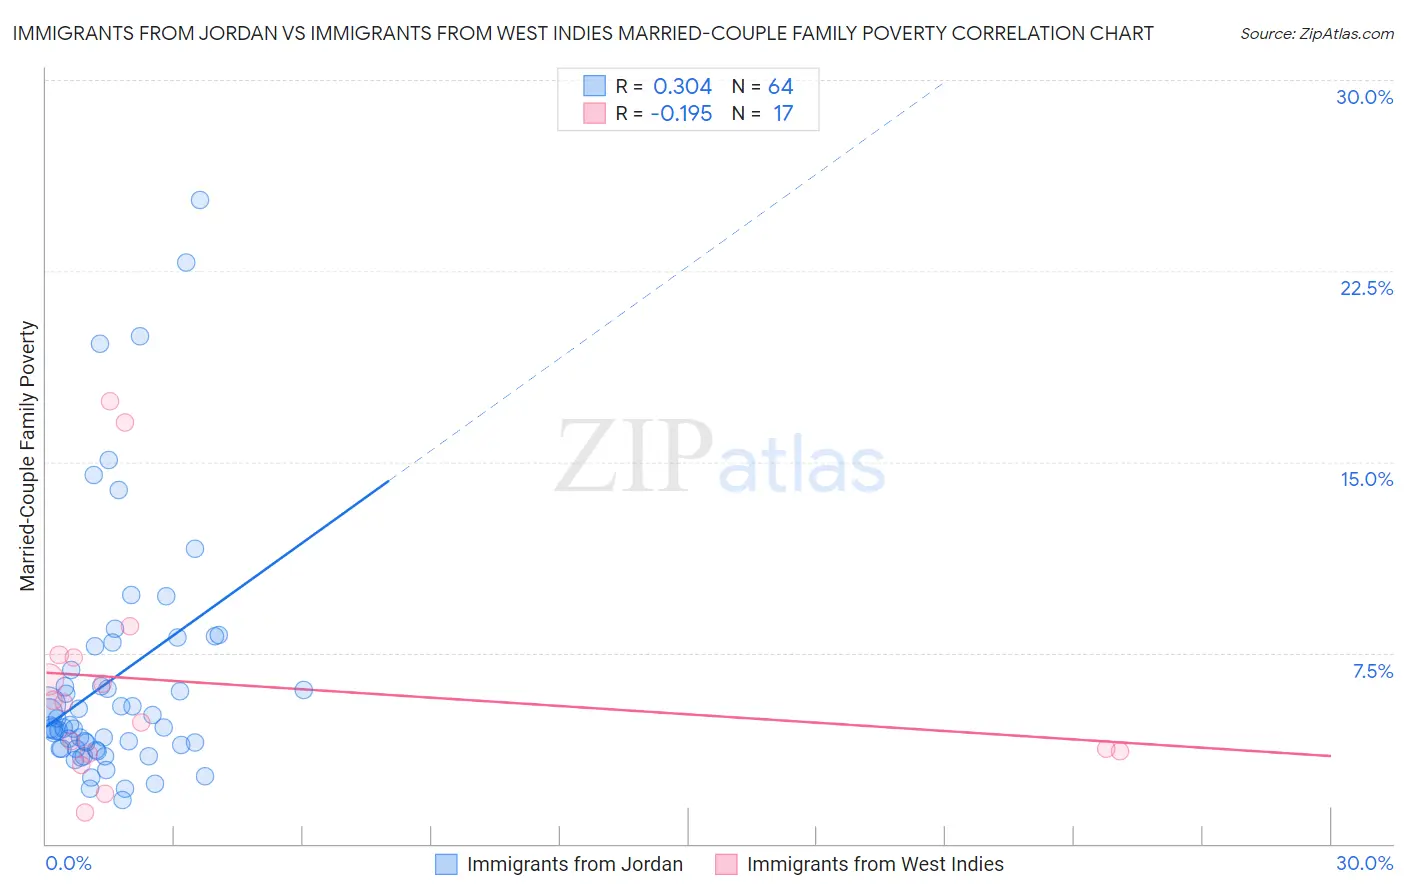
Immigrants from Jordan vs Immigrants from West Indies Married-Couple Family Poverty Correlation Chart
The statistical analysis conducted on geographies consisting of 180,872,287 people shows a mild positive correlation between the proportion of Immigrants from Jordan and poverty level among married-couple families in the United States with a correlation coefficient (R) of 0.304 and weighted average of 5.1%. Similarly, the statistical analysis conducted on geographies consisting of 72,419,228 people shows a poor negative correlation between the proportion of Immigrants from West Indies and poverty level among married-couple families in the United States with a correlation coefficient (R) of -0.195 and weighted average of 6.2%, a difference of 21.5%.
Married-Couple Family Poverty Correlation Summary
| Measurement | Immigrants from Jordan | Immigrants from West Indies |
| Minimum | 1.7% | 1.2% |
| Maximum | 25.3% | 17.4% |
| Range | 23.5% | 16.2% |
| Mean | 6.5% | 6.3% |
| Median | 4.6% | 5.5% |
| Interquartile 25% (IQ1) | 3.7% | 3.6% |
| Interquartile 75% (IQ3) | 7.3% | 7.4% |
| Interquartile Range (IQR) | 3.5% | 3.8% |
| Standard Deviation (Sample) | 4.9% | 4.5% |
| Standard Deviation (Population) | 4.9% | 4.3% |
Similar Demographics by Married-Couple Family Poverty
Demographics Similar to Immigrants from Jordan by Married-Couple Family Poverty
In terms of married-couple family poverty, the demographic groups most similar to Immigrants from Jordan are Ethiopian (5.1%, a difference of 0.22%), Pennsylvania German (5.1%, a difference of 0.27%), Sierra Leonean (5.1%, a difference of 0.31%), Immigrants from South Eastern Asia (5.1%, a difference of 0.53%), and Immigrants from Saudi Arabia (5.1%, a difference of 0.53%).
| Demographics | Rating | Rank | Married-Couple Family Poverty |
| Immigrants | Ethiopia | 72.4 /100 | #155 | Good 5.1% |
| Sri Lankans | 72.2 /100 | #156 | Good 5.1% |
| Argentineans | 70.7 /100 | #157 | Good 5.1% |
| Immigrants | South Eastern Asia | 70.4 /100 | #158 | Good 5.1% |
| Immigrants | Saudi Arabia | 70.3 /100 | #159 | Good 5.1% |
| Pennsylvania Germans | 68.5 /100 | #160 | Good 5.1% |
| Ethiopians | 68.1 /100 | #161 | Good 5.1% |
| Immigrants | Jordan | 66.5 /100 | #162 | Good 5.1% |
| Sierra Leoneans | 64.1 /100 | #163 | Good 5.1% |
| Hawaiians | 62.3 /100 | #164 | Good 5.1% |
| Immigrants | Malaysia | 62.2 /100 | #165 | Good 5.1% |
| Paraguayans | 61.5 /100 | #166 | Good 5.1% |
| Costa Ricans | 61.5 /100 | #167 | Good 5.1% |
| Immigrants | Uganda | 54.9 /100 | #168 | Average 5.2% |
| Ottawa | 54.5 /100 | #169 | Average 5.2% |
Demographics Similar to Immigrants from West Indies by Married-Couple Family Poverty
In terms of married-couple family poverty, the demographic groups most similar to Immigrants from West Indies are Immigrants from Jamaica (6.2%, a difference of 0.040%), Alaska Native (6.2%, a difference of 0.17%), Immigrants from Bahamas (6.2%, a difference of 0.26%), Trinidadian and Tobagonian (6.2%, a difference of 0.29%), and Spanish American (6.2%, a difference of 0.65%).
| Demographics | Rating | Rank | Married-Couple Family Poverty |
| Shoshone | 0.3 /100 | #262 | Tragic 6.1% |
| Immigrants | Senegal | 0.3 /100 | #263 | Tragic 6.1% |
| Immigrants | Congo | 0.2 /100 | #264 | Tragic 6.1% |
| Blackfeet | 0.2 /100 | #265 | Tragic 6.2% |
| Creek | 0.2 /100 | #266 | Tragic 6.2% |
| Spanish Americans | 0.2 /100 | #267 | Tragic 6.2% |
| Alaska Natives | 0.2 /100 | #268 | Tragic 6.2% |
| Immigrants | West Indies | 0.1 /100 | #269 | Tragic 6.2% |
| Immigrants | Jamaica | 0.1 /100 | #270 | Tragic 6.2% |
| Immigrants | Bahamas | 0.1 /100 | #271 | Tragic 6.2% |
| Trinidadians and Tobagonians | 0.1 /100 | #272 | Tragic 6.2% |
| Colville | 0.1 /100 | #273 | Tragic 6.3% |
| Barbadians | 0.1 /100 | #274 | Tragic 6.3% |
| Choctaw | 0.1 /100 | #275 | Tragic 6.3% |
| Yaqui | 0.1 /100 | #276 | Tragic 6.3% |