Immigrants from Jordan vs Puget Sound Salish Married-Couple Family Poverty
COMPARE
Immigrants from Jordan
Puget Sound Salish
Married-Couple Family Poverty
Married-Couple Family Poverty Comparison
Immigrants from Jordan
Puget Sound Salish
5.1%
MARRIED-COUPLE FAMILY POVERTY
66.5/ 100
METRIC RATING
162nd/ 347
METRIC RANK
4.9%
MARRIED-COUPLE FAMILY POVERTY
90.4/ 100
METRIC RATING
132nd/ 347
METRIC RANK
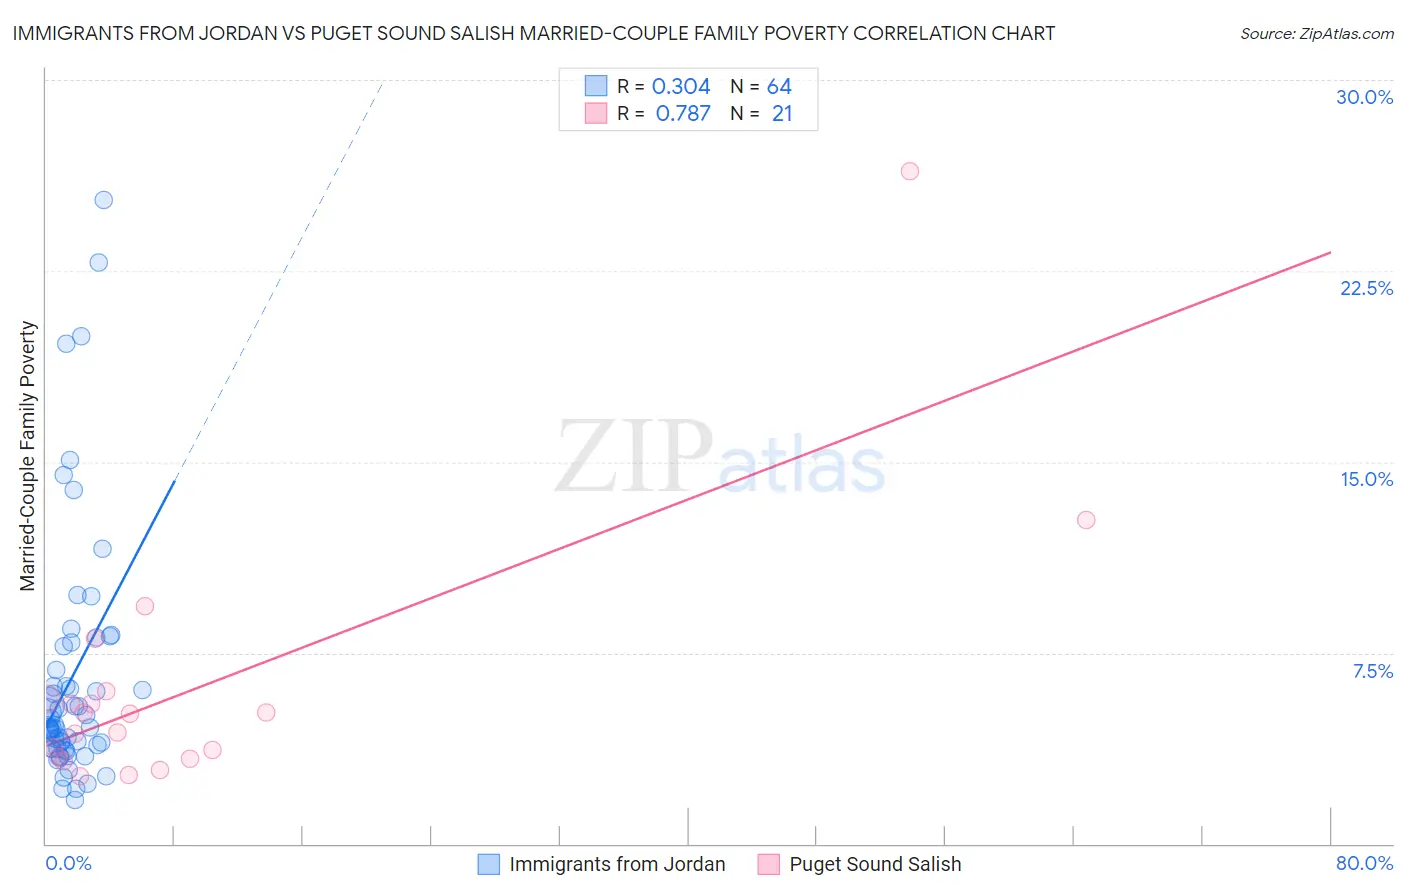
Immigrants from Jordan vs Puget Sound Salish Married-Couple Family Poverty Correlation Chart
The statistical analysis conducted on geographies consisting of 180,872,287 people shows a mild positive correlation between the proportion of Immigrants from Jordan and poverty level among married-couple families in the United States with a correlation coefficient (R) of 0.304 and weighted average of 5.1%. Similarly, the statistical analysis conducted on geographies consisting of 46,044,429 people shows a strong positive correlation between the proportion of Puget Sound Salish and poverty level among married-couple families in the United States with a correlation coefficient (R) of 0.787 and weighted average of 4.9%, a difference of 4.9%.
Married-Couple Family Poverty Correlation Summary
| Measurement | Immigrants from Jordan | Puget Sound Salish |
| Minimum | 1.7% | 2.7% |
| Maximum | 25.3% | 26.4% |
| Range | 23.5% | 23.8% |
| Mean | 6.5% | 6.1% |
| Median | 4.6% | 5.1% |
| Interquartile 25% (IQ1) | 3.7% | 3.4% |
| Interquartile 75% (IQ3) | 7.3% | 5.8% |
| Interquartile Range (IQR) | 3.5% | 2.5% |
| Standard Deviation (Sample) | 4.9% | 5.2% |
| Standard Deviation (Population) | 4.9% | 5.1% |
Similar Demographics by Married-Couple Family Poverty
Demographics Similar to Immigrants from Jordan by Married-Couple Family Poverty
In terms of married-couple family poverty, the demographic groups most similar to Immigrants from Jordan are Ethiopian (5.1%, a difference of 0.22%), Pennsylvania German (5.1%, a difference of 0.27%), Sierra Leonean (5.1%, a difference of 0.31%), Immigrants from South Eastern Asia (5.1%, a difference of 0.53%), and Immigrants from Saudi Arabia (5.1%, a difference of 0.53%).
| Demographics | Rating | Rank | Married-Couple Family Poverty |
| Immigrants | Ethiopia | 72.4 /100 | #155 | Good 5.1% |
| Sri Lankans | 72.2 /100 | #156 | Good 5.1% |
| Argentineans | 70.7 /100 | #157 | Good 5.1% |
| Immigrants | South Eastern Asia | 70.4 /100 | #158 | Good 5.1% |
| Immigrants | Saudi Arabia | 70.3 /100 | #159 | Good 5.1% |
| Pennsylvania Germans | 68.5 /100 | #160 | Good 5.1% |
| Ethiopians | 68.1 /100 | #161 | Good 5.1% |
| Immigrants | Jordan | 66.5 /100 | #162 | Good 5.1% |
| Sierra Leoneans | 64.1 /100 | #163 | Good 5.1% |
| Hawaiians | 62.3 /100 | #164 | Good 5.1% |
| Immigrants | Malaysia | 62.2 /100 | #165 | Good 5.1% |
| Paraguayans | 61.5 /100 | #166 | Good 5.1% |
| Costa Ricans | 61.5 /100 | #167 | Good 5.1% |
| Immigrants | Uganda | 54.9 /100 | #168 | Average 5.2% |
| Ottawa | 54.5 /100 | #169 | Average 5.2% |
Demographics Similar to Puget Sound Salish by Married-Couple Family Poverty
In terms of married-couple family poverty, the demographic groups most similar to Puget Sound Salish are Immigrants from Eastern Europe (4.9%, a difference of 0.010%), Immigrants from Kenya (4.9%, a difference of 0.070%), Soviet Union (4.9%, a difference of 0.080%), Samoan (4.9%, a difference of 0.080%), and Immigrants from Pakistan (4.9%, a difference of 0.090%).
| Demographics | Rating | Rank | Married-Couple Family Poverty |
| Immigrants | Bosnia and Herzegovina | 92.5 /100 | #125 | Exceptional 4.8% |
| Immigrants | Asia | 92.3 /100 | #126 | Exceptional 4.8% |
| Egyptians | 92.0 /100 | #127 | Exceptional 4.8% |
| Palestinians | 91.2 /100 | #128 | Exceptional 4.9% |
| Immigrants | Pakistan | 90.7 /100 | #129 | Exceptional 4.9% |
| Soviet Union | 90.7 /100 | #130 | Exceptional 4.9% |
| Immigrants | Eastern Europe | 90.5 /100 | #131 | Exceptional 4.9% |
| Puget Sound Salish | 90.4 /100 | #132 | Exceptional 4.9% |
| Immigrants | Kenya | 90.2 /100 | #133 | Exceptional 4.9% |
| Samoans | 90.2 /100 | #134 | Exceptional 4.9% |
| Assyrians/Chaldeans/Syriacs | 89.4 /100 | #135 | Excellent 4.9% |
| Immigrants | Hungary | 88.7 /100 | #136 | Excellent 4.9% |
| Guamanians/Chamorros | 86.5 /100 | #137 | Excellent 4.9% |
| Chileans | 86.0 /100 | #138 | Excellent 4.9% |
| German Russians | 85.1 /100 | #139 | Excellent 5.0% |