Immigrants from Jordan vs Immigrants from Middle Africa Married-Couple Family Poverty
COMPARE
Immigrants from Jordan
Immigrants from Middle Africa
Married-Couple Family Poverty
Married-Couple Family Poverty Comparison
Immigrants from Jordan
Immigrants from Middle Africa
5.1%
MARRIED-COUPLE FAMILY POVERTY
66.5/ 100
METRIC RATING
162nd/ 347
METRIC RANK
5.4%
MARRIED-COUPLE FAMILY POVERTY
23.8/ 100
METRIC RATING
202nd/ 347
METRIC RANK
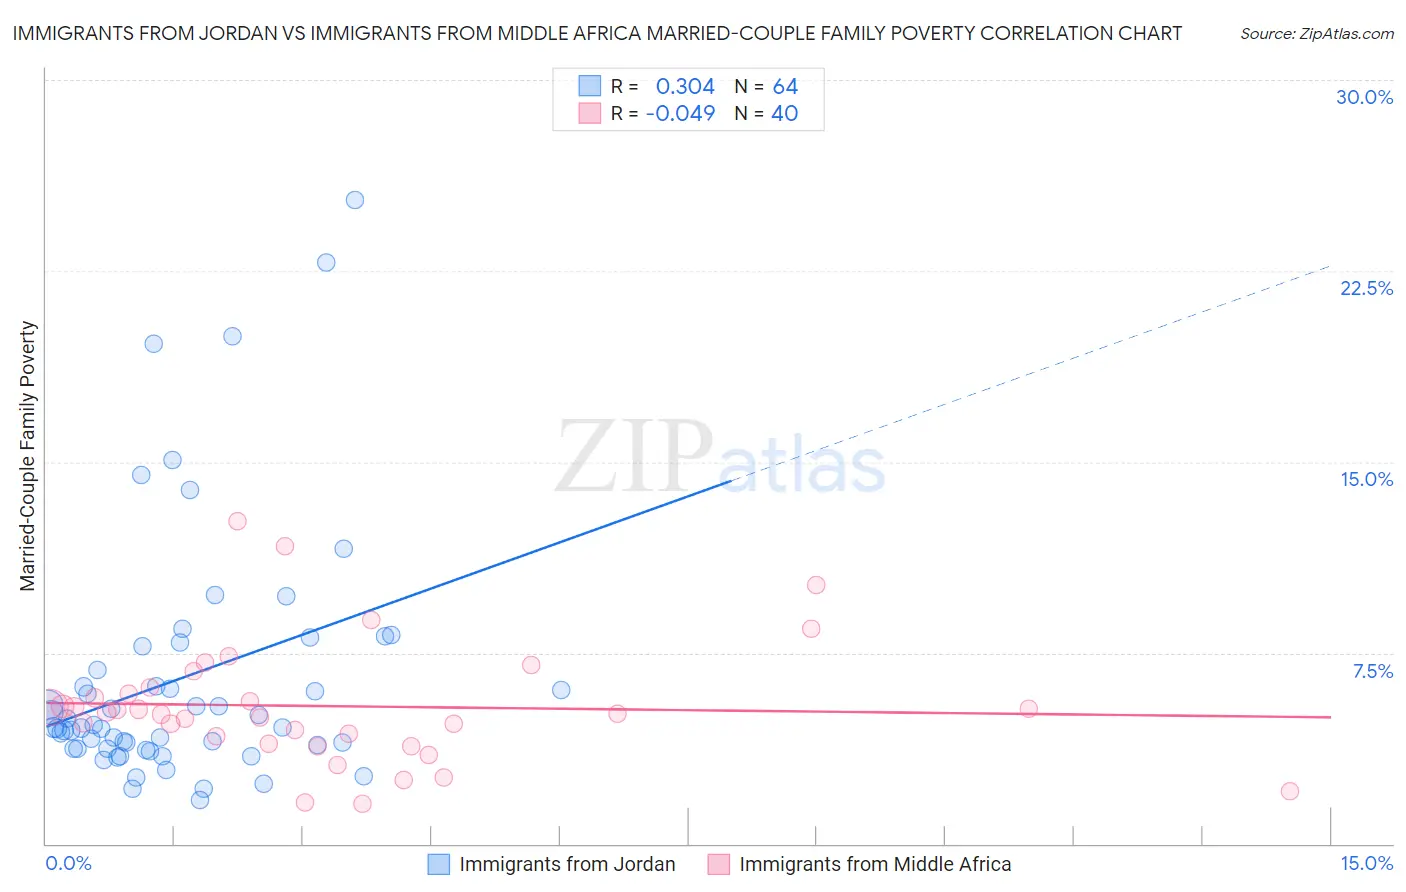
Immigrants from Jordan vs Immigrants from Middle Africa Married-Couple Family Poverty Correlation Chart
The statistical analysis conducted on geographies consisting of 180,872,287 people shows a mild positive correlation between the proportion of Immigrants from Jordan and poverty level among married-couple families in the United States with a correlation coefficient (R) of 0.304 and weighted average of 5.1%. Similarly, the statistical analysis conducted on geographies consisting of 201,849,753 people shows no correlation between the proportion of Immigrants from Middle Africa and poverty level among married-couple families in the United States with a correlation coefficient (R) of -0.049 and weighted average of 5.4%, a difference of 5.5%.
Married-Couple Family Poverty Correlation Summary
| Measurement | Immigrants from Jordan | Immigrants from Middle Africa |
| Minimum | 1.7% | 1.6% |
| Maximum | 25.3% | 12.6% |
| Range | 23.5% | 11.1% |
| Mean | 6.5% | 5.4% |
| Median | 4.6% | 5.1% |
| Interquartile 25% (IQ1) | 3.7% | 4.1% |
| Interquartile 75% (IQ3) | 7.3% | 6.0% |
| Interquartile Range (IQR) | 3.5% | 2.0% |
| Standard Deviation (Sample) | 4.9% | 2.4% |
| Standard Deviation (Population) | 4.9% | 2.4% |
Similar Demographics by Married-Couple Family Poverty
Demographics Similar to Immigrants from Jordan by Married-Couple Family Poverty
In terms of married-couple family poverty, the demographic groups most similar to Immigrants from Jordan are Ethiopian (5.1%, a difference of 0.22%), Pennsylvania German (5.1%, a difference of 0.27%), Sierra Leonean (5.1%, a difference of 0.31%), Immigrants from South Eastern Asia (5.1%, a difference of 0.53%), and Immigrants from Saudi Arabia (5.1%, a difference of 0.53%).
| Demographics | Rating | Rank | Married-Couple Family Poverty |
| Immigrants | Ethiopia | 72.4 /100 | #155 | Good 5.1% |
| Sri Lankans | 72.2 /100 | #156 | Good 5.1% |
| Argentineans | 70.7 /100 | #157 | Good 5.1% |
| Immigrants | South Eastern Asia | 70.4 /100 | #158 | Good 5.1% |
| Immigrants | Saudi Arabia | 70.3 /100 | #159 | Good 5.1% |
| Pennsylvania Germans | 68.5 /100 | #160 | Good 5.1% |
| Ethiopians | 68.1 /100 | #161 | Good 5.1% |
| Immigrants | Jordan | 66.5 /100 | #162 | Good 5.1% |
| Sierra Leoneans | 64.1 /100 | #163 | Good 5.1% |
| Hawaiians | 62.3 /100 | #164 | Good 5.1% |
| Immigrants | Malaysia | 62.2 /100 | #165 | Good 5.1% |
| Paraguayans | 61.5 /100 | #166 | Good 5.1% |
| Costa Ricans | 61.5 /100 | #167 | Good 5.1% |
| Immigrants | Uganda | 54.9 /100 | #168 | Average 5.2% |
| Ottawa | 54.5 /100 | #169 | Average 5.2% |
Demographics Similar to Immigrants from Middle Africa by Married-Couple Family Poverty
In terms of married-couple family poverty, the demographic groups most similar to Immigrants from Middle Africa are Lebanese (5.4%, a difference of 0.060%), Immigrants from Morocco (5.4%, a difference of 0.080%), Uruguayan (5.4%, a difference of 0.19%), Immigrants from Peru (5.4%, a difference of 0.32%), and Immigrants from Belarus (5.4%, a difference of 0.36%).
| Demographics | Rating | Rank | Married-Couple Family Poverty |
| Immigrants | Azores | 27.5 /100 | #195 | Fair 5.4% |
| Spaniards | 27.4 /100 | #196 | Fair 5.4% |
| Liberians | 26.3 /100 | #197 | Fair 5.4% |
| Immigrants | Belarus | 26.2 /100 | #198 | Fair 5.4% |
| Uruguayans | 25.0 /100 | #199 | Fair 5.4% |
| Immigrants | Morocco | 24.3 /100 | #200 | Fair 5.4% |
| Lebanese | 24.1 /100 | #201 | Fair 5.4% |
| Immigrants | Middle Africa | 23.8 /100 | #202 | Fair 5.4% |
| Immigrants | Peru | 21.8 /100 | #203 | Fair 5.4% |
| Immigrants | Costa Rica | 19.4 /100 | #204 | Poor 5.4% |
| Chippewa | 18.9 /100 | #205 | Poor 5.4% |
| Osage | 18.4 /100 | #206 | Poor 5.4% |
| Immigrants | Africa | 17.6 /100 | #207 | Poor 5.5% |
| French American Indians | 16.1 /100 | #208 | Poor 5.5% |
| Immigrants | Syria | 15.4 /100 | #209 | Poor 5.5% |