Immigrants from Jordan vs Chinese Married-Couple Family Poverty

COMPARE

Immigrants from Jordan
Race
Ancestry
AfghanAfricanAlaska NativeAlaskan AthabascanAlbanianAleutAlsatianAmericanApacheArabArapahoArgentineanArmenianAssyrian/Chaldean/SyriacAustralianAustrianBahamianBangladeshiBarbadianBasqueBelgianBelizeanBermudanBhutaneseBlackfeetBolivianBrazilianBritishBritish West IndianBulgarianBurmeseCajunCambodianCanadianCape VerdeanCarpatho RusynCelticCentral AmericanCentral American IndianCherokeeCheyenneChickasawChileanChippewaChoctawColombianColvilleComancheCosta RicanCreeCreekCroatianCrowCubanCypriotCzechCzechoslovakianDanishDelawareDominicanDutchDutch West IndianEastern EuropeanEcuadorianEgyptianEnglishEstonianEthiopianEuropeanFijianFilipinoFinnishFrenchFrench American IndianFrench CanadianGermanGerman RussianGhanaianGreekGuamanian/ChamorroGuatemalanGuyaneseHaitianHmongHonduranHopiHoumaHungarianIcelanderIndian (Asian)IndonesianInupiatIranianIraqiIrishIroquoisIsraeliItalianJamaicanJapaneseJordanianKenyanKiowaKoreanLaotianLatvianLebaneseLiberianLithuanianLumbeeLuxembourgerMacedonianMalaysianMalteseMarshalleseMenomineeMexicanMexican American IndianMongolianMoroccanNative HawaiianNavajoNepaleseNew ZealanderNicaraguanNigerianNorthern EuropeanNorwegianOkinawanOsageOttawaPaiutePakistaniPalestinianPanamanianParaguayanPennsylvania GermanPeruvianPimaPolishPortuguesePotawatomiPuebloPuerto RicanPuget Sound SalishRomanianRussianSalvadoranSamoanScandinavianScotch-IrishScottishSeminoleSenegaleseSerbianShoshoneSierra LeoneanSiouxSlavicSlovakSloveneSomaliSouth AfricanSouth AmericanSouth American IndianSoviet UnionSpaniardSpanishSpanish AmericanSpanish American IndianSri LankanSubsaharan AfricanSudaneseSwedishSwissSyrianTaiwaneseThaiTlingit-HaidaTohono O'OdhamTonganTrinidadian and TobagonianTsimshianTurkishU.S. Virgin IslanderUgandanUkrainianUruguayanUteVenezuelanVietnameseWelshWest IndianYakamaYaquiYugoslavianYumanYup'ikZimbabwean
Immigration
NonimmigrantsImmigrantsAfghanistanAfricaAlbaniaArgentinaArmeniaAsiaAustraliaAustriaBahamasBangladeshBarbadosBelarusBelgiumBelizeBoliviaBosnia and HerzegovinaBrazilBulgariaBurma/MyanmarCabo VerdeCambodiaCameroonCanadaCaribbeanCentral AmericaChileChinaColombiaCongoCosta RicaCroatiaCubaCzechoslovakiaDenmarkDominicaDominican RepublicEastern AfricaEastern AsiaEastern EuropeEcuadorEgyptEl SalvadorEnglandEritreaEthiopiaEuropeFijiFranceGermanyGhanaGreeceGrenadaGuatemalaGuyanaHaitiHondurasHong KongHungaryIndiaIndonesiaIranIraqIrelandIsraelItalyJamaicaJapanJordanKazakhstanKenyaKoreaKuwaitLaosLatin AmericaLatviaLebanonLiberiaLithuaniaMalaysiaMexicoMicronesiaMiddle AfricaMoldovaMoroccoNepalNetherlandsNicaraguaNigeriaNorth AmericaNorth MacedoniaNorthern AfricaNorthern EuropeNorwayOceaniaPakistanPanamaPeruPhilippinesPolandPortugalRomaniaRussiaSaudi ArabiaScotlandSenegalSerbiaSierra LeoneSingaporeSomaliaSouth AfricaSouth AmericaSouth Central AsiaSouth Eastern AsiaSouthern EuropeSpainSri LankaSt. Vincent and the GrenadinesSudanSwedenSwitzerlandSyriaTaiwanThailandTrinidad and TobagoTurkeyUgandaUkraineUruguayUzbekistanVenezuelaVietnamWest IndiesWestern AfricaWestern AsiaWestern EuropeYemenZaireZimbabweAzores
Chinese
Race
Ancestry
AfghanAfricanAlaska NativeAlaskan AthabascanAlbanianAleutAlsatianAmericanApacheArabArapahoArgentineanArmenianAssyrian/Chaldean/SyriacAustralianAustrianBahamianBangladeshiBarbadianBasqueBelgianBelizeanBermudanBhutaneseBlackfeetBolivianBrazilianBritishBritish West IndianBulgarianBurmeseCajunCambodianCanadianCape VerdeanCarpatho RusynCelticCentral AmericanCentral American IndianCherokeeCheyenneChickasawChileanChineseChippewaChoctawColombianColvilleComancheCosta RicanCreeCreekCroatianCrowCubanCypriotCzechCzechoslovakianDanishDelawareDominicanDutchDutch West IndianEastern EuropeanEcuadorianEgyptianEnglishEstonianEthiopianEuropeanFijianFilipinoFinnishFrenchFrench American IndianFrench CanadianGermanGerman RussianGhanaianGreekGuamanian/ChamorroGuatemalanGuyaneseHaitianHmongHonduranHopiHoumaHungarianIcelanderIndian (Asian)IndonesianInupiatIranianIraqiIrishIroquoisIsraeliItalianJamaicanJapaneseJordanianKenyanKiowaKoreanLaotianLatvianLebaneseLiberianLithuanianLumbeeLuxembourgerMacedonianMalaysianMalteseMarshalleseMenomineeMexicanMexican American IndianMongolianMoroccanNative HawaiianNavajoNepaleseNew ZealanderNicaraguanNigerianNorthern EuropeanNorwegianOkinawanOsageOttawaPaiutePakistaniPalestinianPanamanianParaguayanPennsylvania GermanPeruvianPimaPolishPortuguesePotawatomiPuebloPuerto RicanPuget Sound SalishRomanianRussianSalvadoranSamoanScandinavianScotch-IrishScottishSeminoleSenegaleseSerbianShoshoneSierra LeoneanSiouxSlavicSlovakSloveneSomaliSouth AfricanSouth AmericanSouth American IndianSoviet UnionSpaniardSpanishSpanish AmericanSpanish American IndianSri LankanSubsaharan AfricanSudaneseSwedishSwissSyrianTaiwaneseThaiTlingit-HaidaTohono O'OdhamTonganTrinidadian and TobagonianTsimshianTurkishU.S. Virgin IslanderUgandanUkrainianUruguayanUteVenezuelanVietnameseWelshWest IndianYakamaYaquiYugoslavianYumanYup'ikZimbabwean
Immigration
NonimmigrantsImmigrantsAfghanistanAfricaAlbaniaArgentinaArmeniaAsiaAustraliaAustriaBahamasBangladeshBarbadosBelarusBelgiumBelizeBoliviaBosnia and HerzegovinaBrazilBulgariaBurma/MyanmarCabo VerdeCambodiaCameroonCanadaCaribbeanCentral AmericaChileChinaColombiaCongoCosta RicaCroatiaCubaCzechoslovakiaDenmarkDominicaDominican RepublicEastern AfricaEastern AsiaEastern EuropeEcuadorEgyptEl SalvadorEnglandEritreaEthiopiaEuropeFijiFranceGermanyGhanaGreeceGrenadaGuatemalaGuyanaHaitiHondurasHong KongHungaryIndiaIndonesiaIranIraqIrelandIsraelItalyJamaicaJapanKazakhstanKenyaKoreaKuwaitLaosLatin AmericaLatviaLebanonLiberiaLithuaniaMalaysiaMexicoMicronesiaMiddle AfricaMoldovaMoroccoNepalNetherlandsNicaraguaNigeriaNorth AmericaNorth MacedoniaNorthern AfricaNorthern EuropeNorwayOceaniaPakistanPanamaPeruPhilippinesPolandPortugalRomaniaRussiaSaudi ArabiaScotlandSenegalSerbiaSierra LeoneSingaporeSomaliaSouth AfricaSouth AmericaSouth Central AsiaSouth Eastern AsiaSouthern EuropeSpainSri LankaSt. Vincent and the GrenadinesSudanSwedenSwitzerlandSyriaTaiwanThailandTrinidad and TobagoTurkeyUgandaUkraineUruguayUzbekistanVenezuelaVietnamWest IndiesWestern AfricaWestern AsiaWestern EuropeYemenZaireZimbabweAzores
Married-Couple Family Poverty
Income
Poverty
Unemployment
Labor Participation
Family Structure
Vehicle Availability
Education Level
Disability

Married-Couple Family Poverty Comparison

Immigrants from Jordan

Chinese

Good
Exceptional
5.1%
MARRIED-COUPLE FAMILY POVERTY
66.5/ 100
METRIC RATING
162nd/ 347
METRIC RANK
3.6%
MARRIED-COUPLE FAMILY POVERTY
100.0/ 100
METRIC RATING
2nd/ 347
METRIC RANK

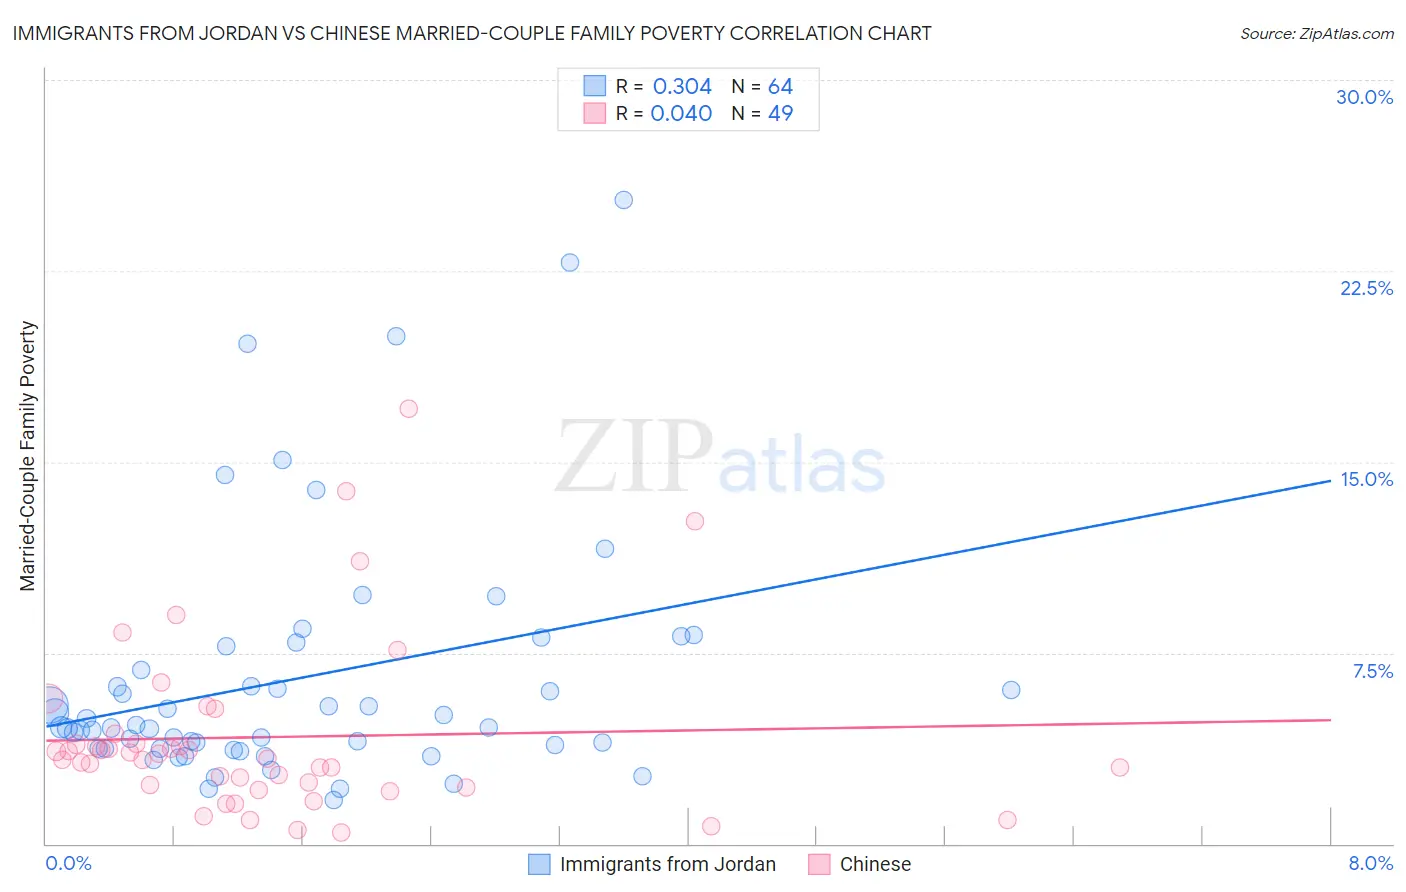
Immigrants from Jordan vs Chinese Married-Couple Family Poverty Correlation Chart

The statistical analysis conducted on geographies consisting of 180,872,287 people shows a mild positive correlation between the proportion of Immigrants from Jordan and poverty level among married-couple families in the United States with a correlation coefficient (R) of 0.304 and weighted average of 5.1%. Similarly, the statistical analysis conducted on geographies consisting of 64,670,469 people shows no correlation between the proportion of Chinese and poverty level among married-couple families in the United States with a correlation coefficient (R) of 0.040 and weighted average of 3.6%, a difference of 40.3%.
Immigrants from Jordan vs Chinese Married-Couple Family Poverty

Married-Couple Family Poverty Correlation Summary

MeasurementImmigrants from JordanChinese
Minimum1.7%0.44%
Maximum25.3%17.1%
Range23.5%16.7%
Mean6.5%4.2%
Median4.6%3.3%
Interquartile 25% (IQ1)3.7%2.2%
Interquartile 75% (IQ3)7.3%4.1%
Interquartile Range (IQR)3.5%1.9%
Standard Deviation (Sample)4.9%3.4%
Standard Deviation (Population)4.9%3.4%

Similar Demographics by Married-Couple Family Poverty

Demographics Similar to Immigrants from Jordan by Married-Couple Family Poverty

In terms of married-couple family poverty, the demographic groups most similar to Immigrants from Jordan are Ethiopian (5.1%, a difference of 0.22%), Pennsylvania German (5.1%, a difference of 0.27%), Sierra Leonean (5.1%, a difference of 0.31%), Immigrants from South Eastern Asia (5.1%, a difference of 0.53%), and Immigrants from Saudi Arabia (5.1%, a difference of 0.53%).
DemographicsRating | RankMarried-Couple Family Poverty
Immigrants | Ethiopia
72.4
/100
|
#155
Good
5.1%
Sri Lankans
72.2
/100
|
#156
Good
5.1%
Argentineans
70.7
/100
|
#157
Good
5.1%
Immigrants | South Eastern Asia
70.4
/100
|
#158
Good
5.1%
Immigrants | Saudi Arabia
70.3
/100
|
#159
Good
5.1%
Pennsylvania Germans
68.5
/100
|
#160
Good
5.1%
Ethiopians
68.1
/100
|
#161
Good
5.1%
Immigrants | Jordan
66.5
/100
|
#162
Good
5.1%
Sierra Leoneans
64.1
/100
|
#163
Good
5.1%
Hawaiians
62.3
/100
|
#164
Good
5.1%
Immigrants | Malaysia
62.2
/100
|
#165
Good
5.1%
Paraguayans
61.5
/100
|
#166
Good
5.1%
Costa Ricans
61.5
/100
|
#167
Good
5.1%
Immigrants | Uganda
54.9
/100
|
#168
Average
5.2%
Ottawa
54.5
/100
|
#169
Average
5.2%

Demographics Similar to Chinese by Married-Couple Family Poverty

In terms of married-couple family poverty, the demographic groups most similar to Chinese are Immigrants from India (3.6%, a difference of 0.18%), Norwegian (3.7%, a difference of 1.9%), Slovene (3.8%, a difference of 5.6%), Swedish (3.9%, a difference of 5.7%), and Luxembourger (3.9%, a difference of 6.4%).
DemographicsRating | RankMarried-Couple Family Poverty
Immigrants | India
100.0
/100
|
#1
Exceptional
3.6%
Chinese
100.0
/100
|
#2
Exceptional
3.6%
Norwegians
100.0
/100
|
#3
Exceptional
3.7%
Slovenes
100.0
/100
|
#4
Exceptional
3.8%
Swedes
100.0
/100
|
#5
Exceptional
3.9%
Luxembourgers
100.0
/100
|
#6
Exceptional
3.9%
Latvians
100.0
/100
|
#7
Exceptional
3.9%
Thais
100.0
/100
|
#8
Exceptional
3.9%
Croatians
100.0
/100
|
#9
Exceptional
3.9%
Carpatho Rusyns
100.0
/100
|
#10
Exceptional
3.9%
Lithuanians
100.0
/100
|
#11
Exceptional
4.0%
Bulgarians
100.0
/100
|
#12
Exceptional
4.0%
Czechs
100.0
/100
|
#13
Exceptional
4.0%
Slovaks
100.0
/100
|
#14
Exceptional
4.0%
Poles
100.0
/100
|
#15
Exceptional
4.0%