Afghan 3 or more Vehicles in Household
COMPARE
Afghan
Select to Compare
3 or more Vehicles in Household
Afghan 3 or more Vehicles in Household
21.7%
3+ VEHICLES AVAILABLE
99.7/ 100
METRIC RATING
80th/ 347
METRIC RANK
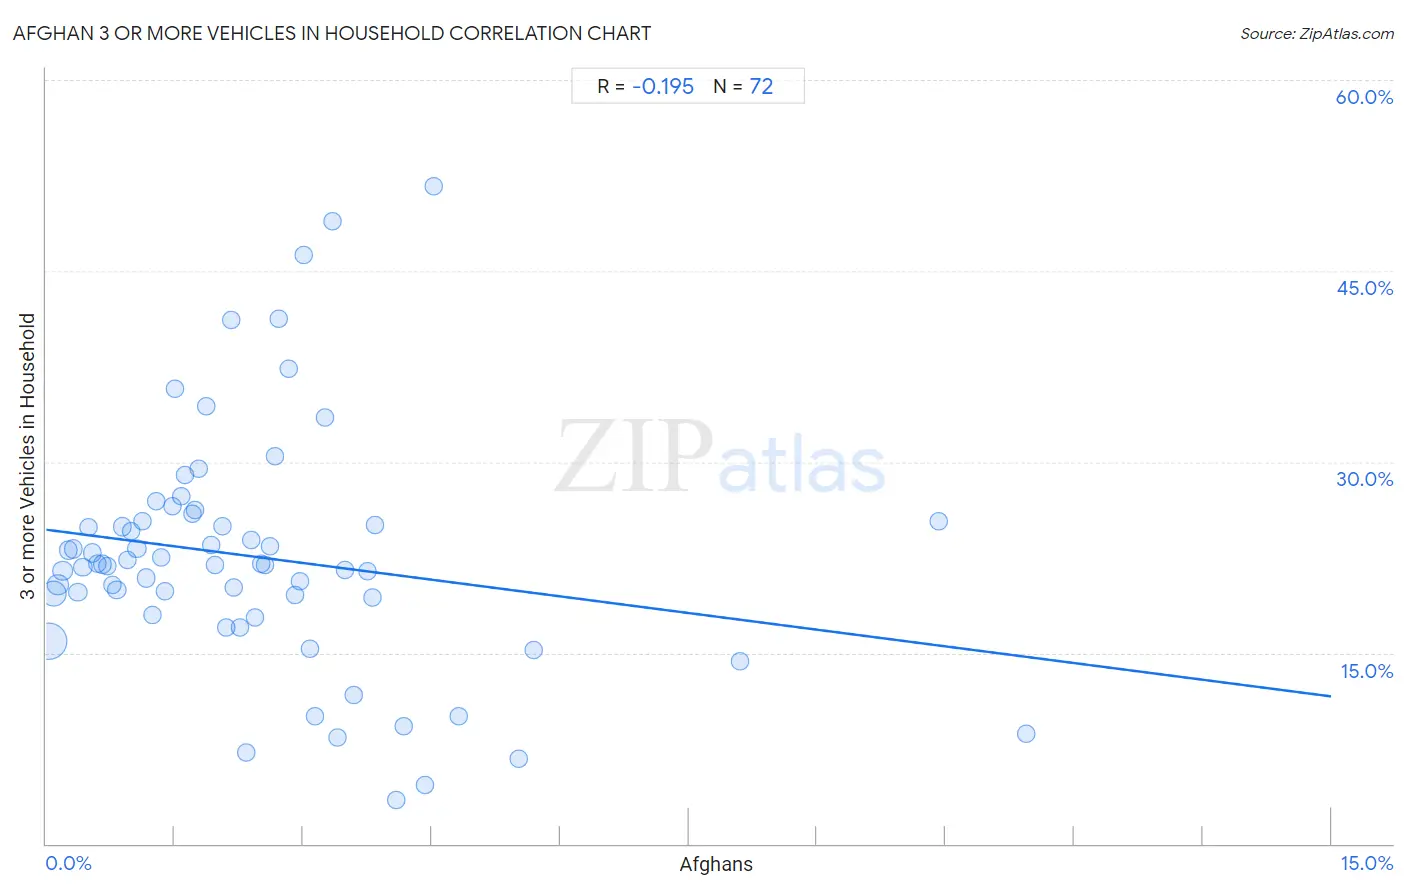
Afghan 3 or more Vehicles in Household Correlation Chart
The statistical analysis conducted on geographies consisting of 148,806,002 people shows a poor negative correlation between the proportion of Afghans and percentage of households with 3 or more vehicles available in the United States with a correlation coefficient (R) of -0.195 and weighted average of 21.7%. On average, for every 1% (one percent) increase in Afghans within a typical geography, there is a decrease of 0.87% in percentage of households with 3 or more vehicles available.
It is essential to understand that the correlation between the percentage of Afghans and percentage of households with 3 or more vehicles available does not imply a direct cause-and-effect relationship. It remains uncertain whether the presence of Afghans influences an upward or downward trend in the level of percentage of households with 3 or more vehicles available within an area, or if Afghans simply ended up residing in those areas with higher or lower levels of percentage of households with 3 or more vehicles available due to other factors.
Demographics Similar to Afghans by 3 or more Vehicles in Household
In terms of 3 or more vehicles in household, the demographic groups most similar to Afghans are Celtic (21.7%, a difference of 0.070%), Assyrian/Chaldean/Syriac (21.7%, a difference of 0.20%), Czechoslovakian (21.7%, a difference of 0.21%), Irish (21.8%, a difference of 0.34%), and Nonimmigrants (21.8%, a difference of 0.41%).
| Demographics | Rating | Rank | 3 or more Vehicles in Household |
| Salvadorans | 99.8 /100 | #73 | Exceptional 21.8% |
| Immigrants from Oceania | 99.8 /100 | #74 | Exceptional 21.8% |
| Japanese | 99.8 /100 | #75 | Exceptional 21.8% |
| Nonimmigrants | 99.8 /100 | #76 | Exceptional 21.8% |
| Irish | 99.8 /100 | #77 | Exceptional 21.8% |
| Czechoslovakians | 99.8 /100 | #78 | Exceptional 21.7% |
| Assyrians/Chaldeans/Syriacs | 99.8 /100 | #79 | Exceptional 21.7% |
| Afghans | 99.7 /100 | #80 | Exceptional 21.7% |
| Celtics | 99.7 /100 | #81 | Exceptional 21.7% |
| Immigrants from El Salvador | 99.6 /100 | #82 | Exceptional 21.5% |
| Chippewa | 99.6 /100 | #83 | Exceptional 21.5% |
| Icelanders | 99.6 /100 | #84 | Exceptional 21.5% |
| Laotians | 99.6 /100 | #85 | Exceptional 21.5% |
| Delaware | 99.6 /100 | #86 | Exceptional 21.5% |
| Immigrants from the Azores | 99.5 /100 | #87 | Exceptional 21.5% |
Afghan 3 or more Vehicles in Household Correlation Summary
| Measurement | Afghan Data | 3 or more Vehicles in Household Data |
| Minimum | 0.028% | 3.4% |
| Maximum | 11.4% | 51.7% |
| Range | 11.4% | 48.3% |
| Mean | 2.4% | 22.5% |
| Median | 2.1% | 21.9% |
| Interquartile 25% (IQ1) | 1.0% | 18.6% |
| Interquartile 75% (IQ3) | 3.2% | 25.3% |
| Interquartile Range (IQR) | 2.2% | 6.7% |
| Standard Deviation (Sample) | 2.1% | 9.4% |
| Standard Deviation (Population) | 2.1% | 9.4% |
Correlation Details
| Afghan Percentile | Sample Size | 3 or more Vehicles in Household |
[ 0.0% - 0.5% ] 0.028% | 72,296,461 | 15.9% |
[ 0.0% - 0.5% ] 0.085% | 30,284,469 | 19.7% |
[ 0.0% - 0.5% ] 0.14% | 11,219,000 | 20.3% |
[ 0.0% - 0.5% ] 0.20% | 8,351,608 | 21.5% |
[ 0.0% - 0.5% ] 0.26% | 3,526,270 | 23.1% |
[ 0.0% - 0.5% ] 0.31% | 3,165,092 | 23.2% |
[ 0.0% - 0.5% ] 0.37% | 2,173,681 | 19.8% |
[ 0.0% - 0.5% ] 0.43% | 2,102,011 | 21.7% |
[ 0.0% - 0.5% ] 0.49% | 1,763,757 | 24.8% |
[ 0.5% - 1.0% ] 0.54% | 1,469,597 | 22.8% |
[ 0.5% - 1.0% ] 0.60% | 1,020,314 | 22.0% |
[ 0.5% - 1.0% ] 0.66% | 896,747 | 22.0% |
[ 0.5% - 1.0% ] 0.71% | 1,044,547 | 21.8% |
[ 0.5% - 1.0% ] 0.77% | 688,188 | 20.3% |
[ 0.5% - 1.0% ] 0.82% | 697,136 | 20.0% |
[ 0.5% - 1.0% ] 0.88% | 1,059,792 | 24.9% |
[ 0.5% - 1.0% ] 0.95% | 515,730 | 22.3% |
[ 0.5% - 1.0% ] 0.99% | 549,759 | 24.6% |
[ 1.0% - 1.5% ] 1.06% | 537,983 | 23.2% |
[ 1.0% - 1.5% ] 1.13% | 512,179 | 25.3% |
[ 1.0% - 1.5% ] 1.16% | 778,034 | 20.9% |
[ 1.0% - 1.5% ] 1.24% | 220,100 | 17.9% |
[ 1.0% - 1.5% ] 1.28% | 298,164 | 26.9% |
[ 1.0% - 1.5% ] 1.35% | 307,688 | 22.5% |
[ 1.0% - 1.5% ] 1.39% | 237,569 | 19.8% |
[ 1.0% - 1.5% ] 1.47% | 234,792 | 26.5% |
[ 1.5% - 2.0% ] 1.51% | 130,519 | 35.8% |
[ 1.5% - 2.0% ] 1.58% | 63,675 | 27.3% |
[ 1.5% - 2.0% ] 1.63% | 193,212 | 29.0% |
[ 1.5% - 2.0% ] 1.71% | 220,784 | 26.0% |
[ 1.5% - 2.0% ] 1.73% | 118,452 | 26.3% |
[ 1.5% - 2.0% ] 1.78% | 105,622 | 29.5% |
[ 1.5% - 2.0% ] 1.87% | 100,865 | 34.3% |
[ 1.5% - 2.0% ] 1.92% | 128,760 | 23.5% |
[ 1.5% - 2.0% ] 1.97% | 199,909 | 21.9% |
[ 2.0% - 2.5% ] 2.05% | 163,413 | 24.9% |
[ 2.0% - 2.5% ] 2.10% | 40,892 | 17.0% |
[ 2.0% - 2.5% ] 2.17% | 96,006 | 41.2% |
[ 2.0% - 2.5% ] 2.19% | 99,912 | 20.1% |
[ 2.0% - 2.5% ] 2.26% | 192,523 | 17.0% |
[ 2.0% - 2.5% ] 2.34% | 49,711 | 7.2% |
[ 2.0% - 2.5% ] 2.39% | 76,570 | 23.9% |
[ 2.0% - 2.5% ] 2.44% | 78,508 | 17.8% |
[ 2.5% - 3.0% ] 2.50% | 17,926 | 22.0% |
[ 2.5% - 3.0% ] 2.55% | 28,088 | 21.9% |
[ 2.5% - 3.0% ] 2.61% | 35,162 | 23.3% |
[ 2.5% - 3.0% ] 2.68% | 1,607 | 30.4% |
[ 2.5% - 3.0% ] 2.72% | 1,176 | 41.2% |
[ 2.5% - 3.0% ] 2.83% | 153,323 | 37.3% |
[ 2.5% - 3.0% ] 2.90% | 24,438 | 19.6% |
[ 2.5% - 3.0% ] 2.96% | 10,976 | 20.7% |
[ 2.5% - 3.0% ] 3.00% | 767 | 46.2% |
[ 3.0% - 3.5% ] 3.08% | 23,756 | 15.3% |
[ 3.0% - 3.5% ] 3.14% | 19,531 | 10.0% |
[ 3.0% - 3.5% ] 3.26% | 3,404 | 33.5% |
[ 3.0% - 3.5% ] 3.34% | 35,001 | 48.9% |
[ 3.0% - 3.5% ] 3.40% | 6,884 | 8.3% |
[ 3.0% - 3.5% ] 3.48% | 10,400 | 21.5% |
[ 3.5% - 4.0% ] 3.58% | 29,132 | 11.7% |
[ 3.5% - 4.0% ] 3.75% | 60,625 | 21.4% |
[ 3.5% - 4.0% ] 3.81% | 76,761 | 19.3% |
[ 3.5% - 4.0% ] 3.83% | 3,262 | 25.0% |
[ 4.0% - 4.5% ] 4.08% | 1,936 | 3.4% |
[ 4.0% - 4.5% ] 4.17% | 24,785 | 9.3% |
[ 4.0% - 4.5% ] 4.42% | 34,082 | 4.6% |
[ 4.5% - 5.0% ] 4.53% | 2,694 | 51.7% |
[ 4.5% - 5.0% ] 4.82% | 16,050 | 10.0% |
[ 5.5% - 6.0% ] 5.51% | 37,310 | 6.7% |
[ 5.5% - 6.0% ] 5.69% | 96,076 | 15.2% |
[ 8.0% - 8.5% ] 8.10% | 37,436 | 14.3% |
[ 10.0% - 10.5% ] 10.42% | 1,200 | 25.4% |
[ 11.0% - 11.5% ] 11.43% | 2,213 | 8.7% |