Afghan Unemployment Among Women with Children Ages 6 to 17 years
COMPARE
Afghan
Select to Compare
Unemployment Among Women with Children Ages 6 to 17 years
Afghan Unemployment Among Women with Children Ages 6 to 17 years
7.6%
UNEMPLOYMENT | WOMEN W/ CHILDREN 6 TO 17
100.0/ 100
METRIC RATING
18th/ 347
METRIC RANK
Afghan Unemployment Among Women with Children Ages 6 to 17 years Correlation Chart
The statistical analysis conducted on geographies consisting of 127,639,249 people shows a mild negative correlation between the proportion of Afghans and unemployment rate among women with children between the ages 6 and 17 in the United States with a correlation coefficient (R) of -0.307 and weighted average of 7.6%. On average, for every 1% (one percent) increase in Afghans within a typical geography, there is a decrease of 0.76% in unemployment rate among women with children between the ages 6 and 17.
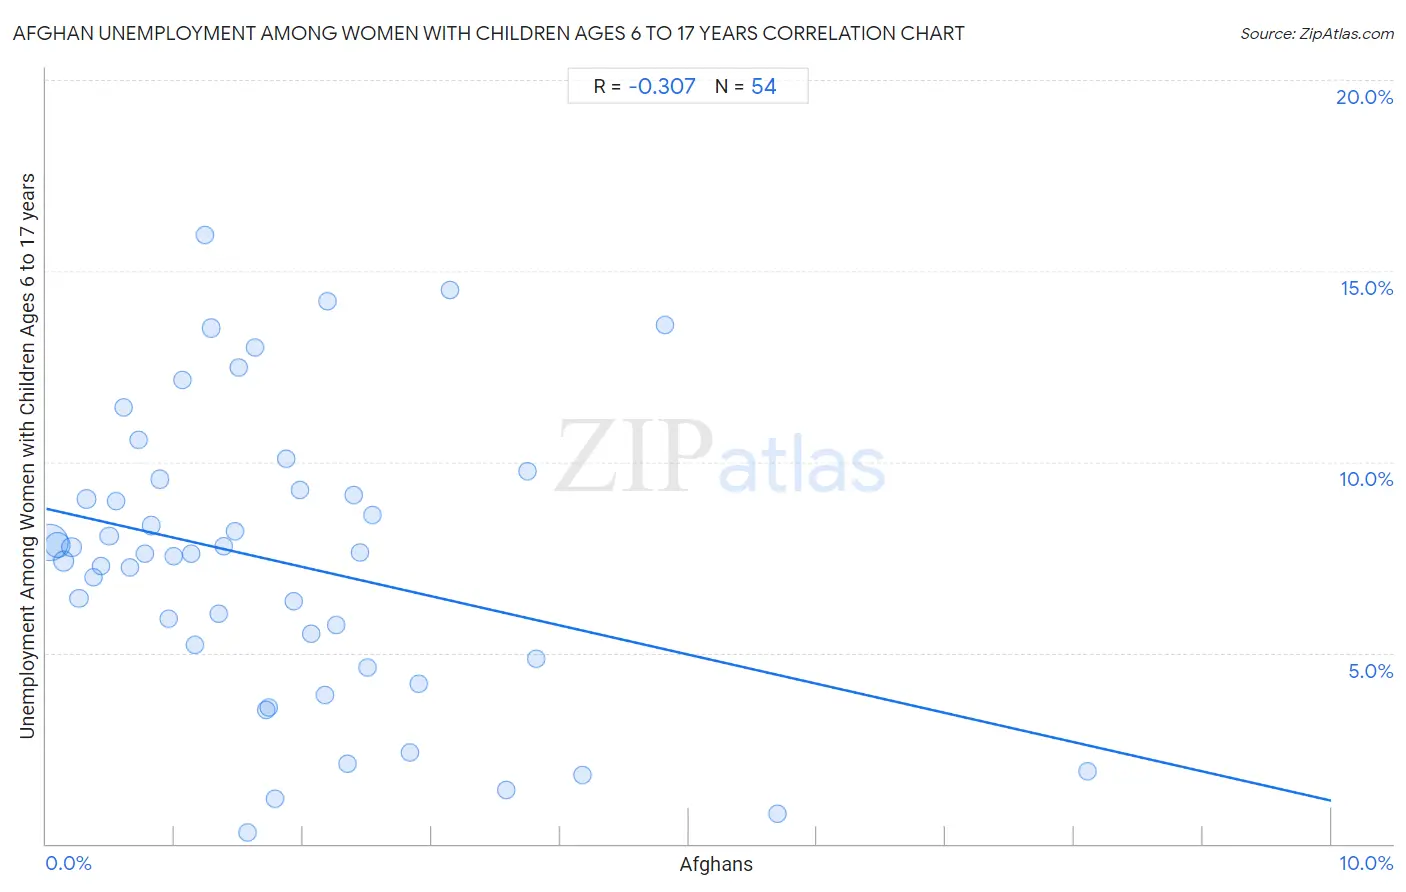
It is essential to understand that the correlation between the percentage of Afghans and unemployment rate among women with children between the ages 6 and 17 does not imply a direct cause-and-effect relationship. It remains uncertain whether the presence of Afghans influences an upward or downward trend in the level of unemployment rate among women with children between the ages 6 and 17 within an area, or if Afghans simply ended up residing in those areas with higher or lower levels of unemployment rate among women with children between the ages 6 and 17 due to other factors.
Demographics Similar to Afghans by Unemployment Among Women with Children Ages 6 to 17 years
In terms of unemployment among women with children ages 6 to 17 years, the demographic groups most similar to Afghans are Filipino (7.6%, a difference of 0.020%), Cambodian (7.5%, a difference of 0.65%), Immigrants from Burma/Myanmar (7.5%, a difference of 0.84%), Immigrants from Singapore (7.7%, a difference of 1.0%), and Immigrants from India (7.7%, a difference of 1.2%).
| Demographics | Rating | Rank | Unemployment Among Women with Children Ages 6 to 17 years |
| Immigrants from Taiwan | 100.0 /100 | #11 | Exceptional 7.3% |
| Bangladeshis | 100.0 /100 | #12 | Exceptional 7.4% |
| Indonesians | 100.0 /100 | #13 | Exceptional 7.4% |
| Sudanese | 100.0 /100 | #14 | Exceptional 7.4% |
| Puget Sound Salish | 100.0 /100 | #15 | Exceptional 7.5% |
| Immigrants from Burma/Myanmar | 100.0 /100 | #16 | Exceptional 7.5% |
| Cambodians | 100.0 /100 | #17 | Exceptional 7.5% |
| Afghans | 100.0 /100 | #18 | Exceptional 7.6% |
| Filipinos | 100.0 /100 | #19 | Exceptional 7.6% |
| Immigrants from Singapore | 100.0 /100 | #20 | Exceptional 7.7% |
| Immigrants from India | 100.0 /100 | #21 | Exceptional 7.7% |
| Immigrants from China | 100.0 /100 | #22 | Exceptional 7.7% |
| Immigrants from Indonesia | 100.0 /100 | #23 | Exceptional 7.7% |
| Nepalese | 100.0 /100 | #24 | Exceptional 7.7% |
| Immigrants from Eastern Asia | 100.0 /100 | #25 | Exceptional 7.7% |
Afghan Unemployment Among Women with Children Ages 6 to 17 years Correlation Summary
| Measurement | Afghan Data | Unemployment Among Women with Children Ages 6 to 17 years Data |
| Minimum | 0.028% | 0.30% |
| Maximum | 8.1% | 15.9% |
| Range | 8.1% | 15.6% |
| Mean | 1.8% | 7.4% |
| Median | 1.5% | 7.6% |
| Interquartile 25% (IQ1) | 0.77% | 4.8% |
| Interquartile 75% (IQ3) | 2.4% | 9.3% |
| Interquartile Range (IQR) | 1.6% | 4.4% |
| Standard Deviation (Sample) | 1.5% | 3.8% |
| Standard Deviation (Population) | 1.5% | 3.7% |
Correlation Details
| Afghan Percentile | Sample Size | Unemployment Among Women with Children Ages 6 to 17 years |
[ 0.0% - 0.5% ] 0.028% | 65,481,433 | 7.9% |
[ 0.0% - 0.5% ] 0.085% | 26,006,235 | 7.8% |
[ 0.0% - 0.5% ] 0.14% | 9,535,218 | 7.4% |
[ 0.0% - 0.5% ] 0.20% | 6,517,101 | 7.8% |
[ 0.0% - 0.5% ] 0.26% | 2,743,274 | 6.4% |
[ 0.0% - 0.5% ] 0.31% | 2,387,966 | 9.0% |
[ 0.0% - 0.5% ] 0.37% | 1,639,280 | 7.0% |
[ 0.0% - 0.5% ] 0.43% | 1,559,715 | 7.3% |
[ 0.0% - 0.5% ] 0.49% | 1,059,349 | 8.0% |
[ 0.5% - 1.0% ] 0.54% | 995,129 | 9.0% |
[ 0.5% - 1.0% ] 0.60% | 783,458 | 11.4% |
[ 0.5% - 1.0% ] 0.65% | 563,920 | 7.2% |
[ 0.5% - 1.0% ] 0.72% | 854,284 | 10.6% |
[ 0.5% - 1.0% ] 0.77% | 548,674 | 7.6% |
[ 0.5% - 1.0% ] 0.82% | 564,080 | 8.3% |
[ 0.5% - 1.0% ] 0.88% | 941,156 | 9.5% |
[ 0.5% - 1.0% ] 0.95% | 329,671 | 5.9% |
[ 0.5% - 1.0% ] 0.99% | 429,010 | 7.5% |
[ 1.0% - 1.5% ] 1.06% | 241,725 | 12.1% |
[ 1.0% - 1.5% ] 1.13% | 468,635 | 7.6% |
[ 1.0% - 1.5% ] 1.16% | 639,696 | 5.2% |
[ 1.0% - 1.5% ] 1.24% | 180,033 | 15.9% |
[ 1.0% - 1.5% ] 1.28% | 282,916 | 13.5% |
[ 1.0% - 1.5% ] 1.34% | 211,176 | 6.0% |
[ 1.0% - 1.5% ] 1.39% | 167,601 | 7.8% |
[ 1.0% - 1.5% ] 1.47% | 211,129 | 8.2% |
[ 1.0% - 1.5% ] 1.50% | 91,984 | 12.5% |
[ 1.5% - 2.0% ] 1.57% | 41,967 | 0.30% |
[ 1.5% - 2.0% ] 1.62% | 171,814 | 13.0% |
[ 1.5% - 2.0% ] 1.71% | 219,848 | 3.5% |
[ 1.5% - 2.0% ] 1.73% | 111,426 | 3.6% |
[ 1.5% - 2.0% ] 1.78% | 85,460 | 1.2% |
[ 1.5% - 2.0% ] 1.87% | 97,028 | 10.1% |
[ 1.5% - 2.0% ] 1.92% | 102,852 | 6.4% |
[ 1.5% - 2.0% ] 1.97% | 183,802 | 9.3% |
[ 2.0% - 2.5% ] 2.06% | 135,169 | 5.5% |
[ 2.0% - 2.5% ] 2.17% | 94,027 | 3.9% |
[ 2.0% - 2.5% ] 2.19% | 99,912 | 14.2% |
[ 2.0% - 2.5% ] 2.26% | 113,905 | 5.7% |
[ 2.0% - 2.5% ] 2.34% | 49,711 | 2.1% |
[ 2.0% - 2.5% ] 2.39% | 71,154 | 9.1% |
[ 2.0% - 2.5% ] 2.44% | 78,508 | 7.6% |
[ 2.5% - 3.0% ] 2.50% | 17,926 | 4.6% |
[ 2.5% - 3.0% ] 2.54% | 14,824 | 8.6% |
[ 2.5% - 3.0% ] 2.83% | 139,004 | 2.4% |
[ 2.5% - 3.0% ] 2.90% | 24,438 | 4.2% |
[ 3.0% - 3.5% ] 3.14% | 19,531 | 14.5% |
[ 3.5% - 4.0% ] 3.58% | 29,132 | 1.4% |
[ 3.5% - 4.0% ] 3.75% | 52,855 | 9.7% |
[ 3.5% - 4.0% ] 3.81% | 76,761 | 4.8% |
[ 4.0% - 4.5% ] 4.17% | 24,785 | 1.8% |
[ 4.5% - 5.0% ] 4.82% | 16,050 | 13.6% |
[ 5.5% - 6.0% ] 5.69% | 96,076 | 0.80% |
[ 8.0% - 8.5% ] 8.10% | 37,436 | 1.9% |