Afghan Wage/Income Gap
COMPARE
Afghan
Select to Compare
Wage/Income Gap
Afghan Wage/Income Gap
24.9%
WAGE/INCOME GAP
88.1/ 100
METRIC RATING
142nd/ 347
METRIC RANK
Afghan Wage/Income Gap Correlation Chart
The statistical analysis conducted on geographies consisting of 148,863,238 people shows a poor negative correlation between the proportion of Afghans and wage/income gap percentage in the United States with a correlation coefficient (R) of -0.191 and weighted average of 24.9%. On average, for every 1% (one percent) increase in Afghans within a typical geography, there is a decrease of 1.1% in wage/income gap percentage.
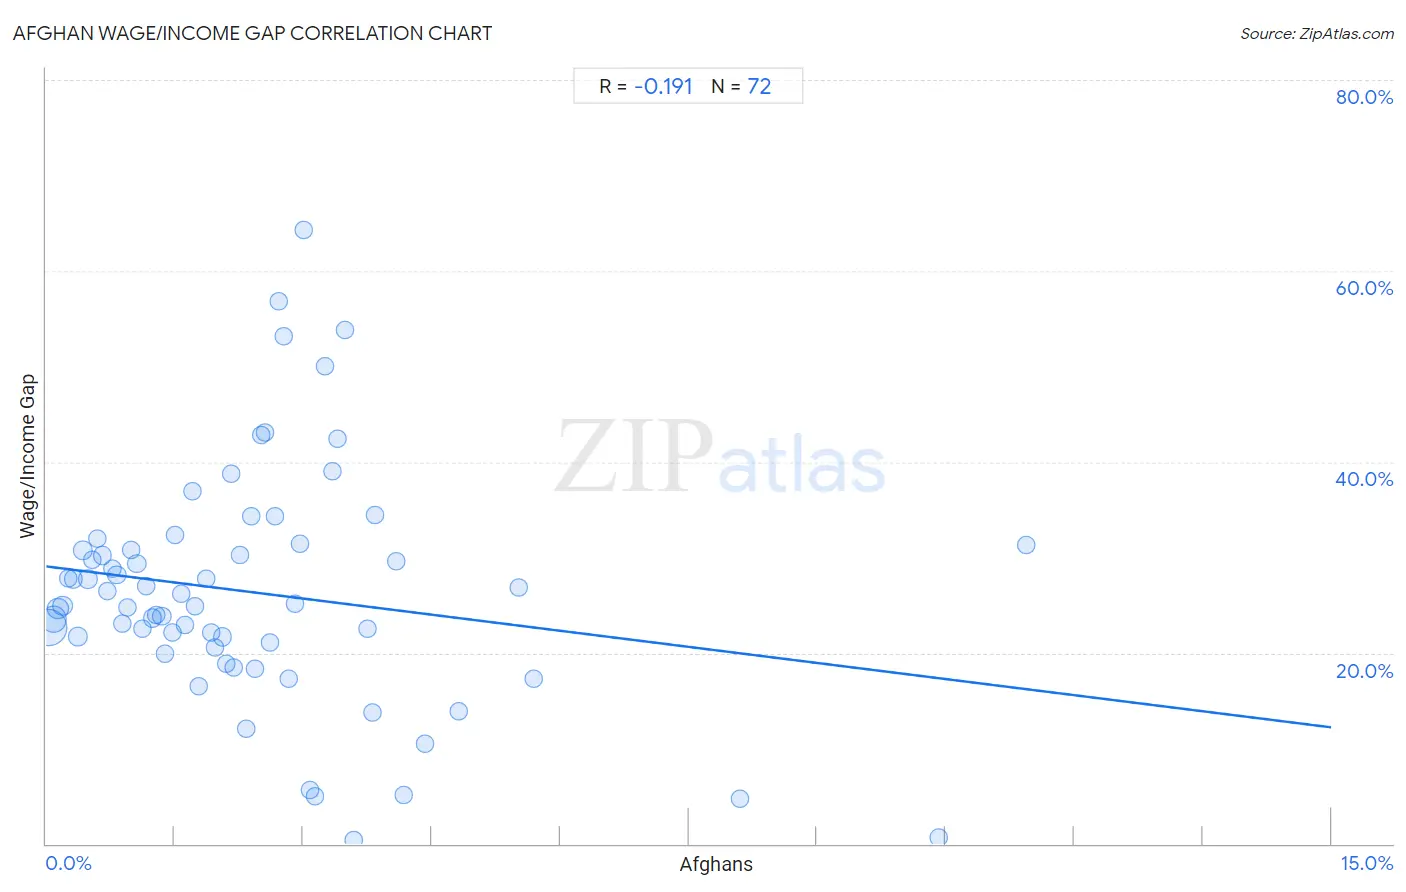
It is essential to understand that the correlation between the percentage of Afghans and wage/income gap percentage does not imply a direct cause-and-effect relationship. It remains uncertain whether the presence of Afghans influences an upward or downward trend in the level of wage/income gap percentage within an area, or if Afghans simply ended up residing in those areas with higher or lower levels of wage/income gap percentage due to other factors.
Demographics Similar to Afghans by Wage/Income Gap
In terms of wage/income gap, the demographic groups most similar to Afghans are Immigrants from Uganda (24.9%, a difference of 0.020%), Chippewa (25.0%, a difference of 0.19%), Hawaiian (24.9%, a difference of 0.20%), Immigrants from Nepal (24.9%, a difference of 0.21%), and Hispanic or Latino (24.9%, a difference of 0.24%).
| Demographics | Rating | Rank | Wage/Income Gap |
| South American Indians | 92.0 /100 | #135 | Exceptional 24.7% |
| Armenians | 91.3 /100 | #136 | Exceptional 24.8% |
| Immigrants from South Eastern Asia | 90.9 /100 | #137 | Exceptional 24.8% |
| Immigrants from Bosnia and Herzegovina | 90.1 /100 | #138 | Exceptional 24.8% |
| Hispanics or Latinos | 89.5 /100 | #139 | Excellent 24.9% |
| Immigrants from Nepal | 89.3 /100 | #140 | Excellent 24.9% |
| Hawaiians | 89.3 /100 | #141 | Excellent 24.9% |
| Afghans | 88.1 /100 | #142 | Excellent 24.9% |
| Immigrants from Uganda | 88.0 /100 | #143 | Excellent 24.9% |
| Chippewa | 86.9 /100 | #144 | Excellent 25.0% |
| Comanche | 85.2 /100 | #145 | Excellent 25.0% |
| South Americans | 85.2 /100 | #146 | Excellent 25.0% |
| Malaysians | 84.9 /100 | #147 | Excellent 25.0% |
| Iroquois | 83.9 /100 | #148 | Excellent 25.1% |
| Immigrants from Peru | 82.6 /100 | #149 | Excellent 25.1% |
Afghan Wage/Income Gap Correlation Summary
| Measurement | Afghan Data | Wage/Income Gap Data |
| Minimum | 0.028% | 0.35% |
| Maximum | 11.4% | 64.3% |
| Range | 11.4% | 63.9% |
| Mean | 2.4% | 26.3% |
| Median | 2.1% | 25.0% |
| Interquartile 25% (IQ1) | 1.0% | 20.8% |
| Interquartile 75% (IQ3) | 3.1% | 31.1% |
| Interquartile Range (IQR) | 2.1% | 10.3% |
| Standard Deviation (Sample) | 2.1% | 12.3% |
| Standard Deviation (Population) | 2.1% | 12.2% |
Correlation Details
| Afghan Percentile | Sample Size | Wage/Income Gap |
[ 0.0% - 0.5% ] 0.028% | 72,305,256 | 22.6% |
[ 0.0% - 0.5% ] 0.085% | 30,311,722 | 23.5% |
[ 0.0% - 0.5% ] 0.14% | 11,220,803 | 24.7% |
[ 0.0% - 0.5% ] 0.20% | 8,366,633 | 24.9% |
[ 0.0% - 0.5% ] 0.26% | 3,527,695 | 27.8% |
[ 0.0% - 0.5% ] 0.31% | 3,165,092 | 27.7% |
[ 0.0% - 0.5% ] 0.37% | 2,172,438 | 21.7% |
[ 0.0% - 0.5% ] 0.43% | 2,102,011 | 30.7% |
[ 0.0% - 0.5% ] 0.49% | 1,760,589 | 27.7% |
[ 0.5% - 1.0% ] 0.54% | 1,472,395 | 29.7% |
[ 0.5% - 1.0% ] 0.60% | 1,019,803 | 32.0% |
[ 0.5% - 1.0% ] 0.66% | 896,747 | 30.2% |
[ 0.5% - 1.0% ] 0.71% | 1,044,547 | 26.5% |
[ 0.5% - 1.0% ] 0.77% | 688,188 | 28.8% |
[ 0.5% - 1.0% ] 0.82% | 697,136 | 28.2% |
[ 0.5% - 1.0% ] 0.88% | 1,059,792 | 23.1% |
[ 0.5% - 1.0% ] 0.95% | 515,730 | 24.8% |
[ 0.5% - 1.0% ] 0.99% | 549,759 | 30.8% |
[ 1.0% - 1.5% ] 1.06% | 537,983 | 29.3% |
[ 1.0% - 1.5% ] 1.13% | 512,179 | 22.5% |
[ 1.0% - 1.5% ] 1.16% | 780,012 | 27.0% |
[ 1.0% - 1.5% ] 1.24% | 220,100 | 23.6% |
[ 1.0% - 1.5% ] 1.28% | 299,243 | 24.0% |
[ 1.0% - 1.5% ] 1.35% | 309,682 | 23.9% |
[ 1.0% - 1.5% ] 1.39% | 237,569 | 19.9% |
[ 1.0% - 1.5% ] 1.47% | 234,792 | 22.2% |
[ 1.5% - 2.0% ] 1.51% | 130,519 | 32.3% |
[ 1.5% - 2.0% ] 1.58% | 63,675 | 26.1% |
[ 1.5% - 2.0% ] 1.63% | 193,212 | 22.9% |
[ 1.5% - 2.0% ] 1.71% | 219,848 | 36.9% |
[ 1.5% - 2.0% ] 1.73% | 118,452 | 24.9% |
[ 1.5% - 2.0% ] 1.78% | 105,622 | 16.5% |
[ 1.5% - 2.0% ] 1.87% | 100,865 | 27.7% |
[ 1.5% - 2.0% ] 1.92% | 128,760 | 22.2% |
[ 1.5% - 2.0% ] 1.97% | 199,909 | 20.5% |
[ 2.0% - 2.5% ] 2.05% | 163,413 | 21.7% |
[ 2.0% - 2.5% ] 2.10% | 40,892 | 18.9% |
[ 2.0% - 2.5% ] 2.17% | 96,006 | 38.7% |
[ 2.0% - 2.5% ] 2.19% | 101,086 | 18.5% |
[ 2.0% - 2.5% ] 2.26% | 192,523 | 30.2% |
[ 2.0% - 2.5% ] 2.34% | 49,711 | 12.1% |
[ 2.0% - 2.5% ] 2.39% | 76,570 | 34.3% |
[ 2.0% - 2.5% ] 2.44% | 79,820 | 18.3% |
[ 2.5% - 3.0% ] 2.50% | 17,926 | 42.8% |
[ 2.5% - 3.0% ] 2.55% | 28,088 | 43.0% |
[ 2.5% - 3.0% ] 2.61% | 35,162 | 21.1% |
[ 2.5% - 3.0% ] 2.68% | 1,607 | 34.2% |
[ 2.5% - 3.0% ] 2.72% | 1,176 | 56.8% |
[ 2.5% - 3.0% ] 2.78% | 1,152 | 53.2% |
[ 2.5% - 3.0% ] 2.83% | 153,323 | 17.3% |
[ 2.5% - 3.0% ] 2.90% | 24,438 | 25.1% |
[ 2.5% - 3.0% ] 2.96% | 10,976 | 31.4% |
[ 2.5% - 3.0% ] 3.00% | 767 | 64.3% |
[ 3.0% - 3.5% ] 3.08% | 23,756 | 5.7% |
[ 3.0% - 3.5% ] 3.14% | 19,531 | 4.9% |
[ 3.0% - 3.5% ] 3.26% | 3,404 | 50.0% |
[ 3.0% - 3.5% ] 3.34% | 35,001 | 39.0% |
[ 3.0% - 3.5% ] 3.40% | 6,884 | 42.5% |
[ 3.0% - 3.5% ] 3.48% | 10,400 | 53.8% |
[ 3.5% - 4.0% ] 3.58% | 29,132 | 0.35% |
[ 3.5% - 4.0% ] 3.75% | 60,625 | 22.5% |
[ 3.5% - 4.0% ] 3.81% | 76,761 | 13.7% |
[ 3.5% - 4.0% ] 3.83% | 3,262 | 34.4% |
[ 4.0% - 4.5% ] 4.08% | 1,936 | 29.6% |
[ 4.0% - 4.5% ] 4.17% | 24,785 | 5.1% |
[ 4.0% - 4.5% ] 4.42% | 34,082 | 10.4% |
[ 4.5% - 5.0% ] 4.82% | 16,050 | 13.8% |
[ 5.5% - 6.0% ] 5.51% | 37,310 | 26.8% |
[ 5.5% - 6.0% ] 5.69% | 96,076 | 17.3% |
[ 8.0% - 8.5% ] 8.10% | 37,436 | 4.7% |
[ 10.0% - 10.5% ] 10.42% | 1,200 | 0.66% |
[ 11.0% - 11.5% ] 11.43% | 2,213 | 31.3% |