Afghan vs Immigrants from Ecuador Married-Couple Family Poverty
COMPARE
Afghan
Immigrants from Ecuador
Married-Couple Family Poverty
Married-Couple Family Poverty Comparison
Afghans
Immigrants from Ecuador
5.5%
MARRIED-COUPLE FAMILY POVERTY
11.2/ 100
METRIC RATING
218th/ 347
METRIC RANK
6.7%
MARRIED-COUPLE FAMILY POVERTY
0.0/ 100
METRIC RATING
302nd/ 347
METRIC RANK
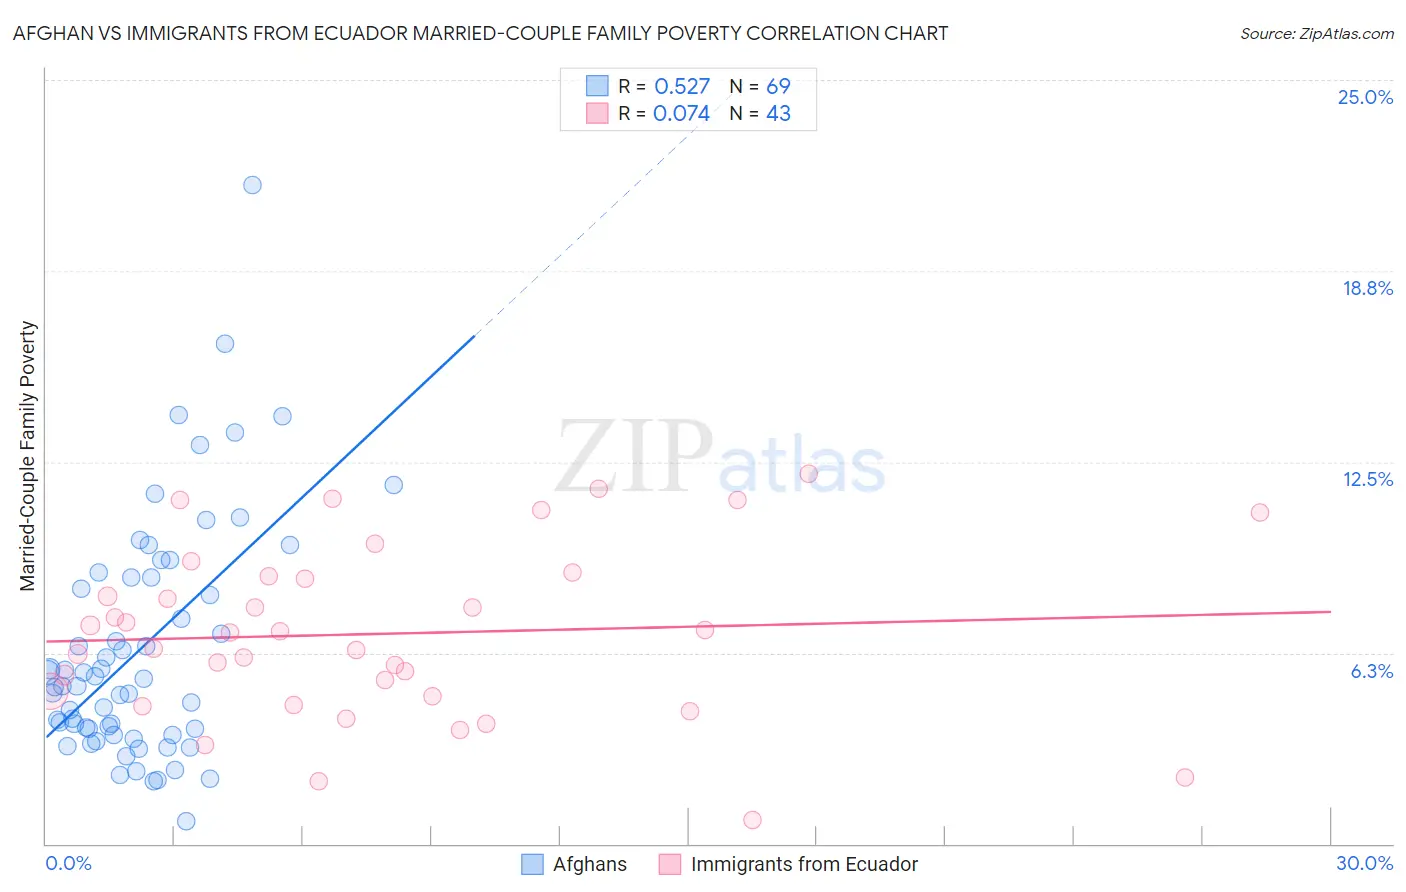
Afghan vs Immigrants from Ecuador Married-Couple Family Poverty Correlation Chart
The statistical analysis conducted on geographies consisting of 148,344,373 people shows a substantial positive correlation between the proportion of Afghans and poverty level among married-couple families in the United States with a correlation coefficient (R) of 0.527 and weighted average of 5.5%. Similarly, the statistical analysis conducted on geographies consisting of 269,492,942 people shows a slight positive correlation between the proportion of Immigrants from Ecuador and poverty level among married-couple families in the United States with a correlation coefficient (R) of 0.074 and weighted average of 6.7%, a difference of 22.0%.
Married-Couple Family Poverty Correlation Summary
| Measurement | Afghan | Immigrants from Ecuador |
| Minimum | 0.76% | 0.76% |
| Maximum | 21.6% | 12.1% |
| Range | 20.8% | 11.3% |
| Mean | 6.4% | 6.9% |
| Median | 5.2% | 6.9% |
| Interquartile 25% (IQ1) | 3.7% | 4.8% |
| Interquartile 75% (IQ3) | 8.7% | 8.8% |
| Interquartile Range (IQR) | 5.1% | 3.9% |
| Standard Deviation (Sample) | 3.9% | 2.8% |
| Standard Deviation (Population) | 3.9% | 2.8% |
Similar Demographics by Married-Couple Family Poverty
Demographics Similar to Afghans by Married-Couple Family Poverty
In terms of married-couple family poverty, the demographic groups most similar to Afghans are Immigrants from Nigeria (5.5%, a difference of 0.020%), Potawatomi (5.5%, a difference of 0.31%), Japanese (5.6%, a difference of 0.40%), Armenian (5.5%, a difference of 0.43%), and Iroquois (5.5%, a difference of 0.49%).
| Demographics | Rating | Rank | Married-Couple Family Poverty |
| Nigerians | 14.3 /100 | #211 | Poor 5.5% |
| Immigrants | Thailand | 14.0 /100 | #212 | Poor 5.5% |
| Immigrants | Liberia | 13.3 /100 | #213 | Poor 5.5% |
| Iroquois | 13.1 /100 | #214 | Poor 5.5% |
| Armenians | 12.8 /100 | #215 | Poor 5.5% |
| Potawatomi | 12.4 /100 | #216 | Poor 5.5% |
| Immigrants | Nigeria | 11.3 /100 | #217 | Poor 5.5% |
| Afghans | 11.2 /100 | #218 | Poor 5.5% |
| Japanese | 9.8 /100 | #219 | Tragic 5.6% |
| Colombians | 9.2 /100 | #220 | Tragic 5.6% |
| Panamanians | 9.2 /100 | #221 | Tragic 5.6% |
| Cajuns | 6.9 /100 | #222 | Tragic 5.6% |
| Immigrants | Fiji | 6.7 /100 | #223 | Tragic 5.6% |
| Sudanese | 6.4 /100 | #224 | Tragic 5.6% |
| Immigrants | Cambodia | 6.1 /100 | #225 | Tragic 5.6% |
Demographics Similar to Immigrants from Ecuador by Married-Couple Family Poverty
In terms of married-couple family poverty, the demographic groups most similar to Immigrants from Ecuador are Central American (6.7%, a difference of 0.14%), Immigrants from El Salvador (6.8%, a difference of 0.28%), Cuban (6.8%, a difference of 0.72%), Immigrants from Belize (6.7%, a difference of 0.74%), and Haitian (6.8%, a difference of 0.83%).
| Demographics | Rating | Rank | Married-Couple Family Poverty |
| Immigrants | Uzbekistan | 0.0 /100 | #295 | Tragic 6.6% |
| U.S. Virgin Islanders | 0.0 /100 | #296 | Tragic 6.6% |
| Kiowa | 0.0 /100 | #297 | Tragic 6.6% |
| Immigrants | Guyana | 0.0 /100 | #298 | Tragic 6.7% |
| Nicaraguans | 0.0 /100 | #299 | Tragic 6.7% |
| Immigrants | Belize | 0.0 /100 | #300 | Tragic 6.7% |
| Central Americans | 0.0 /100 | #301 | Tragic 6.7% |
| Immigrants | Ecuador | 0.0 /100 | #302 | Tragic 6.7% |
| Immigrants | El Salvador | 0.0 /100 | #303 | Tragic 6.8% |
| Cubans | 0.0 /100 | #304 | Tragic 6.8% |
| Haitians | 0.0 /100 | #305 | Tragic 6.8% |
| Immigrants | Haiti | 0.0 /100 | #306 | Tragic 7.0% |
| Guatemalans | 0.0 /100 | #307 | Tragic 7.0% |
| Spanish American Indians | 0.0 /100 | #308 | Tragic 7.1% |
| Hopi | 0.0 /100 | #309 | Tragic 7.1% |