Afghan College, Under 1 year
COMPARE
Afghan
Select to Compare
College, Under 1 year
Afghan College, Under 1 year
67.8%
COLLEGE, UNDER 1 YEAR
96.6/ 100
METRIC RATING
105th/ 347
METRIC RANK
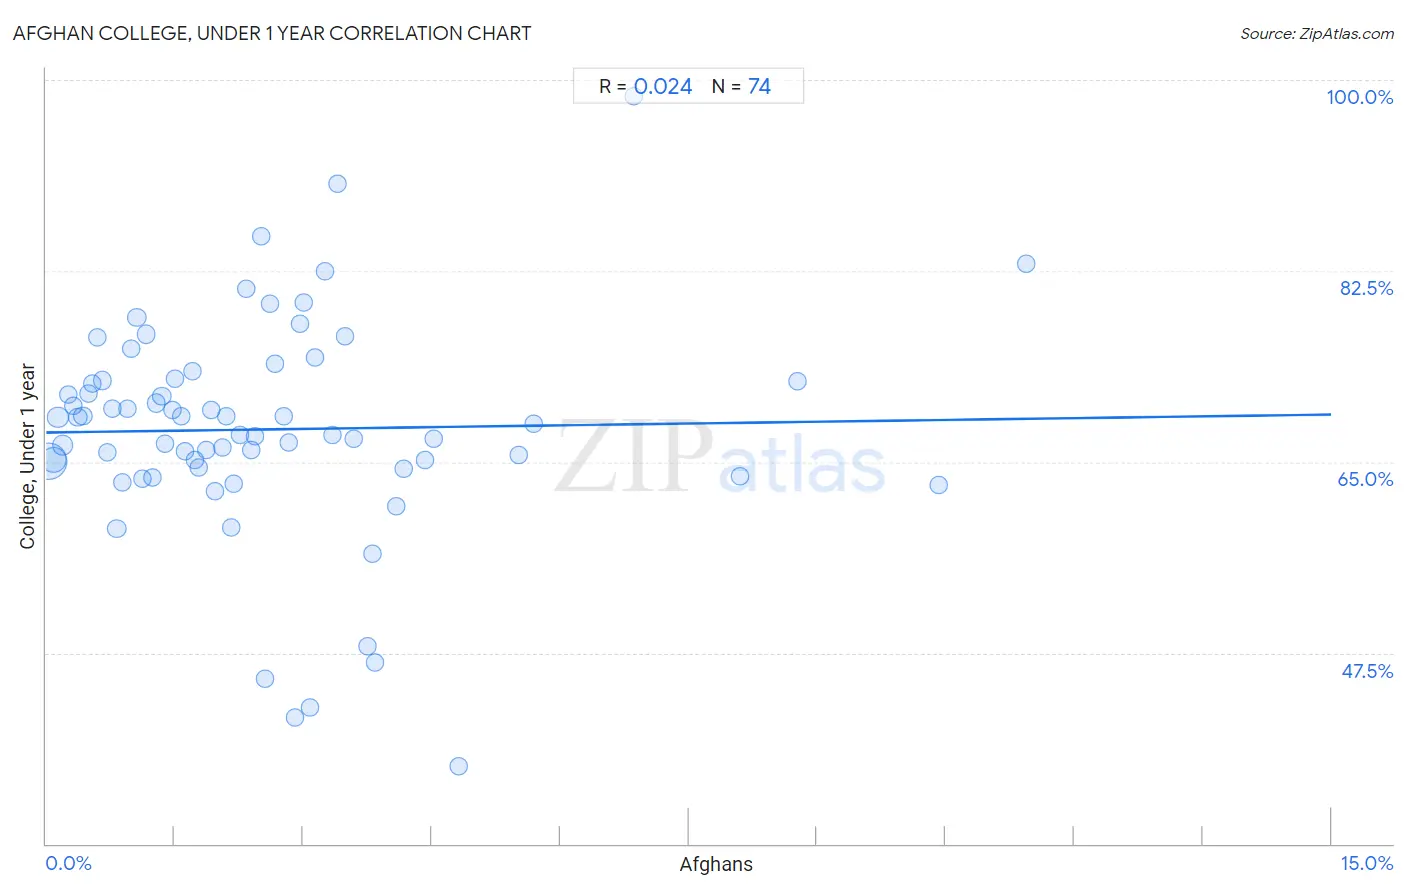
Afghan College, Under 1 year Correlation Chart
The statistical analysis conducted on geographies consisting of 148,874,947 people shows no correlation between the proportion of Afghans and percentage of population with at least college, under 1 year education in the United States with a correlation coefficient (R) of 0.024 and weighted average of 67.8%. On average, for every 1% (one percent) increase in Afghans within a typical geography, there is an increase of 0.11% in percentage of population with at least college, under 1 year education.
It is essential to understand that the correlation between the percentage of Afghans and percentage of population with at least college, under 1 year education does not imply a direct cause-and-effect relationship. It remains uncertain whether the presence of Afghans influences an upward or downward trend in the level of percentage of population with at least college, under 1 year education within an area, or if Afghans simply ended up residing in those areas with higher or lower levels of percentage of population with at least college, under 1 year education due to other factors.
Demographics Similar to Afghans by College, Under 1 year
In terms of college, under 1 year, the demographic groups most similar to Afghans are Immigrants from Western Asia (67.8%, a difference of 0.0%), Immigrants from Croatia (67.8%, a difference of 0.010%), Austrian (67.8%, a difference of 0.070%), Palestinian (67.9%, a difference of 0.080%), and Carpatho Rusyn (67.9%, a difference of 0.080%).
| Demographics | Rating | Rank | College, Under 1 year |
| Paraguayans | 97.1 /100 | #98 | Exceptional 67.9% |
| Immigrants from Bolivia | 97.0 /100 | #99 | Exceptional 67.9% |
| Immigrants from Argentina | 97.0 /100 | #100 | Exceptional 67.9% |
| Immigrants from Eastern Europe | 96.9 /100 | #101 | Exceptional 67.9% |
| Palestinians | 96.9 /100 | #102 | Exceptional 67.9% |
| Carpatho Rusyns | 96.8 /100 | #103 | Exceptional 67.9% |
| Immigrants from Western Asia | 96.6 /100 | #104 | Exceptional 67.8% |
| Afghans | 96.6 /100 | #105 | Exceptional 67.8% |
| Immigrants from Croatia | 96.6 /100 | #106 | Exceptional 67.8% |
| Austrians | 96.4 /100 | #107 | Exceptional 67.8% |
| Immigrants from Egypt | 96.0 /100 | #108 | Exceptional 67.7% |
| Scandinavians | 95.8 /100 | #109 | Exceptional 67.7% |
| Assyrians/Chaldeans/Syriacs | 95.8 /100 | #110 | Exceptional 67.7% |
| Ukrainians | 95.8 /100 | #111 | Exceptional 67.7% |
| Macedonians | 95.7 /100 | #112 | Exceptional 67.6% |
Afghan College, Under 1 year Correlation Summary
| Measurement | Afghan Data | College, Under 1 year Data |
| Minimum | 0.028% | 37.1% |
| Maximum | 11.4% | 98.6% |
| Range | 11.4% | 61.5% |
| Mean | 2.6% | 68.0% |
| Median | 2.1% | 68.0% |
| Interquartile 25% (IQ1) | 1.1% | 64.5% |
| Interquartile 75% (IQ3) | 3.3% | 72.5% |
| Interquartile Range (IQR) | 2.3% | 8.0% |
| Standard Deviation (Sample) | 2.3% | 10.2% |
| Standard Deviation (Population) | 2.2% | 10.2% |
Correlation Details
| Afghan Percentile | Sample Size | College, Under 1 year |
[ 0.0% - 0.5% ] 0.028% | 72,305,256 | 65.0% |
[ 0.0% - 0.5% ] 0.085% | 30,313,046 | 65.2% |
[ 0.0% - 0.5% ] 0.14% | 11,220,803 | 69.1% |
[ 0.0% - 0.5% ] 0.20% | 8,366,633 | 66.5% |
[ 0.0% - 0.5% ] 0.26% | 3,527,695 | 71.2% |
[ 0.0% - 0.5% ] 0.31% | 3,165,092 | 70.1% |
[ 0.0% - 0.5% ] 0.37% | 2,175,801 | 69.1% |
[ 0.0% - 0.5% ] 0.43% | 2,102,011 | 69.2% |
[ 0.0% - 0.5% ] 0.49% | 1,763,757 | 71.3% |
[ 0.5% - 1.0% ] 0.54% | 1,472,395 | 72.2% |
[ 0.5% - 1.0% ] 0.60% | 1,020,314 | 76.4% |
[ 0.5% - 1.0% ] 0.66% | 896,747 | 72.5% |
[ 0.5% - 1.0% ] 0.71% | 1,044,547 | 65.9% |
[ 0.5% - 1.0% ] 0.77% | 688,188 | 69.9% |
[ 0.5% - 1.0% ] 0.82% | 697,136 | 58.9% |
[ 0.5% - 1.0% ] 0.88% | 1,059,792 | 63.2% |
[ 0.5% - 1.0% ] 0.95% | 515,730 | 69.9% |
[ 0.5% - 1.0% ] 0.99% | 549,759 | 75.4% |
[ 1.0% - 1.5% ] 1.06% | 537,983 | 78.2% |
[ 1.0% - 1.5% ] 1.13% | 512,179 | 63.5% |
[ 1.0% - 1.5% ] 1.16% | 780,012 | 76.7% |
[ 1.0% - 1.5% ] 1.24% | 220,100 | 63.6% |
[ 1.0% - 1.5% ] 1.28% | 299,243 | 70.4% |
[ 1.0% - 1.5% ] 1.35% | 309,682 | 71.0% |
[ 1.0% - 1.5% ] 1.39% | 237,569 | 66.6% |
[ 1.0% - 1.5% ] 1.47% | 234,792 | 69.7% |
[ 1.5% - 2.0% ] 1.51% | 130,519 | 72.6% |
[ 1.5% - 2.0% ] 1.58% | 63,675 | 69.1% |
[ 1.5% - 2.0% ] 1.63% | 193,212 | 66.0% |
[ 1.5% - 2.0% ] 1.71% | 220,784 | 73.3% |
[ 1.5% - 2.0% ] 1.73% | 118,452 | 65.2% |
[ 1.5% - 2.0% ] 1.78% | 105,622 | 64.5% |
[ 1.5% - 2.0% ] 1.87% | 100,865 | 66.1% |
[ 1.5% - 2.0% ] 1.92% | 128,760 | 69.8% |
[ 1.5% - 2.0% ] 1.97% | 199,909 | 62.3% |
[ 2.0% - 2.5% ] 2.05% | 163,413 | 66.3% |
[ 2.0% - 2.5% ] 2.10% | 40,892 | 69.2% |
[ 2.0% - 2.5% ] 2.17% | 96,006 | 59.0% |
[ 2.0% - 2.5% ] 2.19% | 101,086 | 62.9% |
[ 2.0% - 2.5% ] 2.26% | 192,523 | 67.5% |
[ 2.0% - 2.5% ] 2.34% | 49,711 | 80.9% |
[ 2.0% - 2.5% ] 2.39% | 76,570 | 66.1% |
[ 2.0% - 2.5% ] 2.44% | 79,820 | 67.3% |
[ 2.5% - 3.0% ] 2.50% | 17,926 | 85.7% |
[ 2.5% - 3.0% ] 2.55% | 28,088 | 45.1% |
[ 2.5% - 3.0% ] 2.61% | 35,162 | 79.5% |
[ 2.5% - 3.0% ] 2.68% | 1,607 | 74.0% |
[ 2.5% - 3.0% ] 2.78% | 1,152 | 69.2% |
[ 2.5% - 3.0% ] 2.83% | 153,323 | 66.7% |
[ 2.5% - 3.0% ] 2.90% | 24,438 | 41.5% |
[ 2.5% - 3.0% ] 2.96% | 10,976 | 77.7% |
[ 2.5% - 3.0% ] 3.00% | 767 | 79.6% |
[ 3.0% - 3.5% ] 3.08% | 23,756 | 42.5% |
[ 3.0% - 3.5% ] 3.14% | 19,531 | 74.6% |
[ 3.0% - 3.5% ] 3.26% | 3,404 | 82.4% |
[ 3.0% - 3.5% ] 3.34% | 35,001 | 67.5% |
[ 3.0% - 3.5% ] 3.40% | 6,884 | 90.5% |
[ 3.0% - 3.5% ] 3.48% | 10,400 | 76.5% |
[ 3.5% - 4.0% ] 3.58% | 29,132 | 67.2% |
[ 3.5% - 4.0% ] 3.75% | 60,625 | 48.1% |
[ 3.5% - 4.0% ] 3.81% | 76,761 | 56.6% |
[ 3.5% - 4.0% ] 3.83% | 3,262 | 46.6% |
[ 4.0% - 4.5% ] 4.08% | 1,936 | 60.9% |
[ 4.0% - 4.5% ] 4.17% | 24,785 | 64.4% |
[ 4.0% - 4.5% ] 4.42% | 34,082 | 65.2% |
[ 4.5% - 5.0% ] 4.53% | 2,694 | 67.1% |
[ 4.5% - 5.0% ] 4.82% | 16,050 | 37.1% |
[ 5.5% - 6.0% ] 5.51% | 37,310 | 65.6% |
[ 5.5% - 6.0% ] 5.69% | 96,076 | 68.5% |
[ 6.5% - 7.0% ] 6.85% | 467 | 98.6% |
[ 8.0% - 8.5% ] 8.10% | 37,436 | 63.7% |
[ 8.5% - 9.0% ] 8.77% | 422 | 72.4% |
[ 10.0% - 10.5% ] 10.42% | 1,200 | 62.9% |
[ 11.0% - 11.5% ] 11.43% | 2,213 | 83.1% |