Afghan Disability Age Under 5

COMPARE

Afghan
Race
Ancestry
AfghanAfricanAlaska NativeAlaskan AthabascanAlbanianAleutAlsatianAmericanApacheArabArapahoArgentineanArmenianAssyrian/Chaldean/SyriacAustralianAustrianBahamianBangladeshiBarbadianBasqueBelgianBelizeanBermudanBhutaneseBlackfeetBolivianBrazilianBritishBritish West IndianBulgarianBurmeseCajunCambodianCanadianCape VerdeanCarpatho RusynCelticCentral AmericanCentral American IndianCherokeeCheyenneChickasawChileanChineseChippewaChoctawColombianColvilleComancheCosta RicanCreeCreekCroatianCrowCubanCypriotCzechCzechoslovakianDanishDelawareDominicanDutchDutch West IndianEastern EuropeanEcuadorianEgyptianEnglishEstonianEthiopianEuropeanFijianFilipinoFinnishFrenchFrench American IndianFrench CanadianGermanGerman RussianGhanaianGreekGuamanian/ChamorroGuatemalanGuyaneseHaitianHmongHonduranHopiHoumaHungarianIcelanderIndian (Asian)IndonesianInupiatIranianIraqiIrishIroquoisIsraeliItalianJamaicanJapaneseJordanianKenyanKiowaKoreanLaotianLatvianLebaneseLiberianLithuanianLumbeeLuxembourgerMacedonianMalaysianMalteseMarshalleseMenomineeMexicanMexican American IndianMongolianMoroccanNative HawaiianNavajoNepaleseNew ZealanderNicaraguanNigerianNorthern EuropeanNorwegianOkinawanOsageOttawaPaiutePakistaniPalestinianPanamanianParaguayanPennsylvania GermanPeruvianPimaPolishPortuguesePotawatomiPuebloPuerto RicanPuget Sound SalishRomanianRussianSalvadoranSamoanScandinavianScotch-IrishScottishSeminoleSenegaleseSerbianShoshoneSierra LeoneanSiouxSlavicSlovakSloveneSomaliSouth AfricanSouth AmericanSouth American IndianSoviet UnionSpaniardSpanishSpanish AmericanSpanish American IndianSri LankanSubsaharan AfricanSudaneseSwedishSwissSyrianTaiwaneseThaiTlingit-HaidaTohono O'OdhamTonganTrinidadian and TobagonianTsimshianTurkishU.S. Virgin IslanderUgandanUkrainianUruguayanUteVenezuelanVietnameseWelshWest IndianYakamaYaquiYugoslavianYumanYup'ikZimbabwean
Immigration
NonimmigrantsImmigrantsAfghanistanAfricaAlbaniaArgentinaArmeniaAsiaAustraliaAustriaBahamasBangladeshBarbadosBelarusBelgiumBelizeBoliviaBosnia and HerzegovinaBrazilBulgariaBurma/MyanmarCabo VerdeCambodiaCameroonCanadaCaribbeanCentral AmericaChileChinaColombiaCongoCosta RicaCroatiaCubaCzechoslovakiaDenmarkDominicaDominican RepublicEastern AfricaEastern AsiaEastern EuropeEcuadorEgyptEl SalvadorEnglandEritreaEthiopiaEuropeFijiFranceGermanyGhanaGreeceGrenadaGuatemalaGuyanaHaitiHondurasHong KongHungaryIndiaIndonesiaIranIraqIrelandIsraelItalyJamaicaJapanJordanKazakhstanKenyaKoreaKuwaitLaosLatin AmericaLatviaLebanonLiberiaLithuaniaMalaysiaMexicoMicronesiaMiddle AfricaMoldovaMoroccoNepalNetherlandsNicaraguaNigeriaNorth AmericaNorth MacedoniaNorthern AfricaNorthern EuropeNorwayOceaniaPakistanPanamaPeruPhilippinesPolandPortugalRomaniaRussiaSaudi ArabiaScotlandSenegalSerbiaSierra LeoneSingaporeSomaliaSouth AfricaSouth AmericaSouth Central AsiaSouth Eastern AsiaSouthern EuropeSpainSri LankaSt. Vincent and the GrenadinesSudanSwedenSwitzerlandSyriaTaiwanThailandTrinidad and TobagoTurkeyUgandaUkraineUruguayUzbekistanVenezuelaVietnamWest IndiesWestern AfricaWestern AsiaWestern EuropeYemenZaireZimbabweAzores
Select to Compare
Race
Ancestry
AfricanAlaska NativeAlaskan AthabascanAlbanianAleutAlsatianAmericanApacheArabArapahoArgentineanArmenianAssyrian/Chaldean/SyriacAustralianAustrianBahamianBangladeshiBarbadianBasqueBelgianBelizeanBermudanBhutaneseBlackfeetBolivianBrazilianBritishBritish West IndianBulgarianBurmeseCajunCambodianCanadianCape VerdeanCarpatho RusynCelticCentral AmericanCentral American IndianCherokeeCheyenneChickasawChileanChineseChippewaChoctawColombianColvilleComancheCosta RicanCreeCreekCroatianCrowCubanCypriotCzechCzechoslovakianDanishDelawareDominicanDutchDutch West IndianEastern EuropeanEcuadorianEgyptianEnglishEstonianEthiopianEuropeanFijianFilipinoFinnishFrenchFrench American IndianFrench CanadianGermanGerman RussianGhanaianGreekGuamanian/ChamorroGuatemalanGuyaneseHaitianHmongHonduranHopiHoumaHungarianIcelanderIndian (Asian)IndonesianInupiatIranianIraqiIrishIroquoisIsraeliItalianJamaicanJapaneseJordanianKenyanKiowaKoreanLaotianLatvianLebaneseLiberianLithuanianLumbeeLuxembourgerMacedonianMalaysianMalteseMarshalleseMenomineeMexicanMexican American IndianMongolianMoroccanNative HawaiianNavajoNepaleseNew ZealanderNicaraguanNigerianNorthern EuropeanNorwegianOkinawanOsageOttawaPaiutePakistaniPalestinianPanamanianParaguayanPennsylvania GermanPeruvianPimaPolishPortuguesePotawatomiPuebloPuerto RicanPuget Sound SalishRomanianRussianSalvadoranSamoanScandinavianScotch-IrishScottishSeminoleSenegaleseSerbianShoshoneSierra LeoneanSiouxSlavicSlovakSloveneSomaliSouth AfricanSouth AmericanSouth American IndianSoviet UnionSpaniardSpanishSpanish AmericanSpanish American IndianSri LankanSubsaharan AfricanSudaneseSwedishSwissSyrianTaiwaneseThaiTlingit-HaidaTohono O'OdhamTonganTrinidadian and TobagonianTsimshianTurkishU.S. Virgin IslanderUgandanUkrainianUruguayanUteVenezuelanVietnameseWelshWest IndianYakamaYaquiYugoslavianYumanYup'ikZimbabwean
Immigration
NonimmigrantsImmigrantsAfghanistanAfricaAlbaniaArgentinaArmeniaAsiaAustraliaAustriaBahamasBangladeshBarbadosBelarusBelgiumBelizeBoliviaBosnia and HerzegovinaBrazilBulgariaBurma/MyanmarCabo VerdeCambodiaCameroonCanadaCaribbeanCentral AmericaChileChinaColombiaCongoCosta RicaCroatiaCubaCzechoslovakiaDenmarkDominicaDominican RepublicEastern AfricaEastern AsiaEastern EuropeEcuadorEgyptEl SalvadorEnglandEritreaEthiopiaEuropeFijiFranceGermanyGhanaGreeceGrenadaGuatemalaGuyanaHaitiHondurasHong KongHungaryIndiaIndonesiaIranIraqIrelandIsraelItalyJamaicaJapanJordanKazakhstanKenyaKoreaKuwaitLaosLatin AmericaLatviaLebanonLiberiaLithuaniaMalaysiaMexicoMicronesiaMiddle AfricaMoldovaMoroccoNepalNetherlandsNicaraguaNigeriaNorth AmericaNorth MacedoniaNorthern AfricaNorthern EuropeNorwayOceaniaPakistanPanamaPeruPhilippinesPolandPortugalRomaniaRussiaSaudi ArabiaScotlandSenegalSerbiaSierra LeoneSingaporeSomaliaSouth AfricaSouth AmericaSouth Central AsiaSouth Eastern AsiaSouthern EuropeSpainSri LankaSt. Vincent and the GrenadinesSudanSwedenSwitzerlandSyriaTaiwanThailandTrinidad and TobagoTurkeyUgandaUkraineUruguayUzbekistanVenezuelaVietnamWest IndiesWestern AfricaWestern AsiaWestern EuropeYemenZaireZimbabweAzores
Disability Age Under 5
Income
Poverty
Unemployment
Labor Participation
Family Structure
Vehicle Availability
Education Level
Disability

Afghan Disability Age Under 5
Exceptional

0.94%
DISABILITY | AGE UNDER 5
100.0/ 100
METRIC RATING
11th/ 347
METRIC RANK

Afghan Disability Age Under 5 Correlation Chart

The statistical analysis conducted on geographies consisting of 107,918,931 people shows a weak negative correlation between the proportion of Afghans and percentage of population with a disability under the age of 5 in the United States with a correlation coefficient (R) of -0.245 and weighted average of 0.94%. On average, for every 1% (one percent) increase in Afghans within a typical geography, there is a decrease of 0.079% in percentage of population with a disability under the age of 5.
Afghan Disability Age Under 5
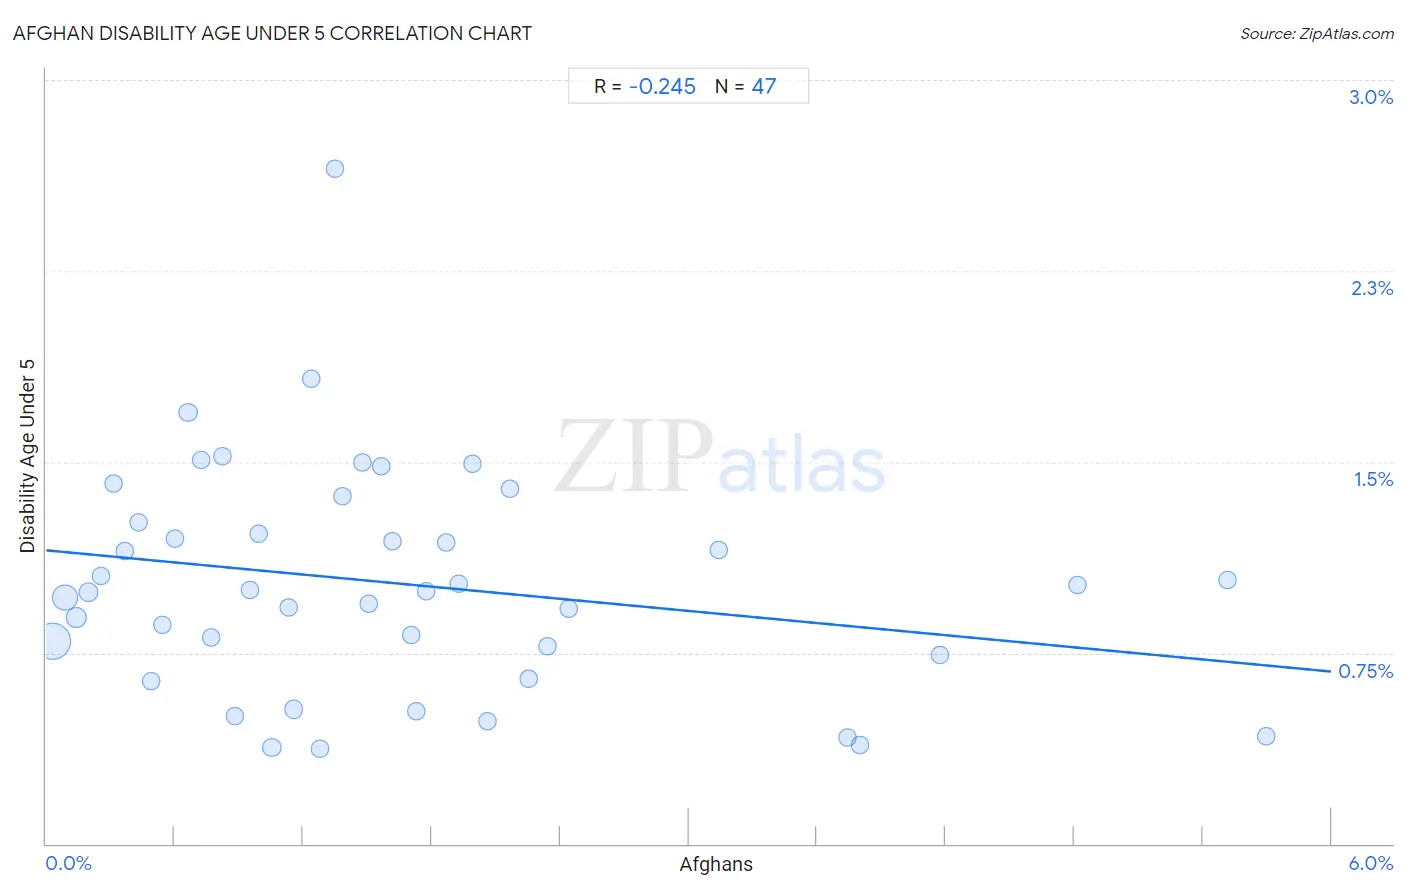
It is essential to understand that the correlation between the percentage of Afghans and percentage of population with a disability under the age of 5 does not imply a direct cause-and-effect relationship. It remains uncertain whether the presence of Afghans influences an upward or downward trend in the level of percentage of population with a disability under the age of 5 within an area, or if Afghans simply ended up residing in those areas with higher or lower levels of percentage of population with a disability under the age of 5 due to other factors.

Demographics Similar to Afghans by Disability Age Under 5

In terms of disability age under 5, the demographic groups most similar to Afghans are Immigrants from Grenada (0.94%, a difference of 0.020%), Soviet Union (0.95%, a difference of 0.19%), Yuman (0.95%, a difference of 0.27%), Immigrants from Hong Kong (0.95%, a difference of 0.30%), and Marshallese (0.94%, a difference of 0.76%).
DemographicsRating | RankDisability Age Under 5
Immigrants from Uzbekistan
100.0
/100
|
#4
Exceptional
0.85%
Immigrants from Bangladesh
100.0
/100
|
#5
Exceptional
0.85%
Ute
100.0
/100
|
#6
Exceptional
0.86%
Immigrants from Afghanistan
100.0
/100
|
#7
Exceptional
0.91%
Immigrants from Yemen
100.0
/100
|
#8
Exceptional
0.91%
Immigrants from Fiji
100.0
/100
|
#9
Exceptional
0.92%
Marshallese
100.0
/100
|
#10
Exceptional
0.94%
Afghans
100.0
/100
|
#11
Exceptional
0.94%
Immigrants from Grenada
100.0
/100
|
#12
Exceptional
0.94%
Soviet Union
100.0
/100
|
#13
Exceptional
0.95%
Yuman
100.0
/100
|
#14
Exceptional
0.95%
Immigrants from Hong Kong
100.0
/100
|
#15
Exceptional
0.95%
Immigrants from Israel
100.0
/100
|
#16
Exceptional
0.96%
Immigrants from China
100.0
/100
|
#17
Exceptional
0.96%
Immigrants from Barbados
100.0
/100
|
#18
Exceptional
0.97%

Afghan Disability Age Under 5 Correlation Summary

MeasurementAfghan DataDisability Age Under 5 Data
Minimum0.028%0.37%
Maximum5.7%2.7%
Range5.7%2.3%
Mean1.6%1.0%
Median1.3%0.99%
Interquartile 25% (IQ1)0.66%0.74%
Interquartile 75% (IQ3)2.1%1.3%
Interquartile Range (IQR)1.4%0.52%
Standard Deviation (Sample)1.4%0.45%
Standard Deviation (Population)1.4%0.44%

Correlation Details

Afghan PercentileSample SizeDisability Age Under 5
[
0.0%
-
0.5%
]
0.028%
58,353,9560.79%
[
0.0%
-
0.5%
]
0.086%
22,792,6280.97%
[
0.0%
-
0.5%
]
0.14%
7,776,9760.89%
[
0.0%
-
0.5%
]
0.20%
5,518,6440.99%
[
0.0%
-
0.5%
]
0.25%
1,959,7141.1%
[
0.0%
-
0.5%
]
0.31%
1,281,7171.4%
[
0.0%
-
0.5%
]
0.37%
1,288,9361.2%
[
0.0%
-
0.5%
]
0.43%
1,012,2981.3%
[
0.0%
-
0.5%
]
0.49%
817,0300.64%
[
0.5%
-
1.0%
]
0.54%
749,2210.86%
[
0.5%
-
1.0%
]
0.60%
598,6391.2%
[
0.5%
-
1.0%
]
0.66%
294,7961.7%
[
0.5%
-
1.0%
]
0.72%
364,5291.5%
[
0.5%
-
1.0%
]
0.77%
300,1730.81%
[
0.5%
-
1.0%
]
0.83%
216,4601.5%
[
0.5%
-
1.0%
]
0.88%
766,5640.50%
[
0.5%
-
1.0%
]
0.95%
285,2801.00%
[
0.5%
-
1.0%
]
0.99%
196,6871.2%
[
1.0%
-
1.5%
]
1.05%
192,9100.38%
[
1.0%
-
1.5%
]
1.13%
374,4100.93%
[
1.0%
-
1.5%
]
1.16%
603,8770.53%
[
1.0%
-
1.5%
]
1.24%
164,8011.8%
[
1.0%
-
1.5%
]
1.28%
204,4130.37%
[
1.0%
-
1.5%
]
1.35%
73,0332.7%
[
1.0%
-
1.5%
]
1.39%
195,0291.4%
[
1.0%
-
1.5%
]
1.47%
167,7451.5%
[
1.5%
-
2.0%
]
1.51%
42,6570.94%
[
1.5%
-
2.0%
]
1.57%
43,5391.5%
[
1.5%
-
2.0%
]
1.62%
59,7751.2%
[
1.5%
-
2.0%
]
1.71%
77,7120.82%
[
1.5%
-
2.0%
]
1.73%
58,8720.52%
[
1.5%
-
2.0%
]
1.78%
85,4600.99%
[
1.5%
-
2.0%
]
1.87%
86,4451.2%
[
1.5%
-
2.0%
]
1.92%
128,7601.0%
[
1.5%
-
2.0%
]
1.99%
88,1041.5%
[
2.0%
-
2.5%
]
2.06%
135,1690.48%
[
2.0%
-
2.5%
]
2.17%
94,0271.4%
[
2.0%
-
2.5%
]
2.26%
88,3570.65%
[
2.0%
-
2.5%
]
2.34%
49,7110.78%
[
2.0%
-
2.5%
]
2.44%
63,7150.92%
[
3.0%
-
3.5%
]
3.14%
19,5311.2%
[
3.5%
-
4.0%
]
3.74%
34,7750.42%
[
3.5%
-
4.0%
]
3.80%
37,6350.39%
[
4.0%
-
4.5%
]
4.17%
24,7850.74%
[
4.5%
-
5.0%
]
4.82%
16,0501.0%
[
5.5%
-
6.0%
]
5.51%
37,3101.0%
[
5.5%
-
6.0%
]
5.69%
96,0760.42%