Afghan Disability Age 5 to 17
COMPARE
Afghan
Select to Compare
Disability Age 5 to 17
Afghan Disability Age 5 to 17
5.2%
DISABILITY | AGE 5 TO 17
99.6/ 100
METRIC RATING
79th/ 347
METRIC RANK
Afghan Disability Age 5 to 17 Correlation Chart
The statistical analysis conducted on geographies consisting of 148,469,527 people shows a poor positive correlation between the proportion of Afghans and percentage of population with a disability between the ages 5 and 17 in the United States with a correlation coefficient (R) of 0.103 and weighted average of 5.2%. On average, for every 1% (one percent) increase in Afghans within a typical geography, there is an increase of 0.12% in percentage of population with a disability between the ages 5 and 17.
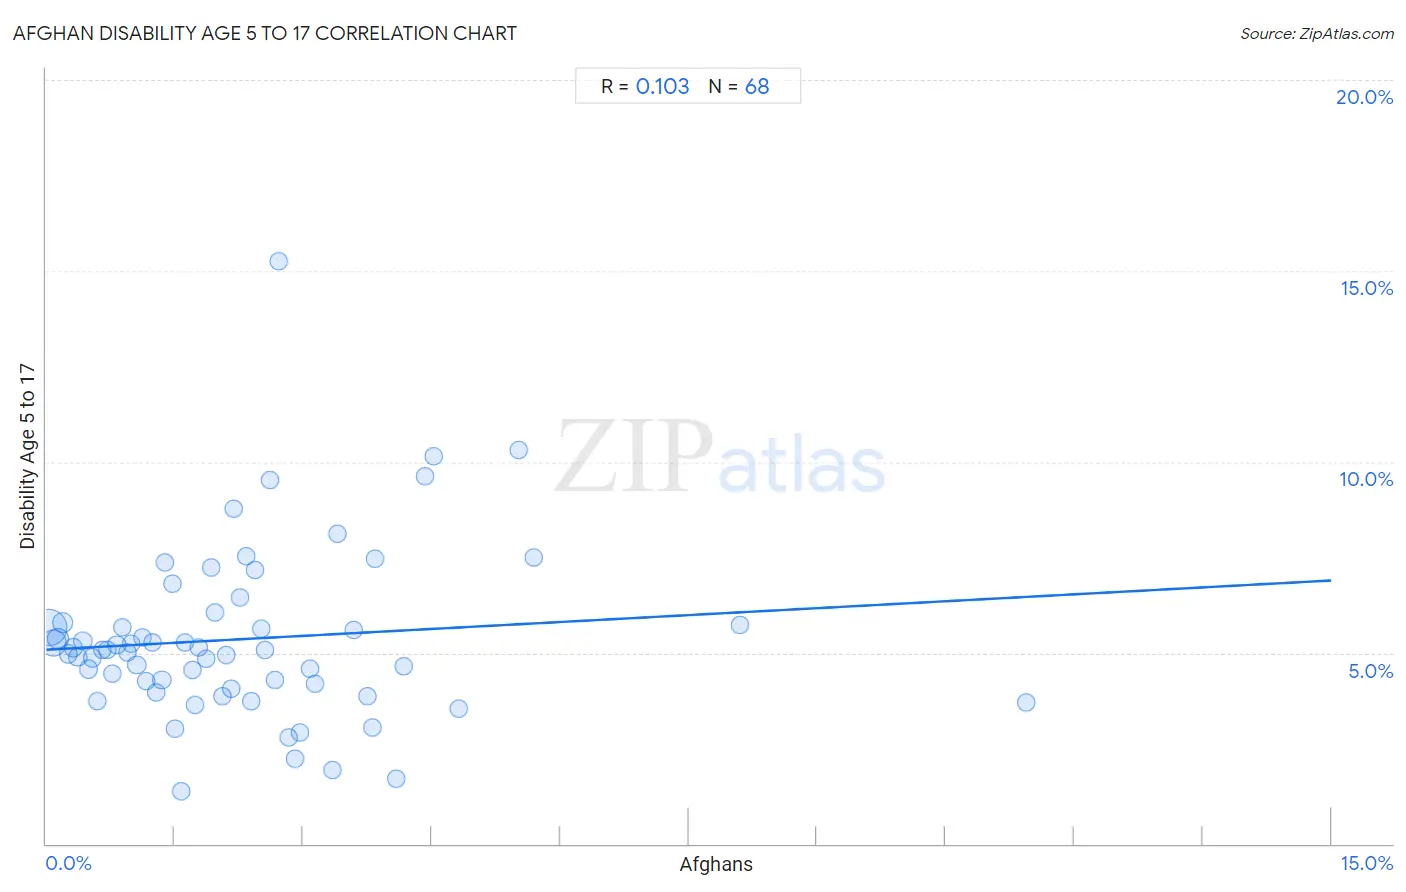
It is essential to understand that the correlation between the percentage of Afghans and percentage of population with a disability between the ages 5 and 17 does not imply a direct cause-and-effect relationship. It remains uncertain whether the presence of Afghans influences an upward or downward trend in the level of percentage of population with a disability between the ages 5 and 17 within an area, or if Afghans simply ended up residing in those areas with higher or lower levels of percentage of population with a disability between the ages 5 and 17 due to other factors.
Demographics Similar to Afghans by Disability Age 5 to 17
In terms of disability age 5 to 17, the demographic groups most similar to Afghans are Sri Lankan (5.2%, a difference of 0.020%), Immigrants from Cuba (5.2%, a difference of 0.040%), Immigrants from Kazakhstan (5.2%, a difference of 0.050%), Immigrants from Guyana (5.2%, a difference of 0.070%), and Native Hawaiian (5.2%, a difference of 0.070%).
| Demographics | Rating | Rank | Disability Age 5 to 17 |
| Immigrants from Vietnam | 99.7 /100 | #72 | Exceptional 5.2% |
| Immigrants from Czechoslovakia | 99.7 /100 | #73 | Exceptional 5.2% |
| Immigrants from Romania | 99.7 /100 | #74 | Exceptional 5.2% |
| Immigrants from Moldova | 99.6 /100 | #75 | Exceptional 5.2% |
| Immigrants from Guyana | 99.6 /100 | #76 | Exceptional 5.2% |
| Immigrants from Kazakhstan | 99.6 /100 | #77 | Exceptional 5.2% |
| Immigrants from Cuba | 99.6 /100 | #78 | Exceptional 5.2% |
| Afghans | 99.6 /100 | #79 | Exceptional 5.2% |
| Sri Lankans | 99.6 /100 | #80 | Exceptional 5.2% |
| Native Hawaiians | 99.6 /100 | #81 | Exceptional 5.2% |
| Immigrants from Sweden | 99.5 /100 | #82 | Exceptional 5.2% |
| Immigrants from France | 99.5 /100 | #83 | Exceptional 5.2% |
| Immigrants from Nicaragua | 99.5 /100 | #84 | Exceptional 5.2% |
| Bulgarians | 99.4 /100 | #85 | Exceptional 5.2% |
| Immigrants from St. Vincent and the Grenadines | 99.4 /100 | #86 | Exceptional 5.2% |
Afghan Disability Age 5 to 17 Correlation Summary
| Measurement | Afghan Data | Disability Age 5 to 17 Data |
| Minimum | 0.028% | 1.4% |
| Maximum | 11.4% | 15.2% |
| Range | 11.4% | 13.9% |
| Mean | 2.3% | 5.4% |
| Median | 1.9% | 5.1% |
| Interquartile 25% (IQ1) | 0.97% | 4.1% |
| Interquartile 75% (IQ3) | 3.0% | 5.8% |
| Interquartile Range (IQR) | 2.1% | 1.6% |
| Standard Deviation (Sample) | 1.9% | 2.2% |
| Standard Deviation (Population) | 1.9% | 2.2% |
Correlation Details
| Afghan Percentile | Sample Size | Disability Age 5 to 17 |
[ 0.0% - 0.5% ] 0.028% | 72,211,305 | 5.7% |
[ 0.0% - 0.5% ] 0.085% | 30,236,952 | 5.3% |
[ 0.0% - 0.5% ] 0.14% | 11,181,870 | 5.4% |
[ 0.0% - 0.5% ] 0.20% | 8,345,551 | 5.8% |
[ 0.0% - 0.5% ] 0.26% | 3,509,103 | 5.0% |
[ 0.0% - 0.5% ] 0.31% | 3,152,233 | 5.1% |
[ 0.0% - 0.5% ] 0.37% | 2,171,299 | 4.9% |
[ 0.0% - 0.5% ] 0.43% | 2,079,684 | 5.3% |
[ 0.0% - 0.5% ] 0.49% | 1,751,630 | 4.6% |
[ 0.5% - 1.0% ] 0.54% | 1,469,597 | 4.9% |
[ 0.5% - 1.0% ] 0.60% | 1,010,885 | 3.7% |
[ 0.5% - 1.0% ] 0.66% | 896,747 | 5.1% |
[ 0.5% - 1.0% ] 0.71% | 1,044,547 | 5.1% |
[ 0.5% - 1.0% ] 0.77% | 665,048 | 4.5% |
[ 0.5% - 1.0% ] 0.82% | 690,691 | 5.2% |
[ 0.5% - 1.0% ] 0.88% | 1,059,792 | 5.7% |
[ 0.5% - 1.0% ] 0.95% | 515,730 | 5.0% |
[ 0.5% - 1.0% ] 0.99% | 549,459 | 5.2% |
[ 1.0% - 1.5% ] 1.06% | 537,983 | 4.7% |
[ 1.0% - 1.5% ] 1.13% | 512,179 | 5.4% |
[ 1.0% - 1.5% ] 1.16% | 774,738 | 4.3% |
[ 1.0% - 1.5% ] 1.24% | 203,405 | 5.3% |
[ 1.0% - 1.5% ] 1.28% | 295,162 | 4.0% |
[ 1.0% - 1.5% ] 1.35% | 299,975 | 4.3% |
[ 1.0% - 1.5% ] 1.39% | 237,569 | 7.4% |
[ 1.0% - 1.5% ] 1.47% | 234,792 | 6.8% |
[ 1.5% - 2.0% ] 1.51% | 130,519 | 3.0% |
[ 1.5% - 2.0% ] 1.58% | 63,675 | 1.4% |
[ 1.5% - 2.0% ] 1.63% | 193,212 | 5.3% |
[ 1.5% - 2.0% ] 1.71% | 219,848 | 4.5% |
[ 1.5% - 2.0% ] 1.73% | 111,426 | 3.6% |
[ 1.5% - 2.0% ] 1.78% | 105,622 | 5.1% |
[ 1.5% - 2.0% ] 1.87% | 100,865 | 4.8% |
[ 1.5% - 2.0% ] 1.92% | 128,760 | 7.2% |
[ 1.5% - 2.0% ] 1.97% | 199,909 | 6.1% |
[ 2.0% - 2.5% ] 2.05% | 163,413 | 3.8% |
[ 2.0% - 2.5% ] 2.10% | 40,892 | 4.9% |
[ 2.0% - 2.5% ] 2.17% | 96,006 | 4.1% |
[ 2.0% - 2.5% ] 2.19% | 99,912 | 8.8% |
[ 2.0% - 2.5% ] 2.26% | 192,523 | 6.5% |
[ 2.0% - 2.5% ] 2.34% | 49,711 | 7.5% |
[ 2.0% - 2.5% ] 2.39% | 76,570 | 3.7% |
[ 2.0% - 2.5% ] 2.44% | 78,508 | 7.2% |
[ 2.5% - 3.0% ] 2.50% | 17,926 | 5.6% |
[ 2.5% - 3.0% ] 2.55% | 28,088 | 5.1% |
[ 2.5% - 3.0% ] 2.61% | 35,162 | 9.5% |
[ 2.5% - 3.0% ] 2.68% | 1,607 | 4.3% |
[ 2.5% - 3.0% ] 2.72% | 1,176 | 15.2% |
[ 2.5% - 3.0% ] 2.83% | 153,323 | 2.8% |
[ 2.5% - 3.0% ] 2.90% | 24,438 | 2.2% |
[ 2.5% - 3.0% ] 2.96% | 10,976 | 2.9% |
[ 3.0% - 3.5% ] 3.08% | 23,756 | 4.6% |
[ 3.0% - 3.5% ] 3.14% | 19,531 | 4.2% |
[ 3.0% - 3.5% ] 3.34% | 35,001 | 1.9% |
[ 3.0% - 3.5% ] 3.40% | 6,884 | 8.1% |
[ 3.5% - 4.0% ] 3.58% | 29,132 | 5.6% |
[ 3.5% - 4.0% ] 3.75% | 60,625 | 3.8% |
[ 3.5% - 4.0% ] 3.81% | 76,761 | 3.1% |
[ 3.5% - 4.0% ] 3.83% | 3,262 | 7.5% |
[ 4.0% - 4.5% ] 4.08% | 1,936 | 1.7% |
[ 4.0% - 4.5% ] 4.17% | 24,785 | 4.7% |
[ 4.0% - 4.5% ] 4.42% | 34,082 | 9.6% |
[ 4.5% - 5.0% ] 4.53% | 2,694 | 10.2% |
[ 4.5% - 5.0% ] 4.82% | 16,050 | 3.5% |
[ 5.5% - 6.0% ] 5.51% | 37,310 | 10.3% |
[ 5.5% - 6.0% ] 5.69% | 96,076 | 7.5% |
[ 8.0% - 8.5% ] 8.10% | 37,436 | 5.7% |
[ 11.0% - 11.5% ] 11.43% | 2,213 | 3.7% |