Afghan Self-Care Disability
COMPARE
Afghan
Select to Compare
Self-Care Disability
Afghan Self-Care Disability
2.4%
SELF-CARE DISABILITY
82.3/ 100
METRIC RATING
143rd/ 347
METRIC RANK
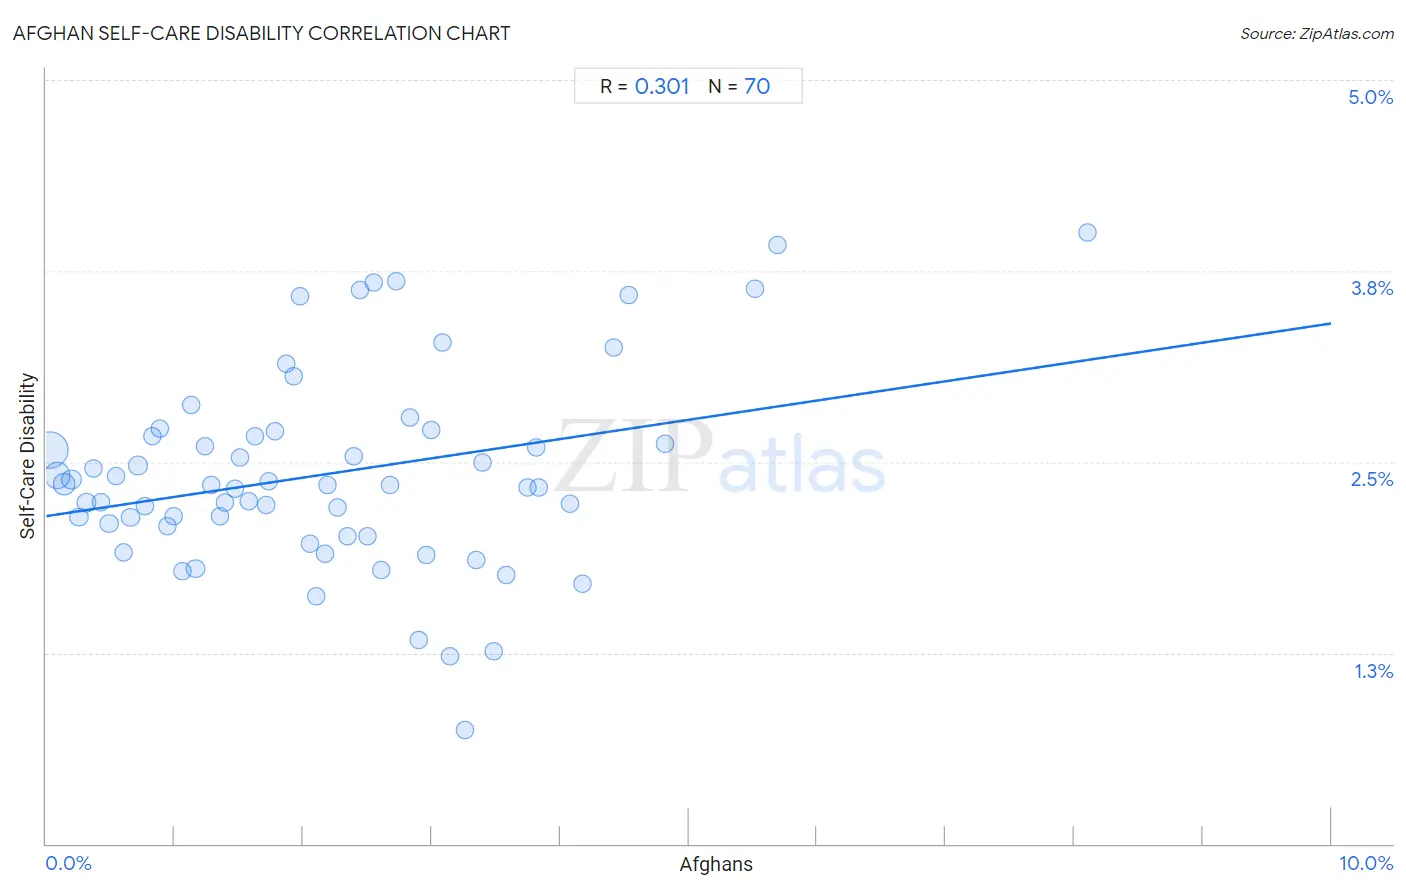
Afghan Self-Care Disability Correlation Chart
The statistical analysis conducted on geographies consisting of 148,790,776 people shows a mild positive correlation between the proportion of Afghans and percentage of population with self-care disability in the United States with a correlation coefficient (R) of 0.301 and weighted average of 2.4%. On average, for every 1% (one percent) increase in Afghans within a typical geography, there is an increase of 0.13% in percentage of population with self-care disability.
It is essential to understand that the correlation between the percentage of Afghans and percentage of population with self-care disability does not imply a direct cause-and-effect relationship. It remains uncertain whether the presence of Afghans influences an upward or downward trend in the level of percentage of population with self-care disability within an area, or if Afghans simply ended up residing in those areas with higher or lower levels of percentage of population with self-care disability due to other factors.
Demographics Similar to Afghans by Self-Care Disability
In terms of self-care disability, the demographic groups most similar to Afghans are Immigrants from Peru (2.4%, a difference of 0.080%), Costa Rican (2.4%, a difference of 0.12%), German (2.4%, a difference of 0.17%), Israeli (2.4%, a difference of 0.18%), and Alaska Native (2.4%, a difference of 0.19%).
| Demographics | Rating | Rank | Self-Care Disability |
| South American Indians | 87.2 /100 | #136 | Excellent 2.4% |
| Austrians | 87.0 /100 | #137 | Excellent 2.4% |
| Immigrants from Croatia | 86.6 /100 | #138 | Excellent 2.4% |
| Sri Lankans | 86.6 /100 | #139 | Excellent 2.4% |
| Immigrants from Uruguay | 85.4 /100 | #140 | Excellent 2.4% |
| Alaska Natives | 84.5 /100 | #141 | Excellent 2.4% |
| Immigrants from Peru | 83.2 /100 | #142 | Excellent 2.4% |
| Afghans | 82.3 /100 | #143 | Excellent 2.4% |
| Costa Ricans | 80.8 /100 | #144 | Excellent 2.4% |
| Germans | 80.1 /100 | #145 | Excellent 2.4% |
| Israelis | 80.0 /100 | #146 | Good 2.4% |
| Dutch | 77.5 /100 | #147 | Good 2.4% |
| Romanians | 75.8 /100 | #148 | Good 2.4% |
| Arabs | 75.7 /100 | #149 | Good 2.4% |
| Immigrants from Costa Rica | 75.1 /100 | #150 | Good 2.4% |
Afghan Self-Care Disability Correlation Summary
| Measurement | Afghan Data | Self-Care Disability Data |
| Minimum | 0.028% | 0.74% |
| Maximum | 8.1% | 4.0% |
| Range | 8.1% | 3.3% |
| Mean | 2.2% | 2.4% |
| Median | 2.0% | 2.3% |
| Interquartile 25% (IQ1) | 0.99% | 2.1% |
| Interquartile 75% (IQ3) | 3.1% | 2.7% |
| Interquartile Range (IQR) | 2.1% | 0.59% |
| Standard Deviation (Sample) | 1.5% | 0.65% |
| Standard Deviation (Population) | 1.5% | 0.64% |
Correlation Details
| Afghan Percentile | Sample Size | Self-Care Disability |
[ 0.0% - 0.5% ] 0.028% | 72,296,461 | 2.6% |
[ 0.0% - 0.5% ] 0.085% | 30,298,126 | 2.4% |
[ 0.0% - 0.5% ] 0.14% | 11,219,000 | 2.4% |
[ 0.0% - 0.5% ] 0.20% | 8,348,699 | 2.4% |
[ 0.0% - 0.5% ] 0.26% | 3,526,270 | 2.1% |
[ 0.0% - 0.5% ] 0.31% | 3,165,092 | 2.2% |
[ 0.0% - 0.5% ] 0.37% | 2,170,043 | 2.5% |
[ 0.0% - 0.5% ] 0.43% | 2,096,642 | 2.2% |
[ 0.0% - 0.5% ] 0.49% | 1,763,757 | 2.1% |
[ 0.5% - 1.0% ] 0.54% | 1,469,597 | 2.4% |
[ 0.5% - 1.0% ] 0.60% | 1,019,803 | 1.9% |
[ 0.5% - 1.0% ] 0.66% | 896,747 | 2.1% |
[ 0.5% - 1.0% ] 0.71% | 1,044,547 | 2.5% |
[ 0.5% - 1.0% ] 0.77% | 685,176 | 2.2% |
[ 0.5% - 1.0% ] 0.82% | 697,136 | 2.7% |
[ 0.5% - 1.0% ] 0.88% | 1,059,792 | 2.7% |
[ 0.5% - 1.0% ] 0.95% | 515,730 | 2.1% |
[ 0.5% - 1.0% ] 0.99% | 549,759 | 2.1% |
[ 1.0% - 1.5% ] 1.06% | 537,983 | 1.8% |
[ 1.0% - 1.5% ] 1.13% | 507,583 | 2.9% |
[ 1.0% - 1.5% ] 1.16% | 778,034 | 1.8% |
[ 1.0% - 1.5% ] 1.24% | 220,100 | 2.6% |
[ 1.0% - 1.5% ] 1.28% | 298,164 | 2.4% |
[ 1.0% - 1.5% ] 1.35% | 307,688 | 2.1% |
[ 1.0% - 1.5% ] 1.39% | 237,569 | 2.2% |
[ 1.0% - 1.5% ] 1.47% | 229,357 | 2.3% |
[ 1.5% - 2.0% ] 1.51% | 130,519 | 2.5% |
[ 1.5% - 2.0% ] 1.58% | 63,675 | 2.2% |
[ 1.5% - 2.0% ] 1.63% | 193,212 | 2.7% |
[ 1.5% - 2.0% ] 1.71% | 220,784 | 2.2% |
[ 1.5% - 2.0% ] 1.73% | 118,452 | 2.4% |
[ 1.5% - 2.0% ] 1.78% | 105,622 | 2.7% |
[ 1.5% - 2.0% ] 1.87% | 100,865 | 3.1% |
[ 1.5% - 2.0% ] 1.92% | 128,760 | 3.1% |
[ 1.5% - 2.0% ] 1.97% | 199,909 | 3.6% |
[ 2.0% - 2.5% ] 2.05% | 163,413 | 2.0% |
[ 2.0% - 2.5% ] 2.10% | 40,892 | 1.6% |
[ 2.0% - 2.5% ] 2.17% | 96,006 | 1.9% |
[ 2.0% - 2.5% ] 2.19% | 99,912 | 2.3% |
[ 2.0% - 2.5% ] 2.26% | 192,523 | 2.2% |
[ 2.0% - 2.5% ] 2.34% | 49,711 | 2.0% |
[ 2.0% - 2.5% ] 2.39% | 76,570 | 2.5% |
[ 2.0% - 2.5% ] 2.44% | 78,508 | 3.6% |
[ 2.5% - 3.0% ] 2.50% | 17,926 | 2.0% |
[ 2.5% - 3.0% ] 2.55% | 28,088 | 3.7% |
[ 2.5% - 3.0% ] 2.61% | 35,162 | 1.8% |
[ 2.5% - 3.0% ] 2.68% | 1,607 | 2.3% |
[ 2.5% - 3.0% ] 2.72% | 1,176 | 3.7% |
[ 2.5% - 3.0% ] 2.83% | 153,323 | 2.8% |
[ 2.5% - 3.0% ] 2.90% | 24,438 | 1.3% |
[ 2.5% - 3.0% ] 2.96% | 10,976 | 1.9% |
[ 2.5% - 3.0% ] 3.00% | 767 | 2.7% |
[ 3.0% - 3.5% ] 3.08% | 23,756 | 3.3% |
[ 3.0% - 3.5% ] 3.14% | 19,531 | 1.2% |
[ 3.0% - 3.5% ] 3.26% | 3,404 | 0.74% |
[ 3.0% - 3.5% ] 3.34% | 35,001 | 1.9% |
[ 3.0% - 3.5% ] 3.40% | 6,884 | 2.5% |
[ 3.0% - 3.5% ] 3.48% | 10,400 | 1.3% |
[ 3.5% - 4.0% ] 3.58% | 29,132 | 1.8% |
[ 3.5% - 4.0% ] 3.75% | 60,625 | 2.3% |
[ 3.5% - 4.0% ] 3.81% | 76,761 | 2.6% |
[ 3.5% - 4.0% ] 3.83% | 3,262 | 2.3% |
[ 4.0% - 4.5% ] 4.08% | 1,936 | 2.2% |
[ 4.0% - 4.5% ] 4.17% | 24,785 | 1.7% |
[ 4.0% - 4.5% ] 4.42% | 34,082 | 3.3% |
[ 4.5% - 5.0% ] 4.53% | 2,694 | 3.6% |
[ 4.5% - 5.0% ] 4.82% | 16,050 | 2.6% |
[ 5.5% - 6.0% ] 5.51% | 37,310 | 3.6% |
[ 5.5% - 6.0% ] 5.69% | 96,076 | 3.9% |
[ 8.0% - 8.5% ] 8.10% | 37,436 | 4.0% |