El Valle de Arroyo Seco, NM Map & Demographics
El Valle de Arroyo Seco Map
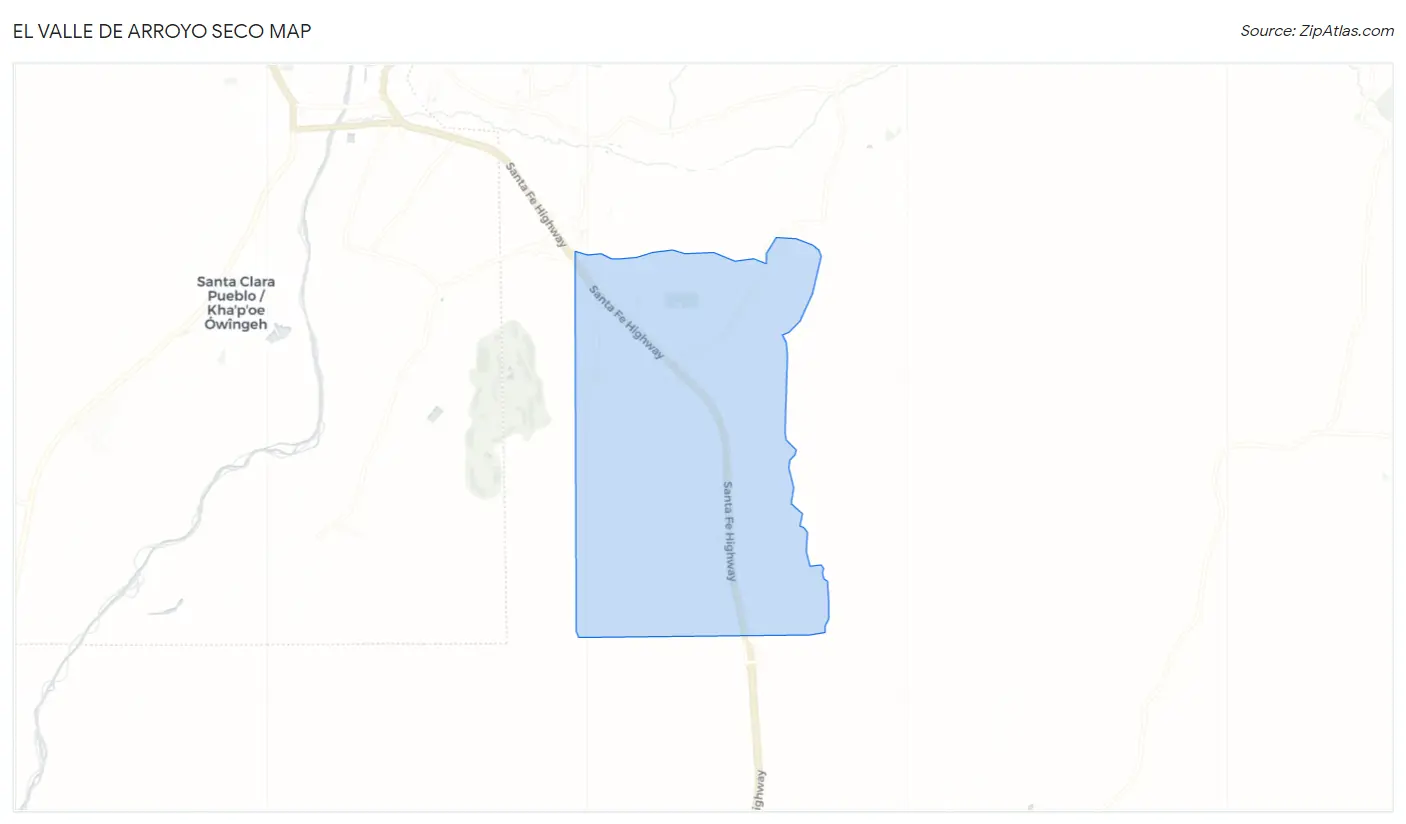
El Valle de Arroyo Seco Overview
$32,065
PER CAPITA INCOME
$56,755
AVG FAMILY INCOME
$65,750
AVG HOUSEHOLD INCOME
0.32
INEQUALITY / GINI INDEX
1,744
TOTAL POPULATION
876
MALE POPULATION
868
FEMALE POPULATION
100.92
MALES / 100 FEMALES
99.09
FEMALES / 100 MALES
40.6
MEDIAN AGE
3.5
AVG FAMILY SIZE
2.3
AVG HOUSEHOLD SIZE
816
LABOR FORCE [ PEOPLE ]
57.2%
PERCENT IN LABOR FORCE
6.0%
UNEMPLOYMENT RATE
Income in El Valle de Arroyo Seco
Income Overview in El Valle de Arroyo Seco
Per Capita Income in El Valle de Arroyo Seco is $32,065, while median incomes of families and households are $56,755 and $65,750 respectively.
| Characteristic | Number | Measure |
| Per Capita Income | 1,744 | $32,065 |
| Median Family Income | 372 | $56,755 |
| Mean Family Income | 372 | $84,447 |
| Median Household Income | 771 | $65,750 |
| Mean Household Income | 771 | $71,519 |
| Income Deficit | 372 | $0 |
| Wage / Income Gap (%) | 1,744 | 0.00% |
| Wage / Income Gap ($) | 1,744 | 100.00¢ per $1 |
| Gini / Inequality Index | 1,744 | 0.32 |
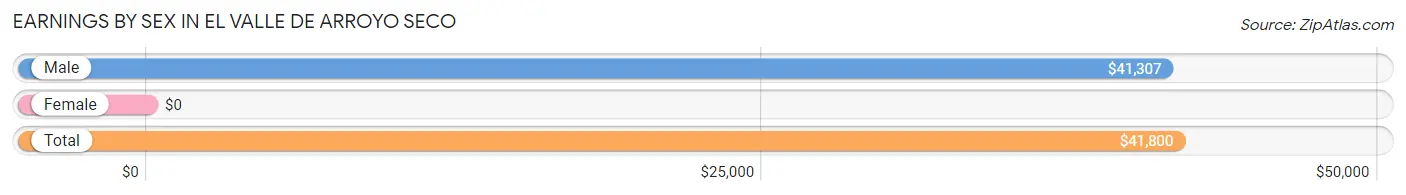
Earnings by Sex in El Valle de Arroyo Seco
| Sex | Number | Average Earnings |
| Male | 334 (43.5%) | $41,307 |
| Female | 433 (56.5%) | $0 |
| Total | 767 (100.0%) | $41,800 |
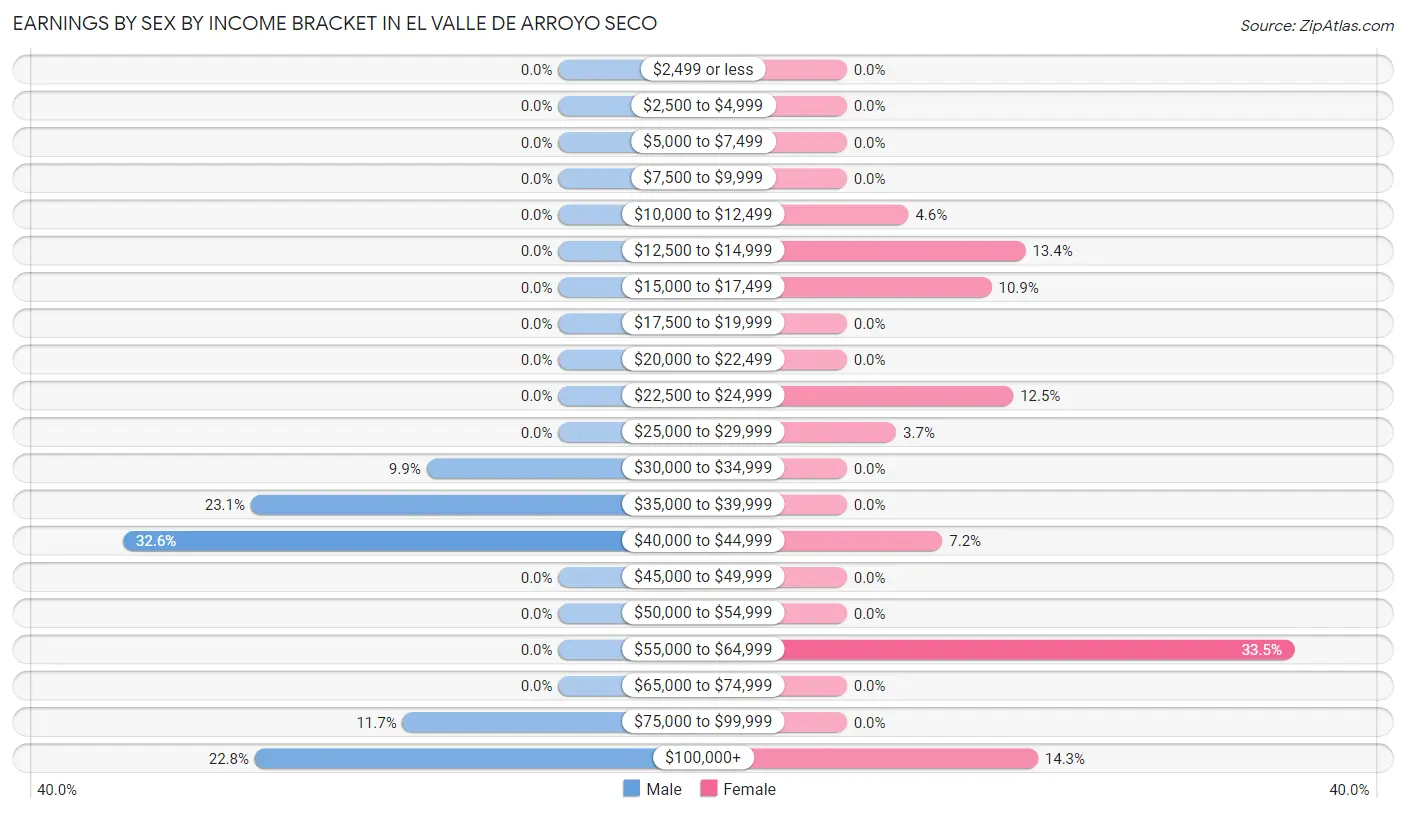
Earnings by Sex by Income Bracket in El Valle de Arroyo Seco
The most common earnings brackets in El Valle de Arroyo Seco are $40,000 to $44,999 for men (109 | 32.6%) and $55,000 to $64,999 for women (145 | 33.5%).
| Income | Male | Female |
| $2,499 or less | 0 (0.0%) | 0 (0.0%) |
| $2,500 to $4,999 | 0 (0.0%) | 0 (0.0%) |
| $5,000 to $7,499 | 0 (0.0%) | 0 (0.0%) |
| $7,500 to $9,999 | 0 (0.0%) | 0 (0.0%) |
| $10,000 to $12,499 | 0 (0.0%) | 20 (4.6%) |
| $12,500 to $14,999 | 0 (0.0%) | 58 (13.4%) |
| $15,000 to $17,499 | 0 (0.0%) | 47 (10.8%) |
| $17,500 to $19,999 | 0 (0.0%) | 0 (0.0%) |
| $20,000 to $22,499 | 0 (0.0%) | 0 (0.0%) |
| $22,500 to $24,999 | 0 (0.0%) | 54 (12.5%) |
| $25,000 to $29,999 | 0 (0.0%) | 16 (3.7%) |
| $30,000 to $34,999 | 33 (9.9%) | 0 (0.0%) |
| $35,000 to $39,999 | 77 (23.1%) | 0 (0.0%) |
| $40,000 to $44,999 | 109 (32.6%) | 31 (7.2%) |
| $45,000 to $49,999 | 0 (0.0%) | 0 (0.0%) |
| $50,000 to $54,999 | 0 (0.0%) | 0 (0.0%) |
| $55,000 to $64,999 | 0 (0.0%) | 145 (33.5%) |
| $65,000 to $74,999 | 0 (0.0%) | 0 (0.0%) |
| $75,000 to $99,999 | 39 (11.7%) | 0 (0.0%) |
| $100,000+ | 76 (22.8%) | 62 (14.3%) |
| Total | 334 (100.0%) | 433 (100.0%) |
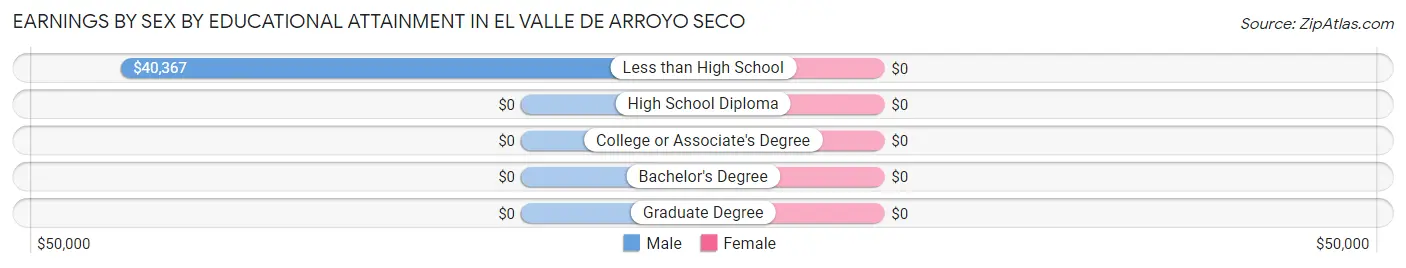
Earnings by Sex by Educational Attainment in El Valle de Arroyo Seco
| Educational Attainment | Male Income | Female Income |
| Less than High School | $40,367 | $0 |
| High School Diploma | - | - |
| College or Associate's Degree | - | - |
| Bachelor's Degree | - | - |
| Graduate Degree | - | - |
| Total | $41,307 | $60,302 |
Family Income in El Valle de Arroyo Seco
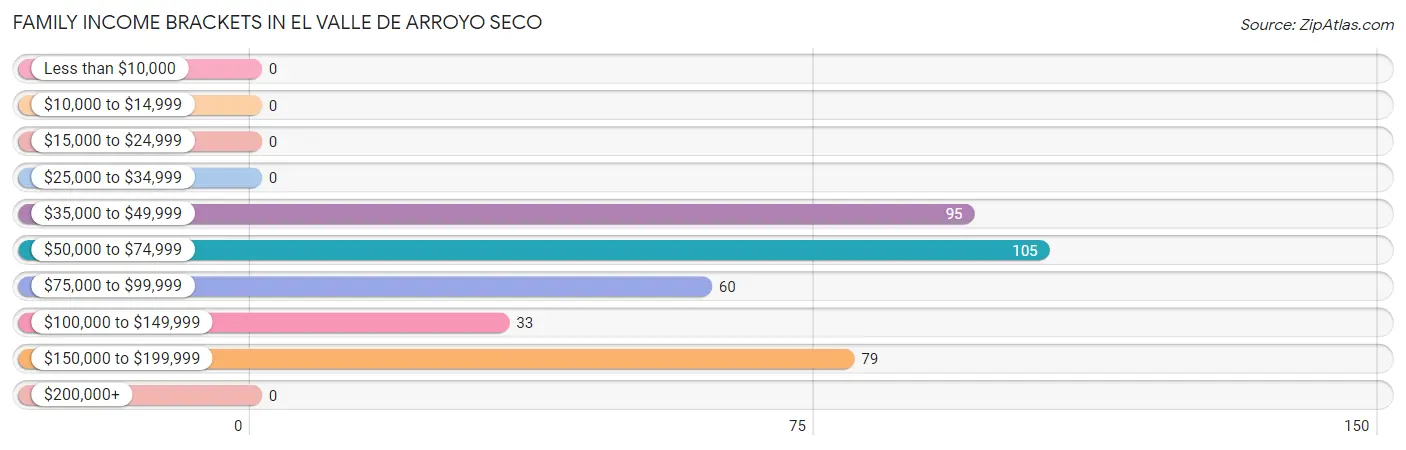
Family Income Brackets in El Valle de Arroyo Seco
According to the El Valle de Arroyo Seco family income data, there are 105 families falling into the $50,000 to $74,999 income range, which is the most common income bracket and makes up 28.2% of all families.
| Income Bracket | # Families | % Families |
| Less than $10,000 | 0 | 0.0% |
| $10,000 to $14,999 | 0 | 0.0% |
| $15,000 to $24,999 | 0 | 0.0% |
| $25,000 to $34,999 | 0 | 0.0% |
| $35,000 to $49,999 | 95 | 25.5% |
| $50,000 to $74,999 | 105 | 28.2% |
| $75,000 to $99,999 | 60 | 16.1% |
| $100,000 to $149,999 | 33 | 8.9% |
| $150,000 to $199,999 | 79 | 21.2% |
| $200,000+ | 0 | 0.0% |
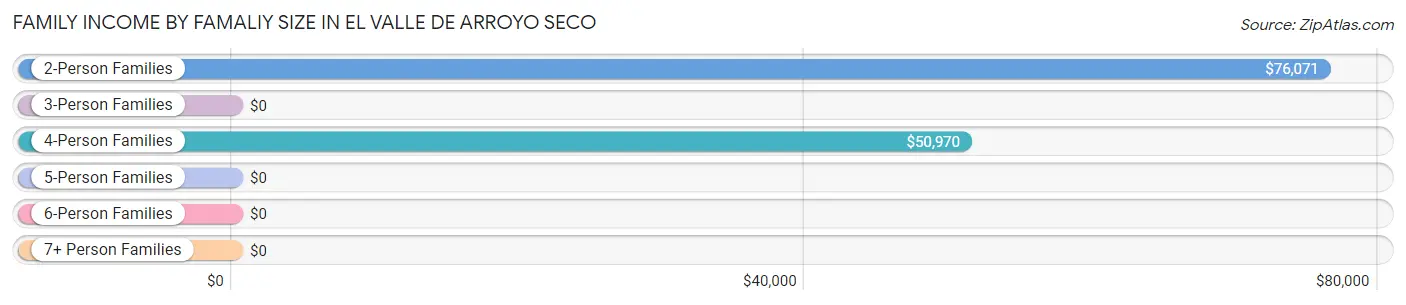
Family Income by Famaliy Size in El Valle de Arroyo Seco
2-person families (124 | 33.3%) account for the highest median family income in El Valle de Arroyo Seco with $76,071 per family, while 2-person families (124 | 33.3%) have the highest median income of $38,036 per family member.
| Income Bracket | # Families | Median Income |
| 2-Person Families | 124 (33.3%) | $76,071 |
| 3-Person Families | 47 (12.6%) | $0 |
| 4-Person Families | 167 (44.9%) | $50,970 |
| 5-Person Families | 34 (9.1%) | $0 |
| 6-Person Families | 0 (0.0%) | $0 |
| 7+ Person Families | 0 (0.0%) | $0 |
| Total | 372 (100.0%) | $56,755 |
Family Income by Number of Earners in El Valle de Arroyo Seco
| Number of Earners | # Families | Median Income |
| No Earners | 69 (18.5%) | $0 |
| 1 Earner | 103 (27.7%) | $0 |
| 2 Earners | 200 (53.8%) | $0 |
| 3+ Earners | 0 (0.0%) | $0 |
| Total | 372 (100.0%) | $56,755 |
Household Income in El Valle de Arroyo Seco
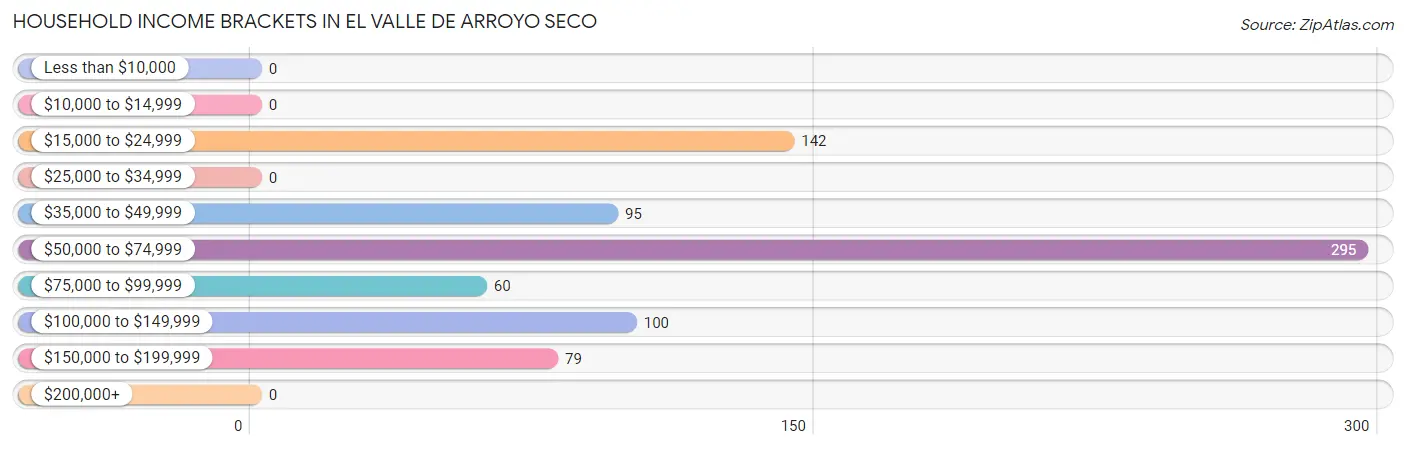
Household Income Brackets in El Valle de Arroyo Seco
With 295 households falling in the category, the $50,000 to $74,999 income range is the most frequent in El Valle de Arroyo Seco, accounting for 38.3% of all households.
| Income Bracket | # Households | % Households |
| Less than $10,000 | 0 | 0.0% |
| $10,000 to $14,999 | 0 | 0.0% |
| $15,000 to $24,999 | 142 | 18.4% |
| $25,000 to $34,999 | 0 | 0.0% |
| $35,000 to $49,999 | 95 | 12.3% |
| $50,000 to $74,999 | 295 | 38.3% |
| $75,000 to $99,999 | 60 | 7.8% |
| $100,000 to $149,999 | 100 | 13.0% |
| $150,000 to $199,999 | 79 | 10.2% |
| $200,000+ | 0 | 0.0% |
Household Income by Householder Age in El Valle de Arroyo Seco
The median household income in El Valle de Arroyo Seco is $65,750, with the highest median household income of $66,776 found in the 45 to 64 years age bracket for the primary householder. A total of 206 households (26.7%) fall into this category.
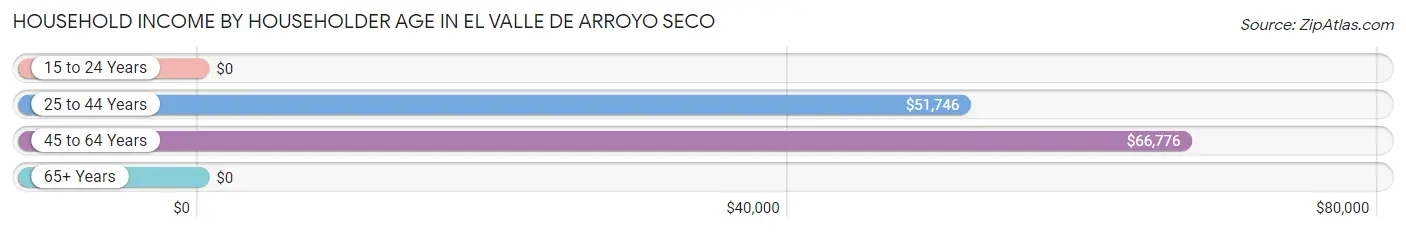
| Income Bracket | # Households | Median Income |
| 15 to 24 Years | 0 (0.0%) | $0 |
| 25 to 44 Years | 271 (35.1%) | $51,746 |
| 45 to 64 Years | 206 (26.7%) | $66,776 |
| 65+ Years | 294 (38.1%) | $0 |
| Total | 771 (100.0%) | $65,750 |
Poverty in El Valle de Arroyo Seco
Income Below Poverty by Sex and Age in El Valle de Arroyo Seco
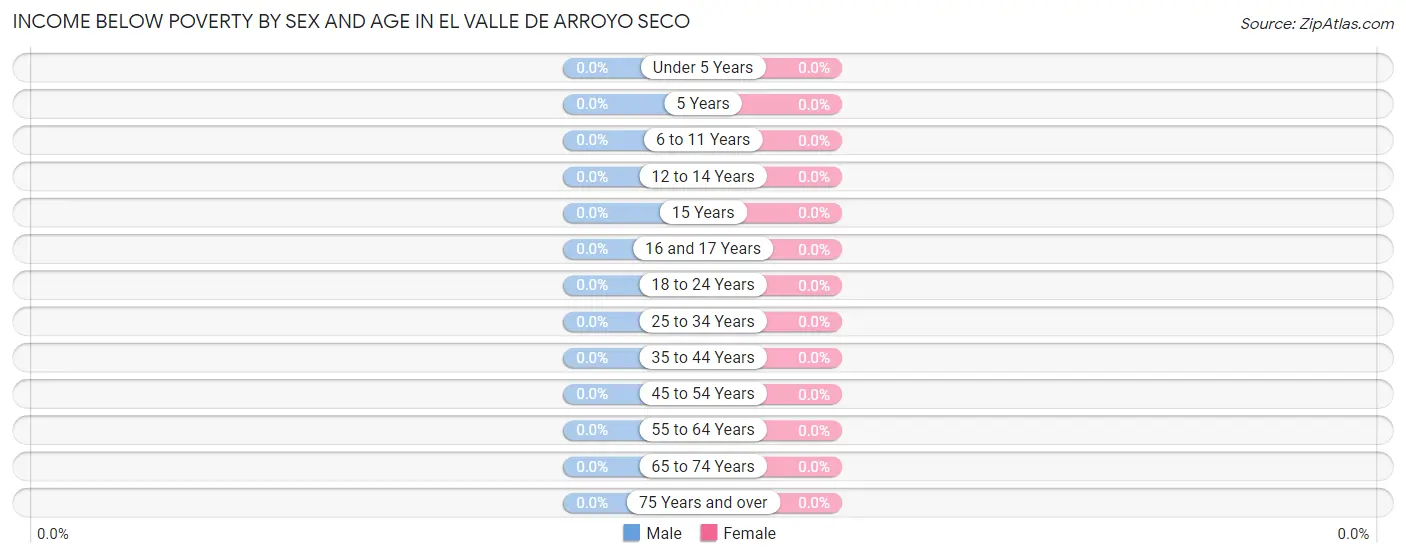
| Age Bracket | Male | Female |
| Under 5 Years | 0 (0.0%) | 0 (0.0%) |
| 5 Years | 0 (0.0%) | 0 (0.0%) |
| 6 to 11 Years | 0 (0.0%) | 0 (0.0%) |
| 12 to 14 Years | 0 (0.0%) | 0 (0.0%) |
| 15 Years | 0 (0.0%) | 0 (0.0%) |
| 16 and 17 Years | 0 (0.0%) | 0 (0.0%) |
| 18 to 24 Years | 0 (0.0%) | 0 (0.0%) |
| 25 to 34 Years | 0 (0.0%) | 0 (0.0%) |
| 35 to 44 Years | 0 (0.0%) | 0 (0.0%) |
| 45 to 54 Years | 0 (0.0%) | 0 (0.0%) |
| 55 to 64 Years | 0 (0.0%) | 0 (0.0%) |
| 65 to 74 Years | 0 (0.0%) | 0 (0.0%) |
| 75 Years and over | 0 (0.0%) | 0 (0.0%) |
| Total | 0 (0.0%) | 0 (0.0%) |
Income Above Poverty by Sex and Age in El Valle de Arroyo Seco
According to the poverty statistics in El Valle de Arroyo Seco, males aged under 5 years and females aged 5 years are the age groups that are most secure financially, with 100.0% of males and 100.0% of females in these age groups living above the poverty line.
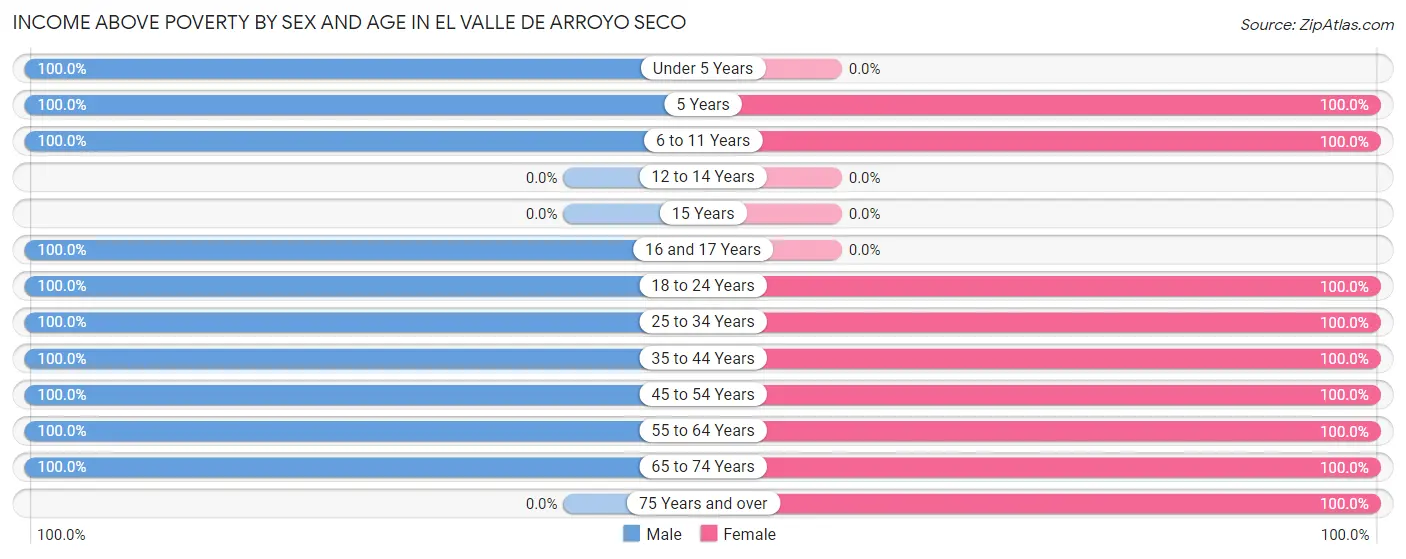
| Age Bracket | Male | Female |
| Under 5 Years | 45 (100.0%) | 0 (0.0%) |
| 5 Years | 42 (100.0%) | 64 (100.0%) |
| 6 to 11 Years | 132 (100.0%) | 35 (100.0%) |
| 12 to 14 Years | 0 (0.0%) | 0 (0.0%) |
| 15 Years | 0 (0.0%) | 0 (0.0%) |
| 16 and 17 Years | 67 (100.0%) | 0 (0.0%) |
| 18 to 24 Years | 85 (100.0%) | 54 (100.0%) |
| 25 to 34 Years | 105 (100.0%) | 34 (100.0%) |
| 35 to 44 Years | 157 (100.0%) | 213 (100.0%) |
| 45 to 54 Years | 121 (100.0%) | 165 (100.0%) |
| 55 to 64 Years | 17 (100.0%) | 15 (100.0%) |
| 65 to 74 Years | 105 (100.0%) | 146 (100.0%) |
| 75 Years and over | 0 (0.0%) | 142 (100.0%) |
| Total | 876 (100.0%) | 868 (100.0%) |
Income Below Poverty Among Married-Couple Families in El Valle de Arroyo Seco
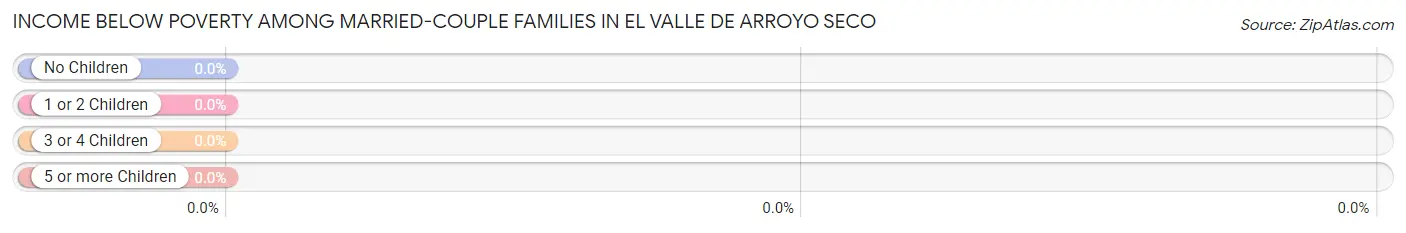
| Children | Above Poverty | Below Poverty |
| No Children | 124 (100.0%) | 0 (0.0%) |
| 1 or 2 Children | 167 (100.0%) | 0 (0.0%) |
| 3 or 4 Children | 0 (0.0%) | 0 (0.0%) |
| 5 or more Children | 0 (0.0%) | 0 (0.0%) |
| Total | 291 (100.0%) | 0 (0.0%) |
Income Below Poverty Among Single-Parent Households in El Valle de Arroyo Seco
| Children | Single Father | Single Mother |
| No Children | 0 (0.0%) | 0 (0.0%) |
| 1 or 2 Children | 0 (0.0%) | 0 (0.0%) |
| 3 or 4 Children | 0 (0.0%) | 0 (0.0%) |
| 5 or more Children | 0 (0.0%) | 0 (0.0%) |
| Total | 0 (0.0%) | 0 (0.0%) |
Income Below Poverty Among Married-Couple vs Single-Parent Households in El Valle de Arroyo Seco
| Children | Married-Couple Families | Single-Parent Households |
| No Children | 0 (0.0%) | 0 (0.0%) |
| 1 or 2 Children | 0 (0.0%) | 0 (0.0%) |
| 3 or 4 Children | 0 (0.0%) | 0 (0.0%) |
| 5 or more Children | 0 (0.0%) | 0 (0.0%) |
| Total | 0 (0.0%) | 0 (0.0%) |
Race in El Valle de Arroyo Seco
The most populous races in El Valle de Arroyo Seco are Hispanic or Latino (1,354 | 77.6%), Some other Race (1,088 | 62.4%), and White / Caucasian (475 | 27.2%).
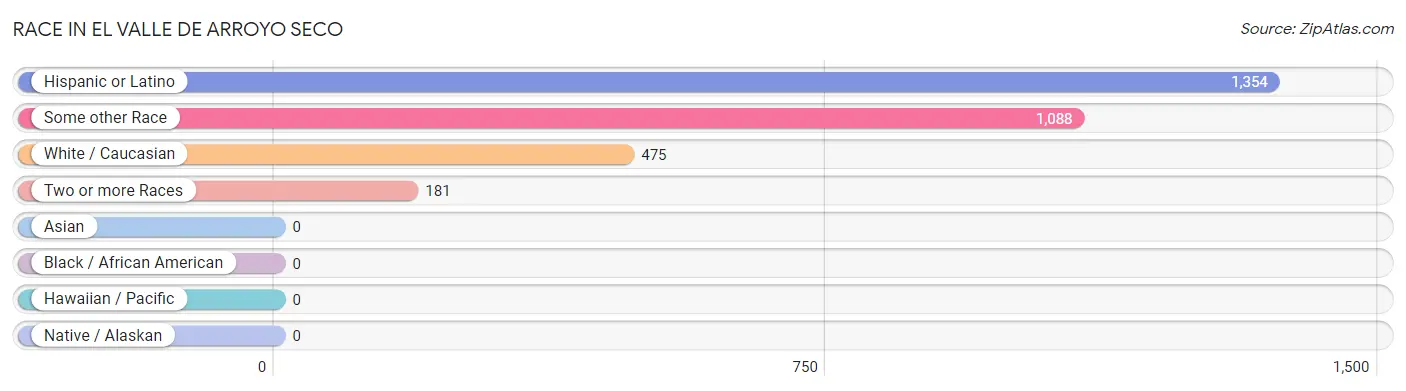
| Race | # Population | % Population |
| Asian | 0 | 0.0% |
| Black / African American | 0 | 0.0% |
| Hawaiian / Pacific | 0 | 0.0% |
| Hispanic or Latino | 1,354 | 77.6% |
| Native / Alaskan | 0 | 0.0% |
| White / Caucasian | 475 | 27.2% |
| Two or more Races | 181 | 10.4% |
| Some other Race | 1,088 | 62.4% |
| Total | 1,744 | 100.0% |
Ancestry in El Valle de Arroyo Seco
The most populous ancestries reported in El Valle de Arroyo Seco are Mexican (624 | 35.8%), Spaniard (389 | 22.3%), Spanish (145 | 8.3%), American (143 | 8.2%), and Irish (142 | 8.1%), together accounting for 82.7% of all El Valle de Arroyo Seco residents.
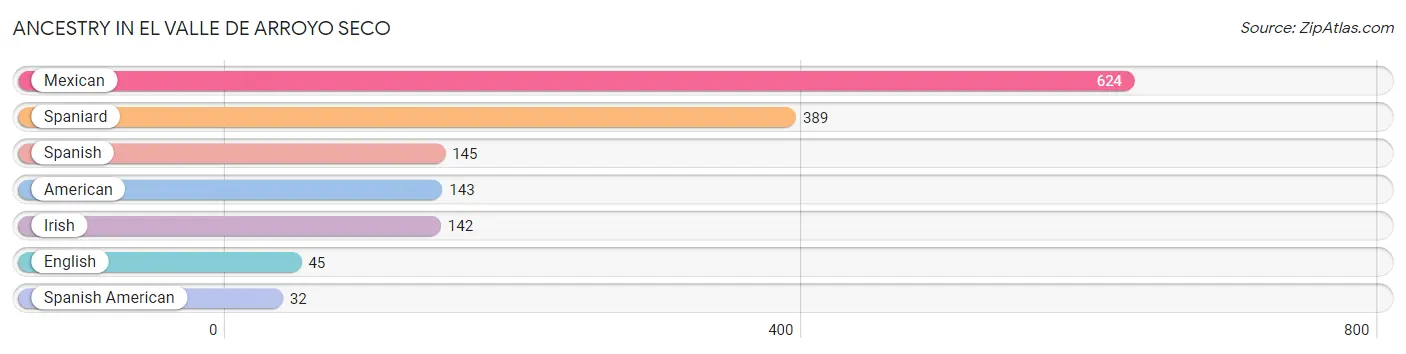
| Ancestry | # Population | % Population |
| American | 143 | 8.2% |
| English | 45 | 2.6% |
| Irish | 142 | 8.1% |
| Mexican | 624 | 35.8% |
| Spaniard | 389 | 22.3% |
| Spanish | 145 | 8.3% |
| Spanish American | 32 | 1.8% | View All 7 Rows |
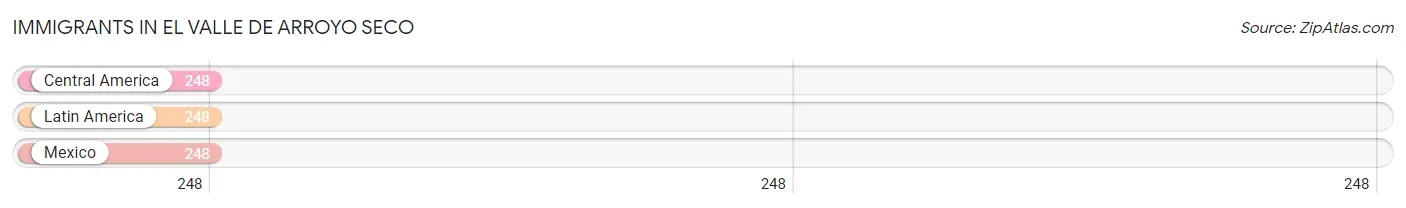
Immigrants in El Valle de Arroyo Seco
The most numerous immigrant groups reported in El Valle de Arroyo Seco came from Central America (248 | 14.2%), Latin America (248 | 14.2%), and Mexico (248 | 14.2%), together accounting for 42.7% of all El Valle de Arroyo Seco residents.
| Immigration Origin | # Population | % Population |
| Central America | 248 | 14.2% |
| Latin America | 248 | 14.2% |
| Mexico | 248 | 14.2% | View All 3 Rows |
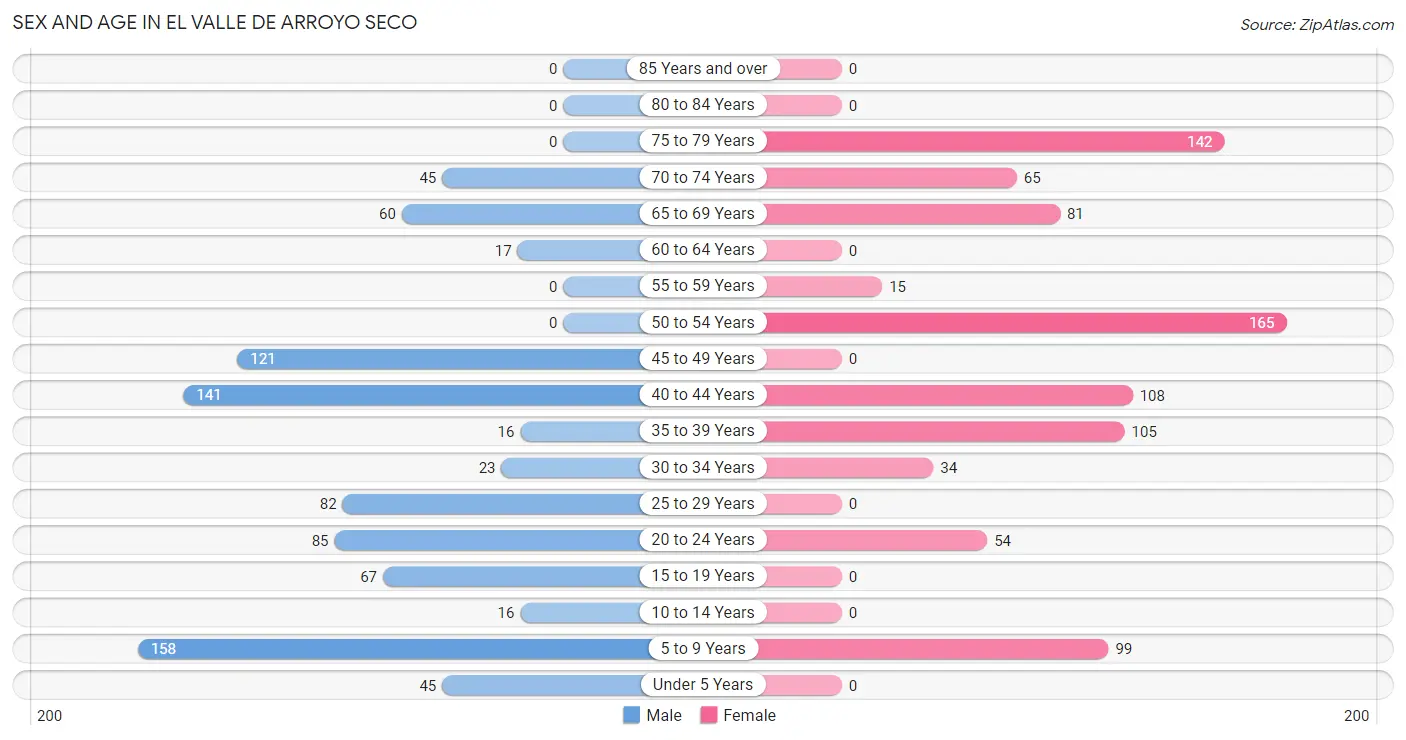
Sex and Age in El Valle de Arroyo Seco
Sex and Age in El Valle de Arroyo Seco
The most populous age groups in El Valle de Arroyo Seco are 5 to 9 Years (158 | 18.0%) for men and 50 to 54 Years (165 | 19.0%) for women.
| Age Bracket | Male | Female |
| Under 5 Years | 45 (5.1%) | 0 (0.0%) |
| 5 to 9 Years | 158 (18.0%) | 99 (11.4%) |
| 10 to 14 Years | 16 (1.8%) | 0 (0.0%) |
| 15 to 19 Years | 67 (7.6%) | 0 (0.0%) |
| 20 to 24 Years | 85 (9.7%) | 54 (6.2%) |
| 25 to 29 Years | 82 (9.4%) | 0 (0.0%) |
| 30 to 34 Years | 23 (2.6%) | 34 (3.9%) |
| 35 to 39 Years | 16 (1.8%) | 105 (12.1%) |
| 40 to 44 Years | 141 (16.1%) | 108 (12.4%) |
| 45 to 49 Years | 121 (13.8%) | 0 (0.0%) |
| 50 to 54 Years | 0 (0.0%) | 165 (19.0%) |
| 55 to 59 Years | 0 (0.0%) | 15 (1.7%) |
| 60 to 64 Years | 17 (1.9%) | 0 (0.0%) |
| 65 to 69 Years | 60 (6.9%) | 81 (9.3%) |
| 70 to 74 Years | 45 (5.1%) | 65 (7.5%) |
| 75 to 79 Years | 0 (0.0%) | 142 (16.4%) |
| 80 to 84 Years | 0 (0.0%) | 0 (0.0%) |
| 85 Years and over | 0 (0.0%) | 0 (0.0%) |
| Total | 876 (100.0%) | 868 (100.0%) |
Families and Households in El Valle de Arroyo Seco
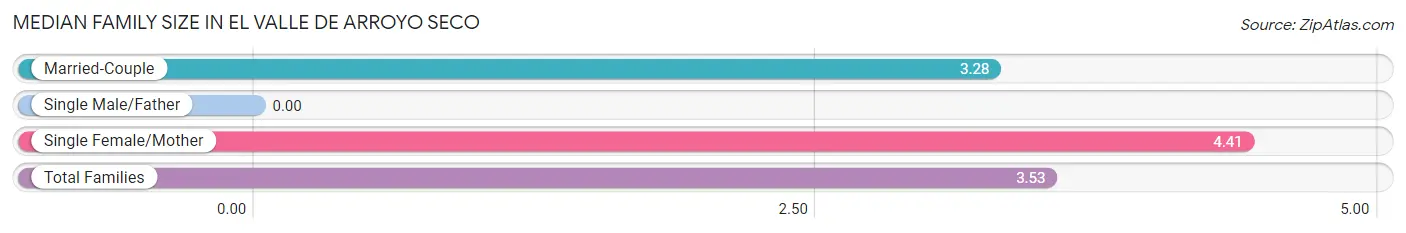
Median Family Size in El Valle de Arroyo Seco
| Family Type | # Families | Family Size |
| Married-Couple | 291 (78.2%) | 3.28 |
| Single Male/Father | 0 (0.0%) | - |
| Single Female/Mother | 81 (21.8%) | 4.41 |
| Total Families | 372 (100.0%) | 3.53 |
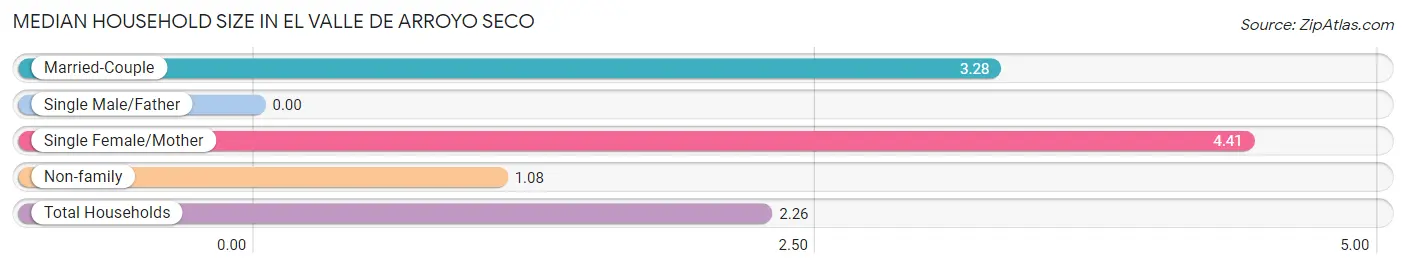
Median Household Size in El Valle de Arroyo Seco
| Household Type | # Households | Household Size |
| Married-Couple | 291 (37.7%) | 3.28 |
| Single Male/Father | 0 (0.0%) | - |
| Single Female/Mother | 81 (10.5%) | 4.41 |
| Non-family | 399 (51.7%) | 1.08 |
| Total Households | 771 (100.0%) | 2.26 |
Household Size by Marriage Status in El Valle de Arroyo Seco
Out of a total of 771 households in El Valle de Arroyo Seco, 372 (48.2%) are family households, while 399 (51.7%) are nonfamily households. The most numerous type of family households are 4-person households, comprising 167, and the most common type of nonfamily households are 1-person households, comprising 376.
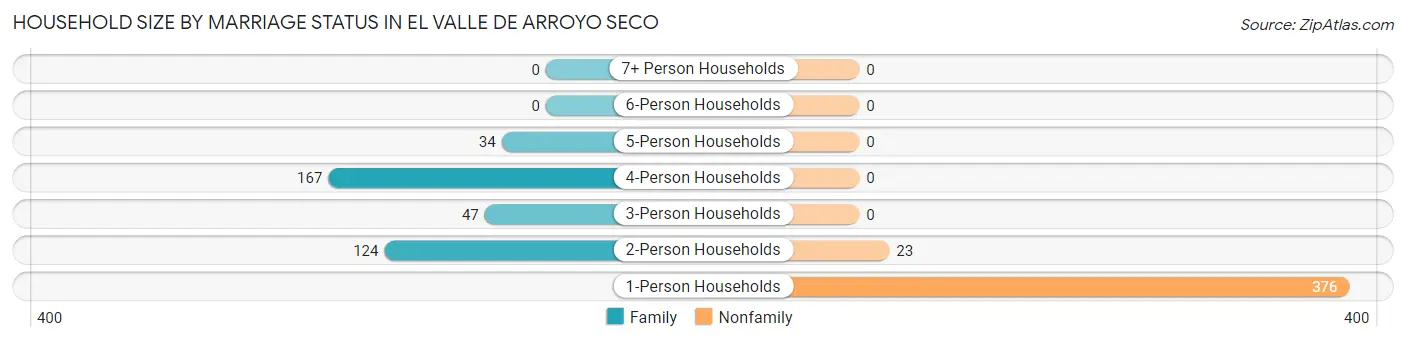
| Household Size | Family Households | Nonfamily Households |
| 1-Person Households | - | 376 (48.8%) |
| 2-Person Households | 124 (16.1%) | 23 (3.0%) |
| 3-Person Households | 47 (6.1%) | 0 (0.0%) |
| 4-Person Households | 167 (21.7%) | 0 (0.0%) |
| 5-Person Households | 34 (4.4%) | 0 (0.0%) |
| 6-Person Households | 0 (0.0%) | 0 (0.0%) |
| 7+ Person Households | 0 (0.0%) | 0 (0.0%) |
| Total | 372 (48.2%) | 399 (51.7%) |
Female Fertility in El Valle de Arroyo Seco
Fertility by Age in El Valle de Arroyo Seco
| Age Bracket | Women with Births | Births / 1,000 Women |
| 15 to 19 years | 0 (0.0%) | 0.0 |
| 20 to 34 years | 0 (0.0%) | 0.0 |
| 35 to 50 years | 0 (0.0%) | 0.0 |
| Total | 0 (0.0%) | 0.0 |
Fertility by Age by Marriage Status in El Valle de Arroyo Seco
| Age Bracket | Married | Unmarried |
| 15 to 19 years | 0 (0.0%) | 0 (0.0%) |
| 20 to 34 years | 0 (0.0%) | 0 (0.0%) |
| 35 to 50 years | 0 (0.0%) | 0 (0.0%) |
| Total | 0 (0.0%) | 0 (0.0%) |
Fertility by Education in El Valle de Arroyo Seco
| Educational Attainment | Women with Births | Births / 1,000 Women |
| Less than High School | 0 (0.0%) | 0.0 |
| High School Diploma | 0 (0.0%) | 0.0 |
| College or Associate's Degree | 0 (0.0%) | 0.0 |
| Bachelor's Degree | 0 (0.0%) | 0.0 |
| Graduate Degree | 0 (0.0%) | 0.0 |
| Total | 0 (0.0%) | 0.0 |
Fertility by Education by Marriage Status in El Valle de Arroyo Seco
| Educational Attainment | Married | Unmarried |
| Less than High School | 0 (0.0%) | 0 (0.0%) |
| High School Diploma | 0 (0.0%) | 0 (0.0%) |
| College or Associate's Degree | 0 (0.0%) | 0 (0.0%) |
| Bachelor's Degree | 0 (0.0%) | 0 (0.0%) |
| Graduate Degree | 0 (0.0%) | 0 (0.0%) |
| Total | 0 (0.0%) | 0 (0.0%) |
Employment Characteristics in El Valle de Arroyo Seco
Employment by Class of Employer in El Valle de Arroyo Seco
Among the 767 employed individuals in El Valle de Arroyo Seco, private company employees (575 | 75.0%), federal government employees (115 | 15.0%), and self-employed (not incorporated) (77 | 10.0%) make up the most common classes of employment.

| Employer Class | # Employees | % Employees |
| Private Company Employees | 575 | 75.0% |
| Self-Employed (Incorporated) | 0 | 0.0% |
| Self-Employed (Not Incorporated) | 77 | 10.0% |
| Not-for-profit Organizations | 0 | 0.0% |
| Local Government Employees | 0 | 0.0% |
| State Government Employees | 0 | 0.0% |
| Federal Government Employees | 115 | 15.0% |
| Unpaid Family Workers | 0 | 0.0% |
| Total | 767 | 100.0% |
Employment Status by Age in El Valle de Arroyo Seco
According to the labor force statistics for El Valle de Arroyo Seco, out of the total population over 16 years of age (1,426), 57.2% or 816 individuals are in the labor force, with 6.0% or 49 of them unemployed. The age group with the highest labor force participation rate is 25 to 29 years, with 100.0% or 82 individuals in the labor force. Within the labor force, the 25 to 29 years age range has the highest percentage of unemployed individuals, with 59.8% or 49 of them being unemployed.
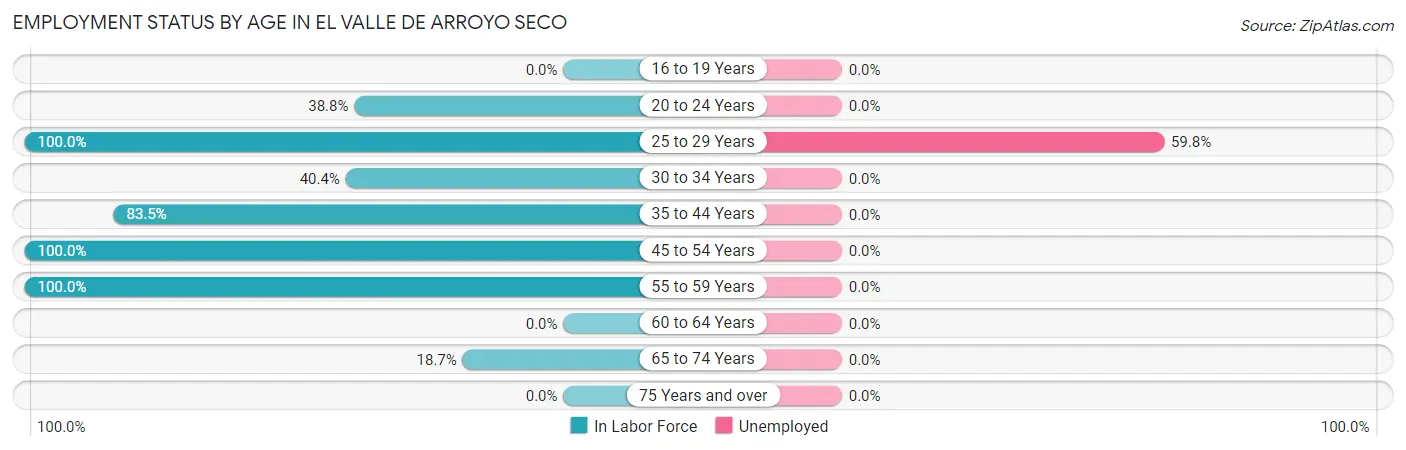
| Age Bracket | In Labor Force | Unemployed |
| 16 to 19 Years | 0 (0.0%) | 0 (0.0%) |
| 20 to 24 Years | 54 (38.8%) | 0 (0.0%) |
| 25 to 29 Years | 82 (100.0%) | 49 (59.8%) |
| 30 to 34 Years | 23 (40.4%) | 0 (0.0%) |
| 35 to 44 Years | 309 (83.5%) | 0 (0.0%) |
| 45 to 54 Years | 286 (100.0%) | 0 (0.0%) |
| 55 to 59 Years | 15 (100.0%) | 0 (0.0%) |
| 60 to 64 Years | 0 (0.0%) | 0 (0.0%) |
| 65 to 74 Years | 47 (18.7%) | 0 (0.0%) |
| 75 Years and over | 0 (0.0%) | 0 (0.0%) |
| Total | 816 (57.2%) | 49 (6.0%) |
Employment Status by Educational Attainment in El Valle de Arroyo Seco
According to labor force statistics for El Valle de Arroyo Seco, 86.5% of individuals (715) out of the total population between 25 and 64 years of age (827) are in the labor force, with 6.9% or 49 of them being unemployed. The group with the highest labor force participation rate are those with the educational attainment of bachelor's degree or higher, with 100.0% or 122 individuals in the labor force. Within the labor force, individuals with high school diploma education have the highest percentage of unemployment, with 31.8% or 49 of them being unemployed.
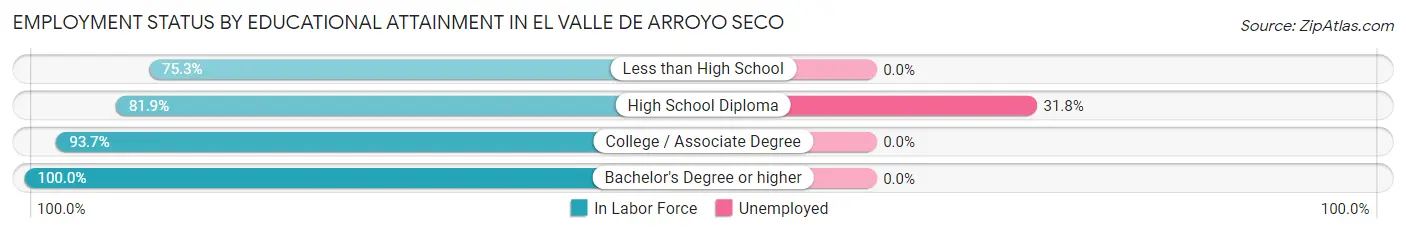
| Educational Attainment | In Labor Force | Unemployed |
| Less than High School | 186 (75.3%) | 0 (0.0%) |
| High School Diploma | 154 (81.9%) | 60 (31.8%) |
| College / Associate Degree | 253 (93.7%) | 0 (0.0%) |
| Bachelor's Degree or higher | 122 (100.0%) | 0 (0.0%) |
| Total | 715 (86.5%) | 57 (6.9%) |
Employment Occupations by Sex in El Valle de Arroyo Seco
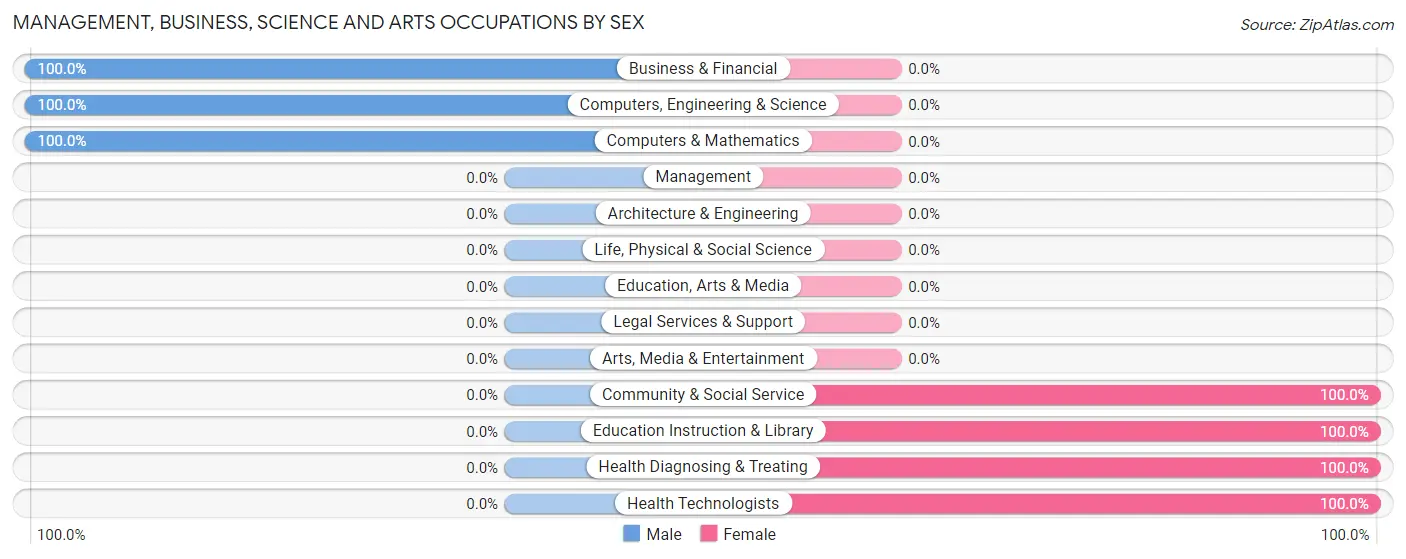
Management, Business, Science and Arts Occupations
The most common Management, Business, Science and Arts occupations in El Valle de Arroyo Seco are Computers, Engineering & Science (55 | 7.2%), Computers & Mathematics (55 | 7.2%), Health Diagnosing & Treating (47 | 6.1%), Health Technologists (47 | 6.1%), and Business & Financial (44 | 5.7%).
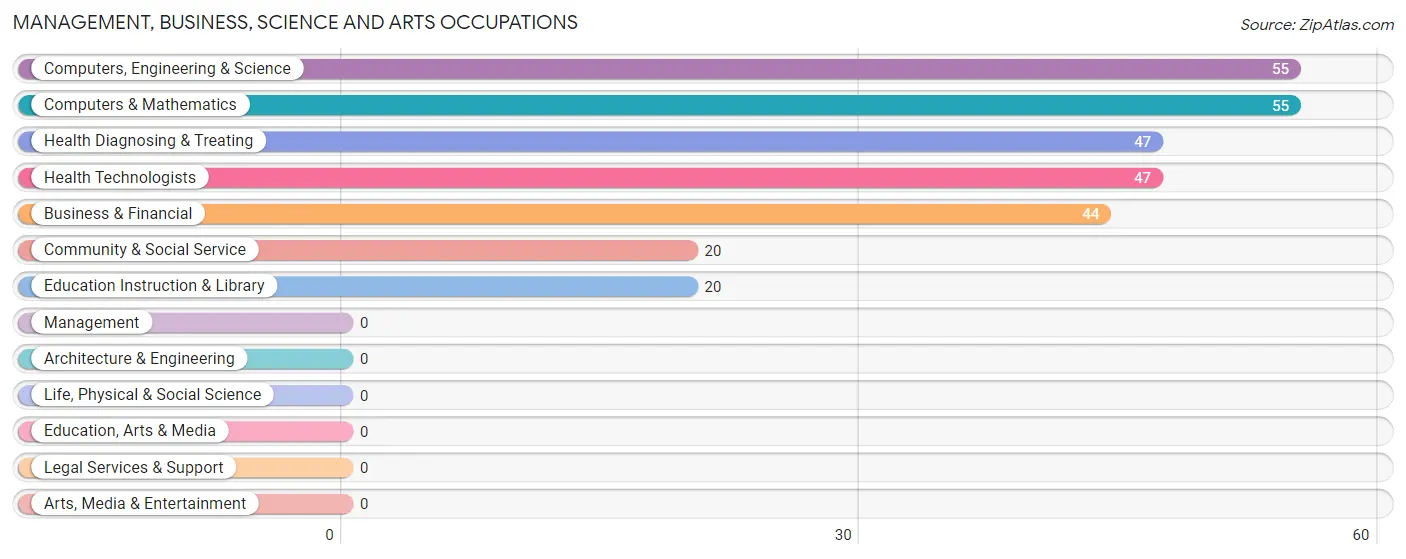
Management, Business, Science and Arts Occupations by Sex
Within the Management, Business, Science and Arts occupations in El Valle de Arroyo Seco, the most male-oriented occupations are Business & Financial (100.0%), Computers, Engineering & Science (100.0%), and Computers & Mathematics (100.0%), while the most female-oriented occupations are Community & Social Service (100.0%), Education Instruction & Library (100.0%), and Health Diagnosing & Treating (100.0%).
| Occupation | Male | Female |
| Management | 0 (0.0%) | 0 (0.0%) |
| Business & Financial | 44 (100.0%) | 0 (0.0%) |
| Computers, Engineering & Science | 55 (100.0%) | 0 (0.0%) |
| Computers & Mathematics | 55 (100.0%) | 0 (0.0%) |
| Architecture & Engineering | 0 (0.0%) | 0 (0.0%) |
| Life, Physical & Social Science | 0 (0.0%) | 0 (0.0%) |
| Community & Social Service | 0 (0.0%) | 20 (100.0%) |
| Education, Arts & Media | 0 (0.0%) | 0 (0.0%) |
| Legal Services & Support | 0 (0.0%) | 0 (0.0%) |
| Education Instruction & Library | 0 (0.0%) | 20 (100.0%) |
| Arts, Media & Entertainment | 0 (0.0%) | 0 (0.0%) |
| Health Diagnosing & Treating | 0 (0.0%) | 47 (100.0%) |
| Health Technologists | 0 (0.0%) | 47 (100.0%) |
| Total (Category) | 99 (59.6%) | 67 (40.4%) |
| Total (Overall) | 334 (43.5%) | 433 (56.5%) |
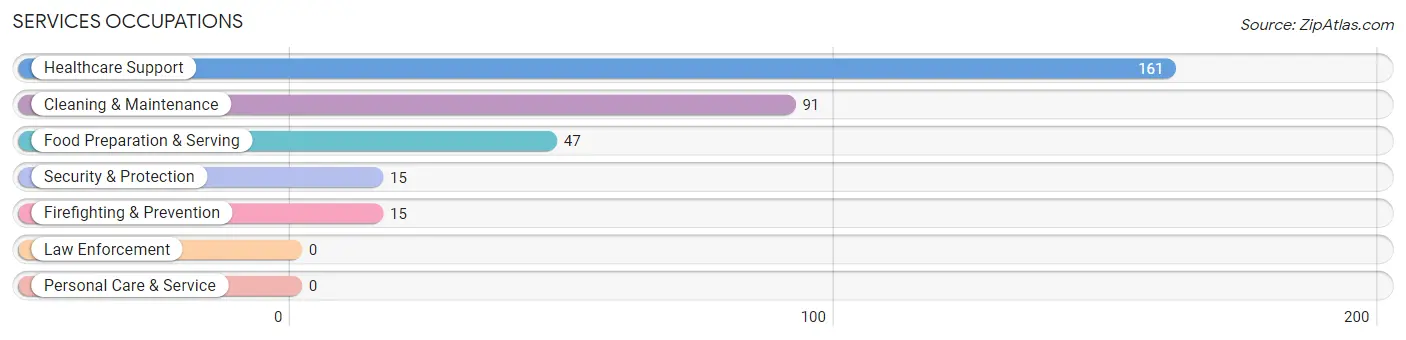
Services Occupations
The most common Services occupations in El Valle de Arroyo Seco are Healthcare Support (161 | 21.0%), Cleaning & Maintenance (91 | 11.9%), Food Preparation & Serving (47 | 6.1%), Security & Protection (15 | 2.0%), and Firefighting & Prevention (15 | 2.0%).
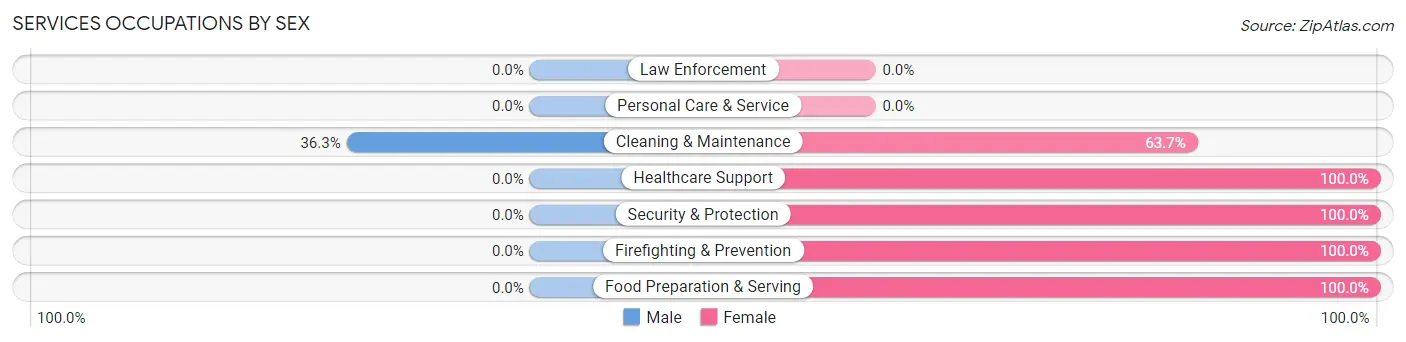
Services Occupations by Sex
| Occupation | Male | Female |
| Healthcare Support | 0 (0.0%) | 161 (100.0%) |
| Security & Protection | 0 (0.0%) | 15 (100.0%) |
| Firefighting & Prevention | 0 (0.0%) | 15 (100.0%) |
| Law Enforcement | 0 (0.0%) | 0 (0.0%) |
| Food Preparation & Serving | 0 (0.0%) | 47 (100.0%) |
| Cleaning & Maintenance | 33 (36.3%) | 58 (63.7%) |
| Personal Care & Service | 0 (0.0%) | 0 (0.0%) |
| Total (Category) | 33 (10.5%) | 281 (89.5%) |
| Total (Overall) | 334 (43.5%) | 433 (56.5%) |
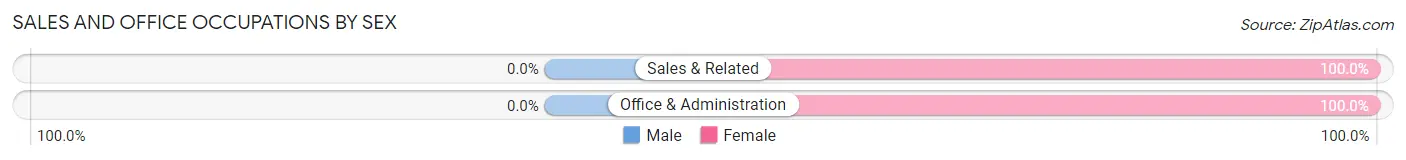
Sales and Office Occupations
The most common Sales and Office occupations in El Valle de Arroyo Seco are Office & Administration (54 | 7.0%), and Sales & Related (31 | 4.0%).

Sales and Office Occupations by Sex
| Occupation | Male | Female |
| Sales & Related | 0 (0.0%) | 31 (100.0%) |
| Office & Administration | 0 (0.0%) | 54 (100.0%) |
| Total (Category) | 0 (0.0%) | 85 (100.0%) |
| Total (Overall) | 334 (43.5%) | 433 (56.5%) |
Natural Resources, Construction and Maintenance Occupations
The most common Natural Resources, Construction and Maintenance occupations in El Valle de Arroyo Seco are , and Construction & Extraction (186 | 24.2%).
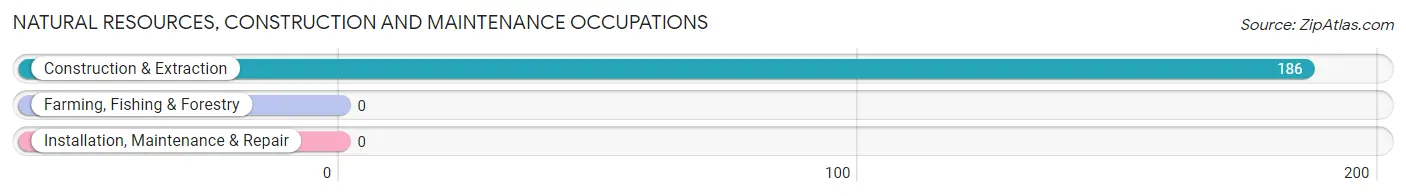
Natural Resources, Construction and Maintenance Occupations by Sex
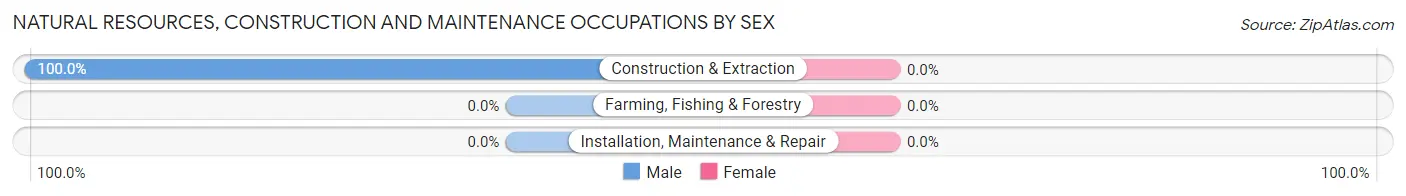
| Occupation | Male | Female |
| Farming, Fishing & Forestry | 0 (0.0%) | 0 (0.0%) |
| Construction & Extraction | 186 (100.0%) | 0 (0.0%) |
| Installation, Maintenance & Repair | 0 (0.0%) | 0 (0.0%) |
| Total (Category) | 186 (100.0%) | 0 (0.0%) |
| Total (Overall) | 334 (43.5%) | 433 (56.5%) |
Production, Transportation and Moving Occupations
The most common Production, Transportation and Moving occupations in El Valle de Arroyo Seco are , and Transportation (16 | 2.1%).
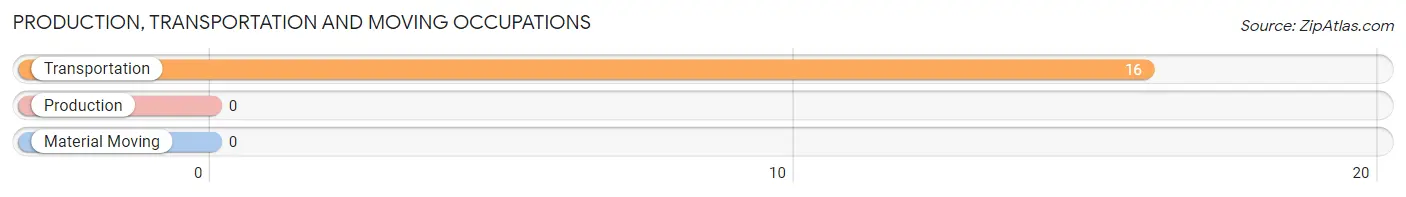
Production, Transportation and Moving Occupations by Sex
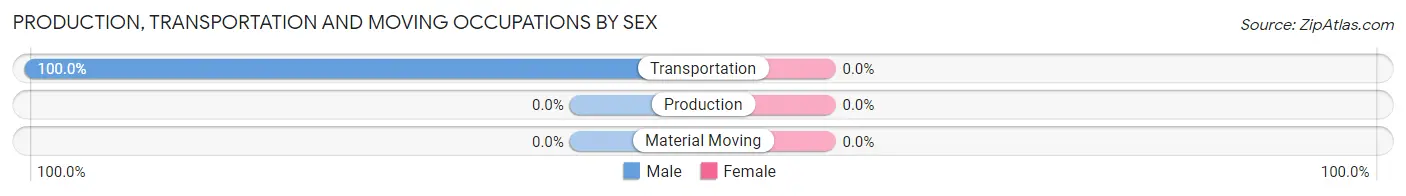
| Occupation | Male | Female |
| Production | 0 (0.0%) | 0 (0.0%) |
| Transportation | 16 (100.0%) | 0 (0.0%) |
| Material Moving | 0 (0.0%) | 0 (0.0%) |
| Total (Category) | 16 (100.0%) | 0 (0.0%) |
| Total (Overall) | 334 (43.5%) | 433 (56.5%) |
Employment Industries by Sex in El Valle de Arroyo Seco
Employment Industries in El Valle de Arroyo Seco
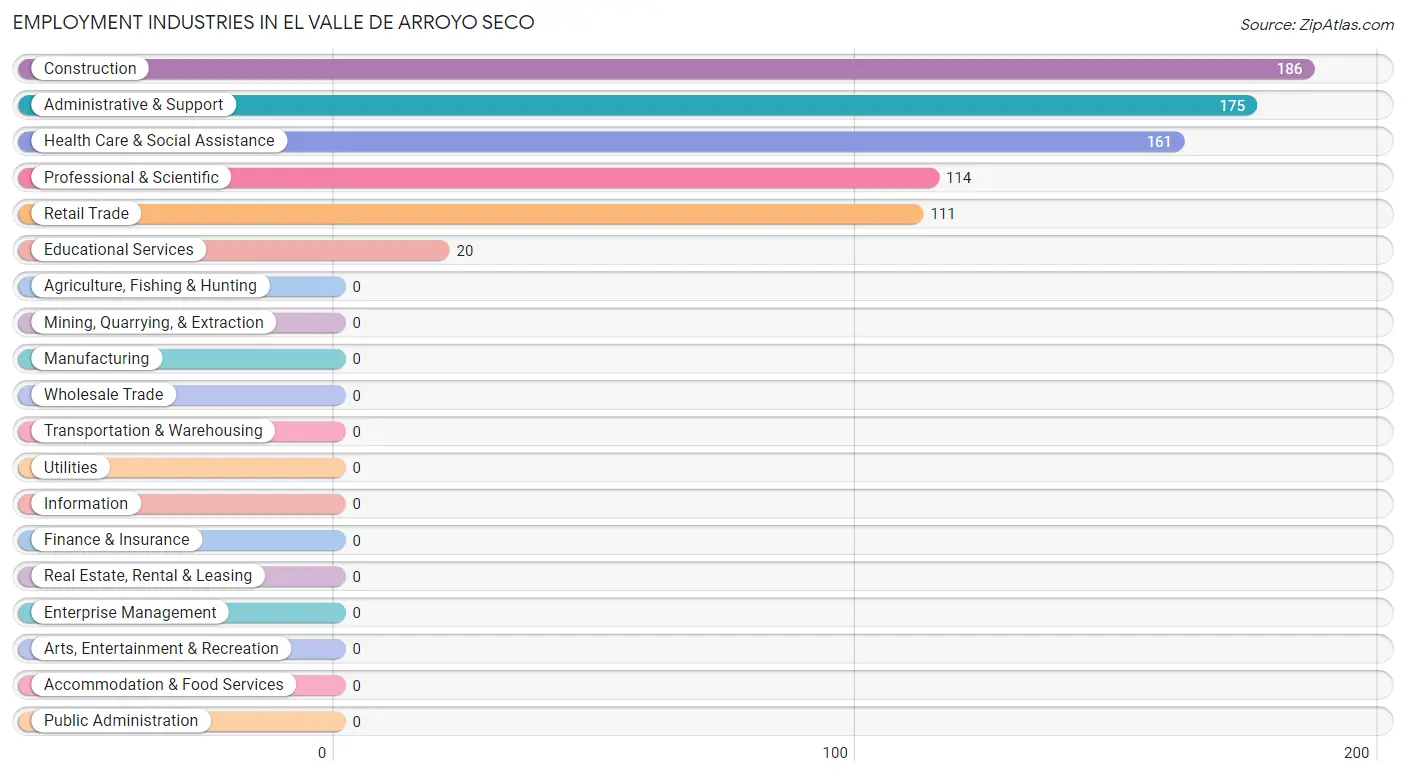
The major employment industries in El Valle de Arroyo Seco include Construction (186 | 24.2%), Administrative & Support (175 | 22.8%), Health Care & Social Assistance (161 | 21.0%), Professional & Scientific (114 | 14.9%), and Retail Trade (111 | 14.5%).
Employment Industries by Sex in El Valle de Arroyo Seco
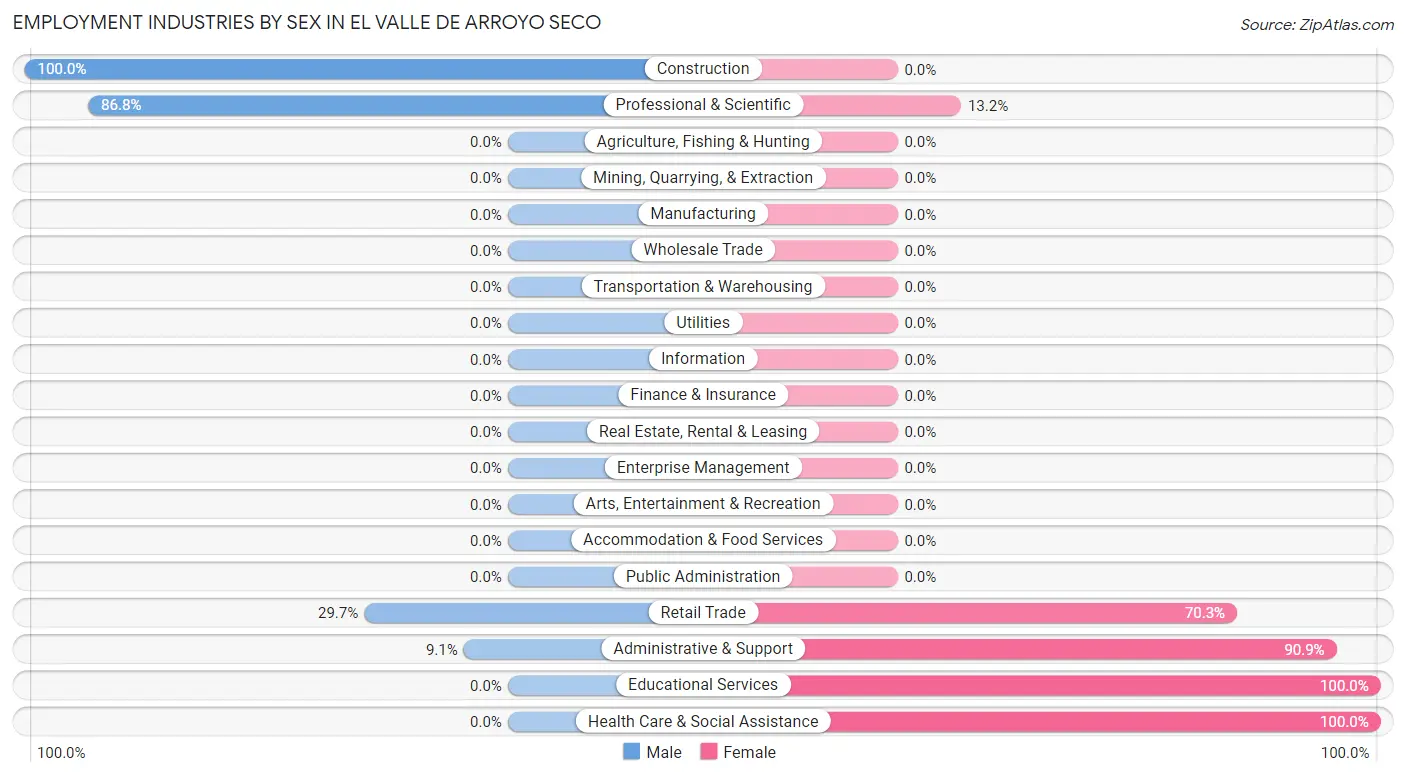
The El Valle de Arroyo Seco industries that see more men than women are Construction (100.0%), Professional & Scientific (86.8%), and Retail Trade (29.7%), whereas the industries that tend to have a higher number of women are Educational Services (100.0%), Health Care & Social Assistance (100.0%), and Administrative & Support (90.9%).
| Industry | Male | Female |
| Agriculture, Fishing & Hunting | 0 (0.0%) | 0 (0.0%) |
| Mining, Quarrying, & Extraction | 0 (0.0%) | 0 (0.0%) |
| Construction | 186 (100.0%) | 0 (0.0%) |
| Manufacturing | 0 (0.0%) | 0 (0.0%) |
| Wholesale Trade | 0 (0.0%) | 0 (0.0%) |
| Retail Trade | 33 (29.7%) | 78 (70.3%) |
| Transportation & Warehousing | 0 (0.0%) | 0 (0.0%) |
| Utilities | 0 (0.0%) | 0 (0.0%) |
| Information | 0 (0.0%) | 0 (0.0%) |
| Finance & Insurance | 0 (0.0%) | 0 (0.0%) |
| Real Estate, Rental & Leasing | 0 (0.0%) | 0 (0.0%) |
| Professional & Scientific | 99 (86.8%) | 15 (13.2%) |
| Enterprise Management | 0 (0.0%) | 0 (0.0%) |
| Administrative & Support | 16 (9.1%) | 159 (90.9%) |
| Educational Services | 0 (0.0%) | 20 (100.0%) |
| Health Care & Social Assistance | 0 (0.0%) | 161 (100.0%) |
| Arts, Entertainment & Recreation | 0 (0.0%) | 0 (0.0%) |
| Accommodation & Food Services | 0 (0.0%) | 0 (0.0%) |
| Public Administration | 0 (0.0%) | 0 (0.0%) |
| Total | 334 (43.5%) | 433 (56.5%) |
Education in El Valle de Arroyo Seco
School Enrollment in El Valle de Arroyo Seco
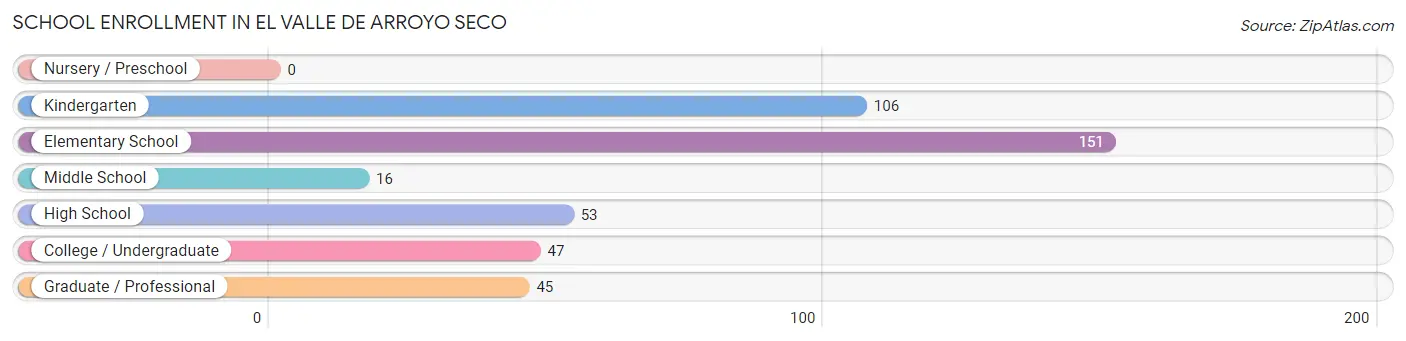
The most common levels of schooling among the 418 students in El Valle de Arroyo Seco are elementary school (151 | 36.1%), kindergarten (106 | 25.4%), and high school (53 | 12.7%).
| School Level | # Students | % Students |
| Nursery / Preschool | 0 | 0.0% |
| Kindergarten | 106 | 25.4% |
| Elementary School | 151 | 36.1% |
| Middle School | 16 | 3.8% |
| High School | 53 | 12.7% |
| College / Undergraduate | 47 | 11.2% |
| Graduate / Professional | 45 | 10.8% |
| Total | 418 | 100.0% |
School Enrollment by Age by Funding Source in El Valle de Arroyo Seco
| Age Bracket | Public School | Private School |
| 3 to 4 Year Olds | 0 (0.0%) | 0 (0.0%) |
| 5 to 9 Year Old | 257 (100.0%) | 0 (0.0%) |
| 10 to 14 Year Olds | 16 (100.0%) | 0 (0.0%) |
| 15 to 17 Year Olds | 67 (100.0%) | 0 (0.0%) |
| 18 to 19 Year Olds | 0 (0.0%) | 0 (0.0%) |
| 20 to 24 Year Olds | 0 (0.0%) | 0 (0.0%) |
| 25 to 34 Year Olds | 33 (100.0%) | 0 (0.0%) |
| 35 Years and over | 45 (100.0%) | 0 (0.0%) |
| Total | 418 (100.0%) | 0 (0.0%) |
Educational Attainment by Field of Study in El Valle de Arroyo Seco
Education (109 | 42.6%), computers & mathematics (55 | 21.5%), engineering (45 | 17.6%), business (31 | 12.1%), and psychology (16 | 6.2%) are the most common fields of study among 256 individuals in El Valle de Arroyo Seco who have obtained a bachelor's degree or higher.
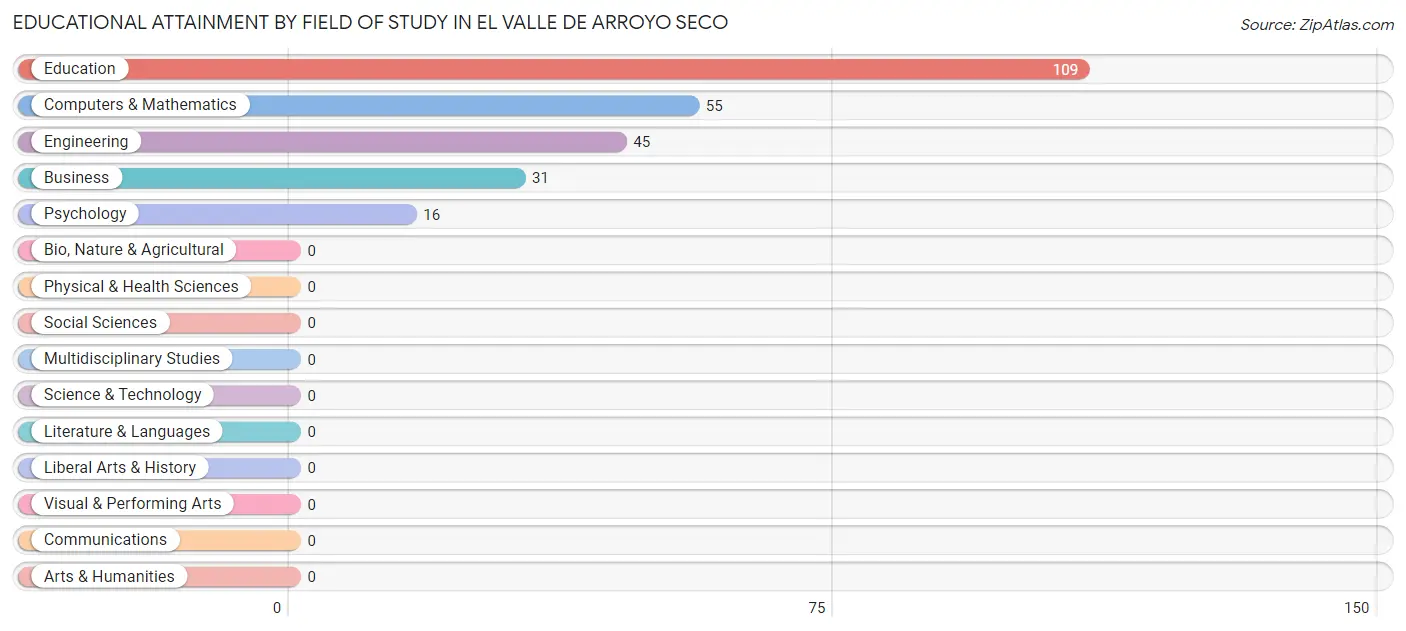
| Field of Study | # Graduates | % Graduates |
| Computers & Mathematics | 55 | 21.5% |
| Bio, Nature & Agricultural | 0 | 0.0% |
| Physical & Health Sciences | 0 | 0.0% |
| Psychology | 16 | 6.2% |
| Social Sciences | 0 | 0.0% |
| Engineering | 45 | 17.6% |
| Multidisciplinary Studies | 0 | 0.0% |
| Science & Technology | 0 | 0.0% |
| Business | 31 | 12.1% |
| Education | 109 | 42.6% |
| Literature & Languages | 0 | 0.0% |
| Liberal Arts & History | 0 | 0.0% |
| Visual & Performing Arts | 0 | 0.0% |
| Communications | 0 | 0.0% |
| Arts & Humanities | 0 | 0.0% |
| Total | 256 | 100.0% |
Transportation & Commute in El Valle de Arroyo Seco
Vehicle Availability by Sex in El Valle de Arroyo Seco
The most prevalent vehicle ownership categories in El Valle de Arroyo Seco are males with 2 vehicles (181, accounting for 54.2%) and females with 2 vehicles (351, making up 41.8%).
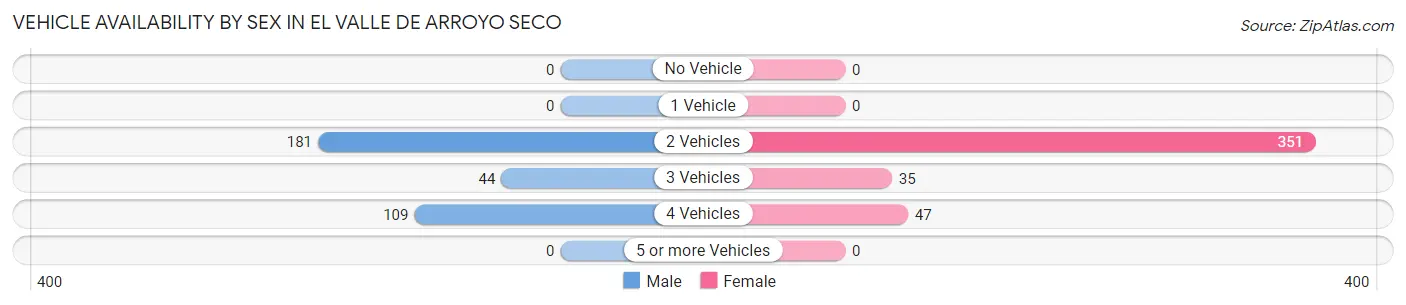
| Vehicles Available | Male | Female |
| No Vehicle | 0 (0.0%) | 0 (0.0%) |
| 1 Vehicle | 0 (0.0%) | 0 (0.0%) |
| 2 Vehicles | 181 (54.2%) | 351 (81.1%) |
| 3 Vehicles | 44 (13.2%) | 35 (8.1%) |
| 4 Vehicles | 109 (32.6%) | 47 (10.8%) |
| 5 or more Vehicles | 0 (0.0%) | 0 (0.0%) |
| Total | 334 (100.0%) | 433 (100.0%) |
Commute Time in El Valle de Arroyo Seco
The most frequently occuring commute durations in El Valle de Arroyo Seco are 35 to 39 minutes (145 commuters, 23.1%), 20 to 24 minutes (128 commuters, 20.4%), and 30 to 34 minutes (87 commuters, 13.9%).
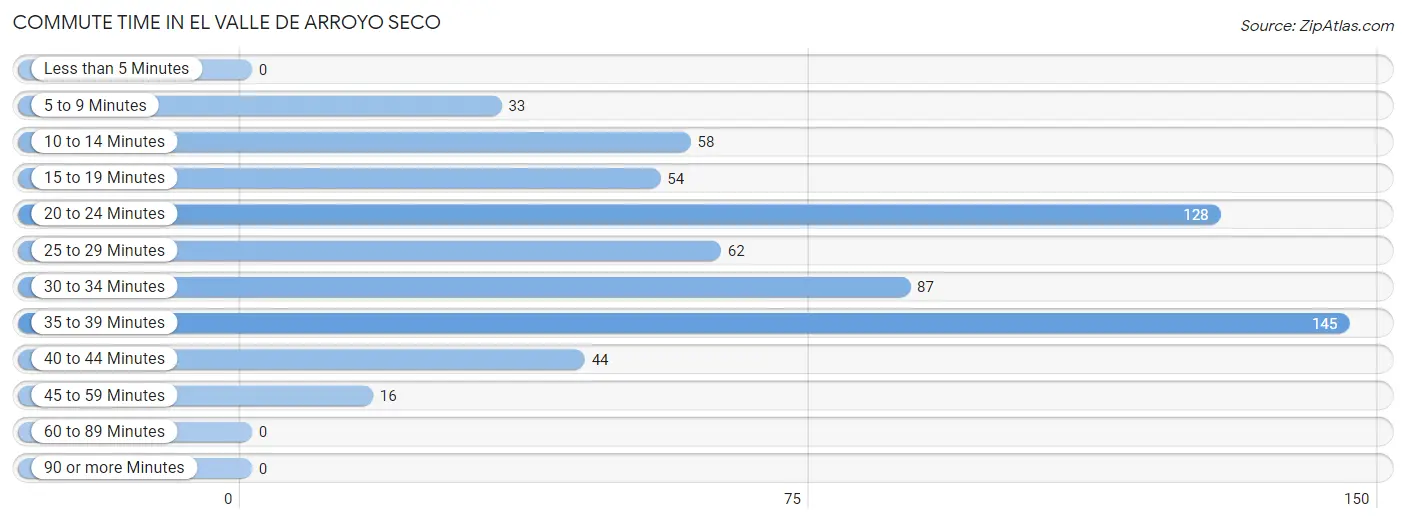
| Commute Time | # Commuters | % Commuters |
| Less than 5 Minutes | 0 | 0.0% |
| 5 to 9 Minutes | 33 | 5.3% |
| 10 to 14 Minutes | 58 | 9.2% |
| 15 to 19 Minutes | 54 | 8.6% |
| 20 to 24 Minutes | 128 | 20.4% |
| 25 to 29 Minutes | 62 | 9.9% |
| 30 to 34 Minutes | 87 | 13.9% |
| 35 to 39 Minutes | 145 | 23.1% |
| 40 to 44 Minutes | 44 | 7.0% |
| 45 to 59 Minutes | 16 | 2.5% |
| 60 to 89 Minutes | 0 | 0.0% |
| 90 or more Minutes | 0 | 0.0% |
Commute Time by Sex in El Valle de Arroyo Seco
The most common commute times in El Valle de Arroyo Seco are 20 to 24 minutes (77 commuters, 32.0%) for males and 35 to 39 minutes (145 commuters, 37.6%) for females.
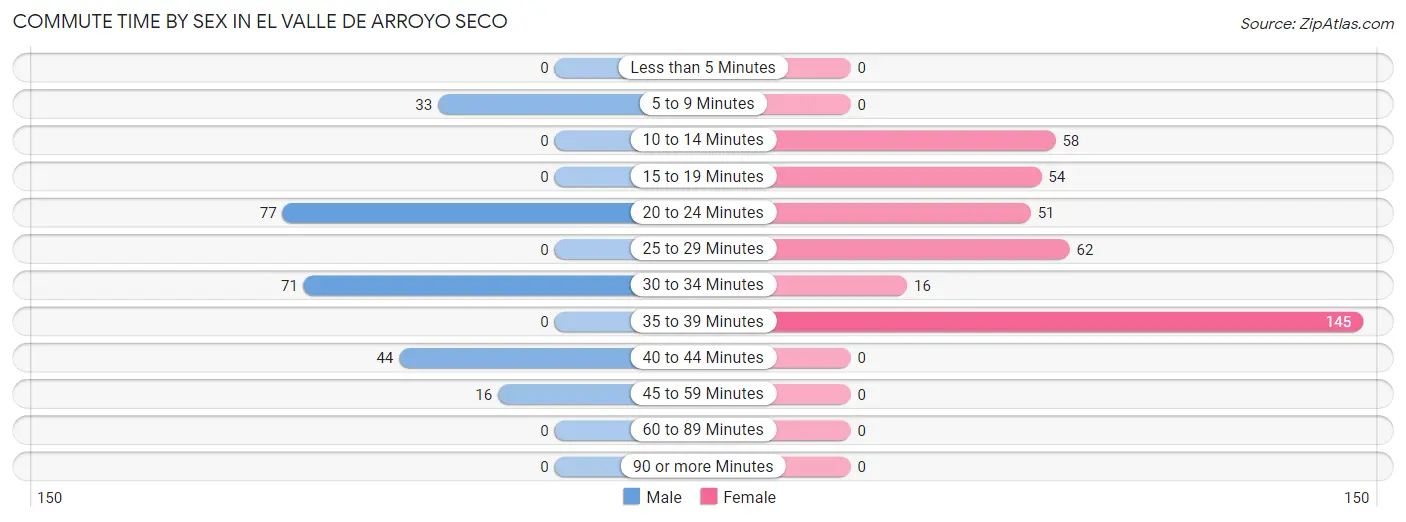
| Commute Time | Male | Female |
| Less than 5 Minutes | 0 (0.0%) | 0 (0.0%) |
| 5 to 9 Minutes | 33 (13.7%) | 0 (0.0%) |
| 10 to 14 Minutes | 0 (0.0%) | 58 (15.0%) |
| 15 to 19 Minutes | 0 (0.0%) | 54 (14.0%) |
| 20 to 24 Minutes | 77 (32.0%) | 51 (13.2%) |
| 25 to 29 Minutes | 0 (0.0%) | 62 (16.1%) |
| 30 to 34 Minutes | 71 (29.5%) | 16 (4.2%) |
| 35 to 39 Minutes | 0 (0.0%) | 145 (37.6%) |
| 40 to 44 Minutes | 44 (18.3%) | 0 (0.0%) |
| 45 to 59 Minutes | 16 (6.6%) | 0 (0.0%) |
| 60 to 89 Minutes | 0 (0.0%) | 0 (0.0%) |
| 90 or more Minutes | 0 (0.0%) | 0 (0.0%) |
Time of Departure to Work by Sex in El Valle de Arroyo Seco
The most frequent times of departure to work in El Valle de Arroyo Seco are 8:00 AM to 8:29 AM (144, 59.8%) for males and 7:30 AM to 7:59 AM (239, 61.9%) for females.
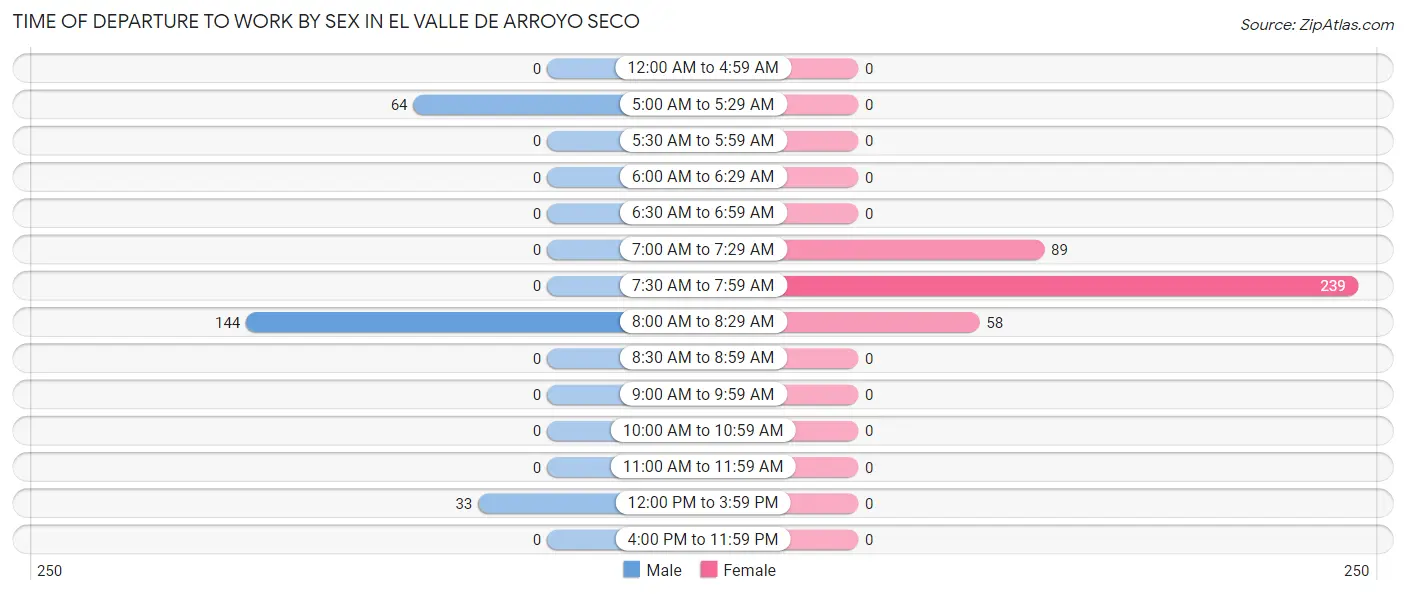
| Time of Departure | Male | Female |
| 12:00 AM to 4:59 AM | 0 (0.0%) | 0 (0.0%) |
| 5:00 AM to 5:29 AM | 64 (26.6%) | 0 (0.0%) |
| 5:30 AM to 5:59 AM | 0 (0.0%) | 0 (0.0%) |
| 6:00 AM to 6:29 AM | 0 (0.0%) | 0 (0.0%) |
| 6:30 AM to 6:59 AM | 0 (0.0%) | 0 (0.0%) |
| 7:00 AM to 7:29 AM | 0 (0.0%) | 89 (23.1%) |
| 7:30 AM to 7:59 AM | 0 (0.0%) | 239 (61.9%) |
| 8:00 AM to 8:29 AM | 144 (59.8%) | 58 (15.0%) |
| 8:30 AM to 8:59 AM | 0 (0.0%) | 0 (0.0%) |
| 9:00 AM to 9:59 AM | 0 (0.0%) | 0 (0.0%) |
| 10:00 AM to 10:59 AM | 0 (0.0%) | 0 (0.0%) |
| 11:00 AM to 11:59 AM | 0 (0.0%) | 0 (0.0%) |
| 12:00 PM to 3:59 PM | 33 (13.7%) | 0 (0.0%) |
| 4:00 PM to 11:59 PM | 0 (0.0%) | 0 (0.0%) |
| Total | 241 (100.0%) | 386 (100.0%) |
Housing Occupancy in El Valle de Arroyo Seco
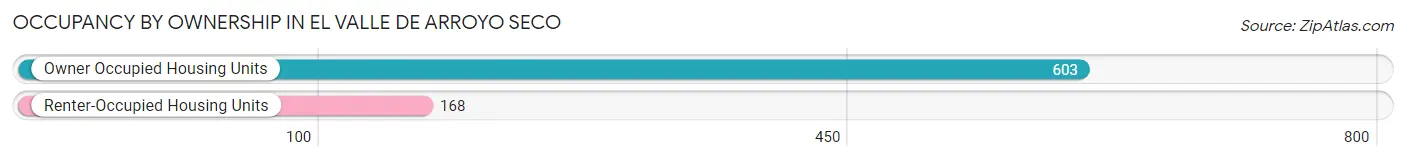
Occupancy by Ownership in El Valle de Arroyo Seco
Of the total 771 dwellings in El Valle de Arroyo Seco, owner-occupied units account for 603 (78.2%), while renter-occupied units make up 168 (21.8%).
| Occupancy | # Housing Units | % Housing Units |
| Owner Occupied Housing Units | 603 | 78.2% |
| Renter-Occupied Housing Units | 168 | 21.8% |
| Total Occupied Housing Units | 771 | 100.0% |
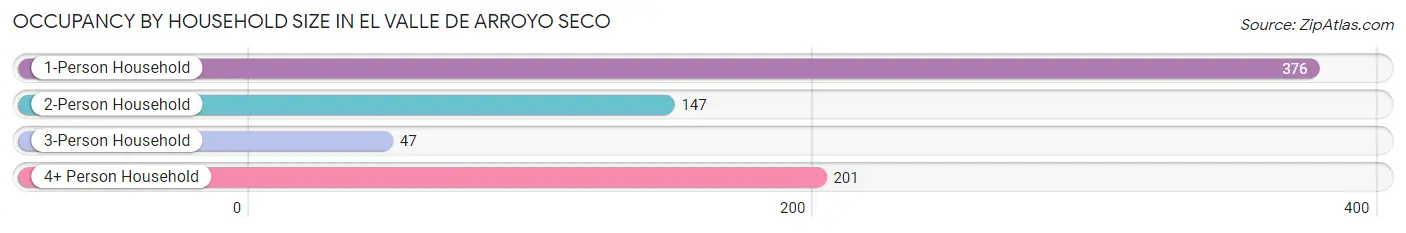
Occupancy by Household Size in El Valle de Arroyo Seco
| Household Size | # Housing Units | % Housing Units |
| 1-Person Household | 376 | 48.8% |
| 2-Person Household | 147 | 19.1% |
| 3-Person Household | 47 | 6.1% |
| 4+ Person Household | 201 | 26.1% |
| Total Housing Units | 771 | 100.0% |
Occupancy by Ownership by Household Size in El Valle de Arroyo Seco
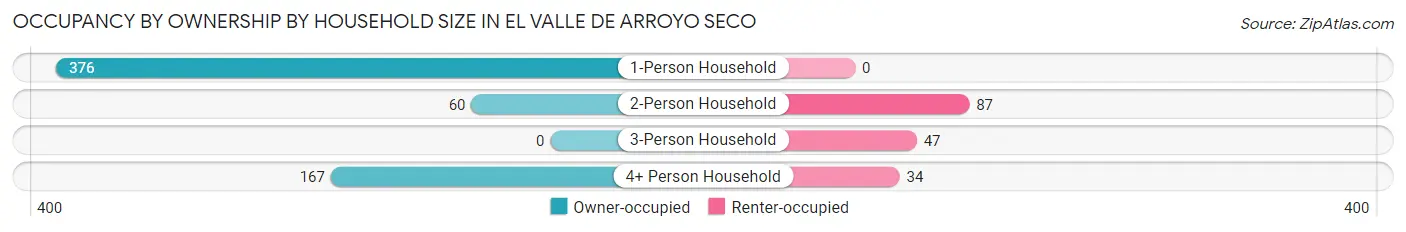
| Household Size | Owner-occupied | Renter-occupied |
| 1-Person Household | 376 (100.0%) | 0 (0.0%) |
| 2-Person Household | 60 (40.8%) | 87 (59.2%) |
| 3-Person Household | 0 (0.0%) | 47 (100.0%) |
| 4+ Person Household | 167 (83.1%) | 34 (16.9%) |
| Total Housing Units | 603 (78.2%) | 168 (21.8%) |
Occupancy by Educational Attainment in El Valle de Arroyo Seco
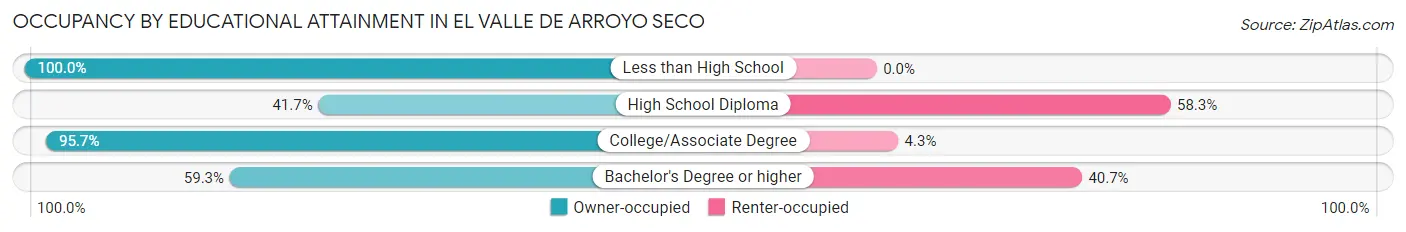
| Household Size | Owner-occupied | Renter-occupied |
| Less than High School | 61 (100.0%) | 0 (0.0%) |
| High School Diploma | 58 (41.7%) | 81 (58.3%) |
| College/Associate Degree | 382 (95.7%) | 17 (4.3%) |
| Bachelor's Degree or higher | 102 (59.3%) | 70 (40.7%) |
Occupancy by Age of Householder in El Valle de Arroyo Seco

| Age Bracket | # Households | % Households |
| Under 35 Years | 57 | 7.4% |
| 35 to 44 Years | 214 | 27.8% |
| 45 to 54 Years | 189 | 24.5% |
| 55 to 64 Years | 17 | 2.2% |
| 65 to 74 Years | 152 | 19.7% |
| 75 to 84 Years | 142 | 18.4% |
| 85 Years and Over | 0 | 0.0% |
| Total | 771 | 100.0% |
Housing Finances in El Valle de Arroyo Seco
Median Income by Occupancy in El Valle de Arroyo Seco
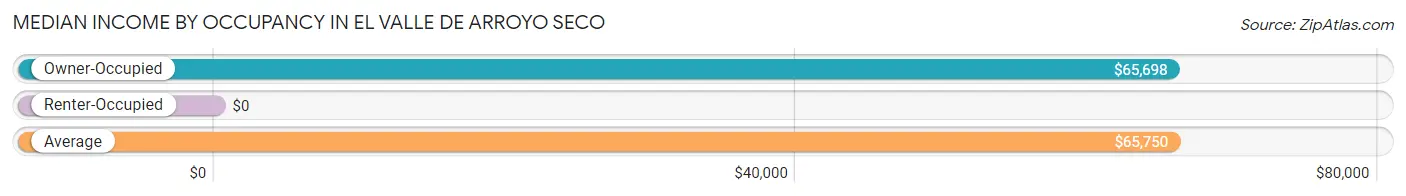
| Occupancy Type | # Households | Median Income |
| Owner-Occupied | 603 (78.2%) | $65,698 |
| Renter-Occupied | 168 (21.8%) | $0 |
| Average | 771 (100.0%) | $65,750 |
Occupancy by Householder Income Bracket in El Valle de Arroyo Seco
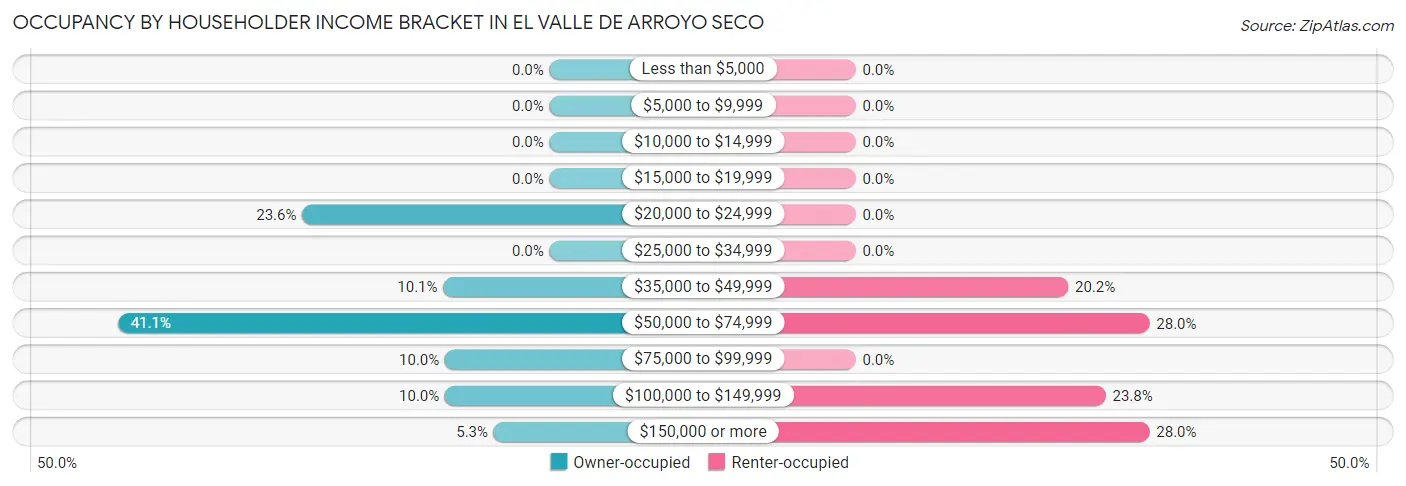
| Income Bracket | Owner-occupied | Renter-occupied |
| Less than $5,000 | 0 (0.0%) | 0 (0.0%) |
| $5,000 to $9,999 | 0 (0.0%) | 0 (0.0%) |
| $10,000 to $14,999 | 0 (0.0%) | 0 (0.0%) |
| $15,000 to $19,999 | 0 (0.0%) | 0 (0.0%) |
| $20,000 to $24,999 | 142 (23.5%) | 0 (0.0%) |
| $25,000 to $34,999 | 0 (0.0%) | 0 (0.0%) |
| $35,000 to $49,999 | 61 (10.1%) | 34 (20.2%) |
| $50,000 to $74,999 | 248 (41.1%) | 47 (28.0%) |
| $75,000 to $99,999 | 60 (10.0%) | 0 (0.0%) |
| $100,000 to $149,999 | 60 (10.0%) | 40 (23.8%) |
| $150,000 or more | 32 (5.3%) | 47 (28.0%) |
| Total | 603 (100.0%) | 168 (100.0%) |
Monthly Housing Cost Tiers in El Valle de Arroyo Seco
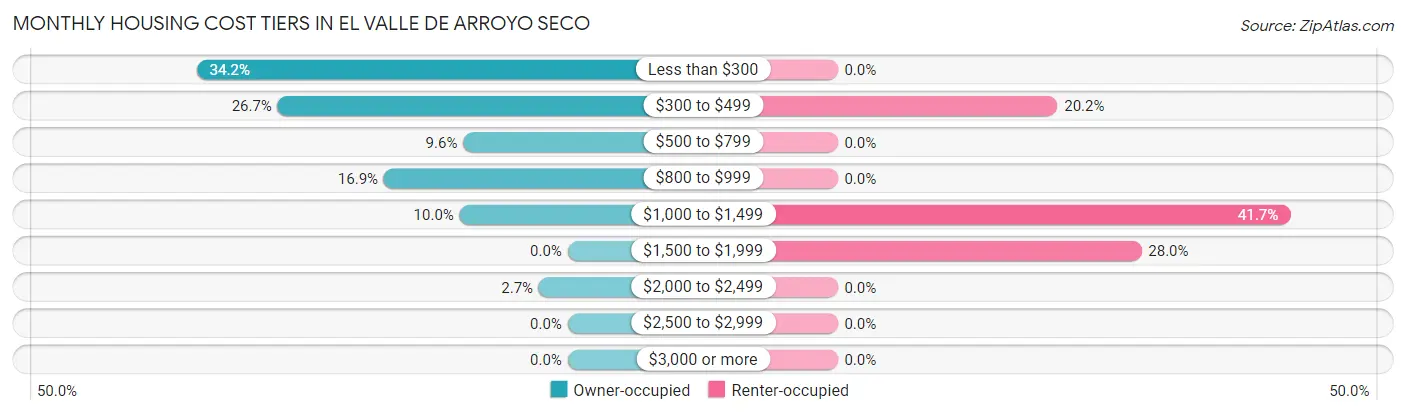
| Monthly Cost | Owner-occupied | Renter-occupied |
| Less than $300 | 206 (34.2%) | 0 (0.0%) |
| $300 to $499 | 161 (26.7%) | 34 (20.2%) |
| $500 to $799 | 58 (9.6%) | 0 (0.0%) |
| $800 to $999 | 102 (16.9%) | 0 (0.0%) |
| $1,000 to $1,499 | 60 (10.0%) | 70 (41.7%) |
| $1,500 to $1,999 | 0 (0.0%) | 47 (28.0%) |
| $2,000 to $2,499 | 16 (2.6%) | 0 (0.0%) |
| $2,500 to $2,999 | 0 (0.0%) | 0 (0.0%) |
| $3,000 or more | 0 (0.0%) | 0 (0.0%) |
| Total | 603 (100.0%) | 168 (100.0%) |
Physical Housing Characteristics in El Valle de Arroyo Seco
Housing Structures in El Valle de Arroyo Seco
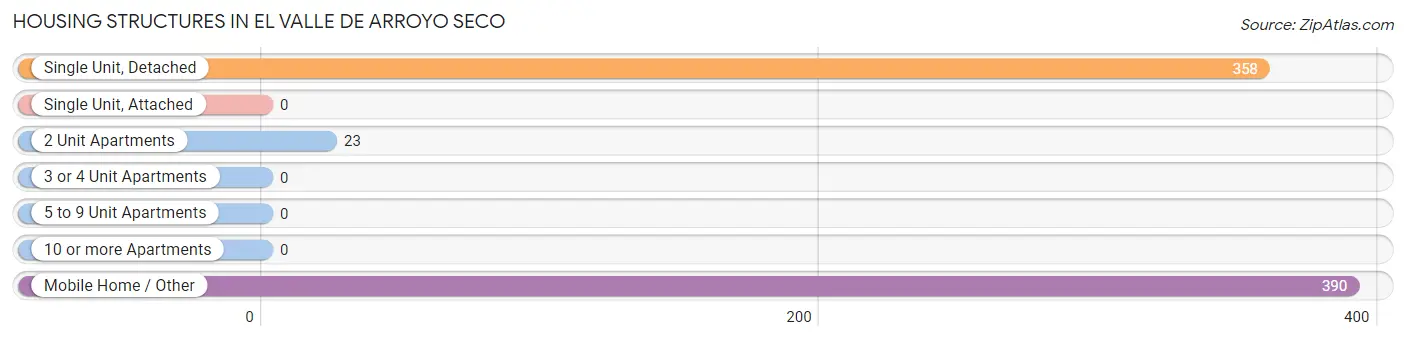
| Structure Type | # Housing Units | % Housing Units |
| Single Unit, Detached | 358 | 46.4% |
| Single Unit, Attached | 0 | 0.0% |
| 2 Unit Apartments | 23 | 3.0% |
| 3 or 4 Unit Apartments | 0 | 0.0% |
| 5 to 9 Unit Apartments | 0 | 0.0% |
| 10 or more Apartments | 0 | 0.0% |
| Mobile Home / Other | 390 | 50.6% |
| Total | 771 | 100.0% |
Housing Structures by Occupancy in El Valle de Arroyo Seco
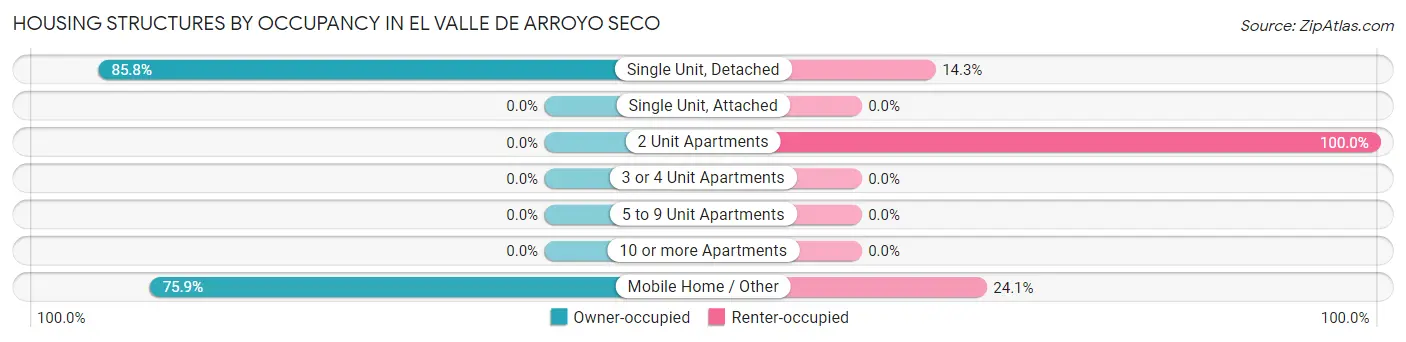
| Structure Type | Owner-occupied | Renter-occupied |
| Single Unit, Detached | 307 (85.8%) | 51 (14.2%) |
| Single Unit, Attached | 0 (0.0%) | 0 (0.0%) |
| 2 Unit Apartments | 0 (0.0%) | 23 (100.0%) |
| 3 or 4 Unit Apartments | 0 (0.0%) | 0 (0.0%) |
| 5 to 9 Unit Apartments | 0 (0.0%) | 0 (0.0%) |
| 10 or more Apartments | 0 (0.0%) | 0 (0.0%) |
| Mobile Home / Other | 296 (75.9%) | 94 (24.1%) |
| Total | 603 (78.2%) | 168 (21.8%) |
Housing Structures by Number of Rooms in El Valle de Arroyo Seco
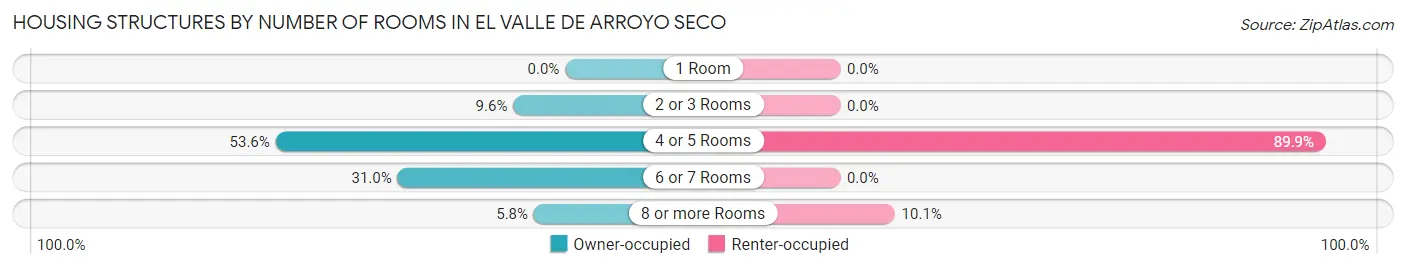
| Number of Rooms | Owner-occupied | Renter-occupied |
| 1 Room | 0 (0.0%) | 0 (0.0%) |
| 2 or 3 Rooms | 58 (9.6%) | 0 (0.0%) |
| 4 or 5 Rooms | 323 (53.6%) | 151 (89.9%) |
| 6 or 7 Rooms | 187 (31.0%) | 0 (0.0%) |
| 8 or more Rooms | 35 (5.8%) | 17 (10.1%) |
| Total | 603 (100.0%) | 168 (100.0%) |
Housing Structure by Heating Type in El Valle de Arroyo Seco
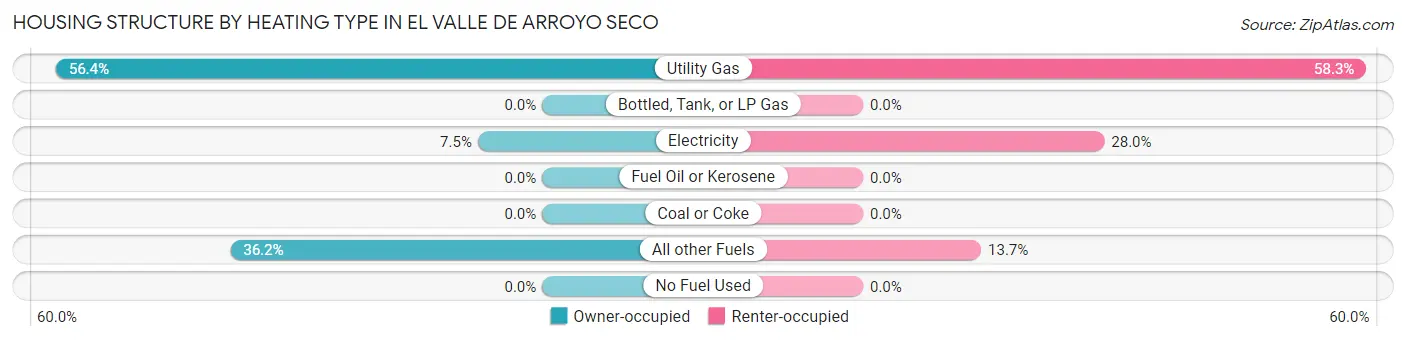
| Heating Type | Owner-occupied | Renter-occupied |
| Utility Gas | 340 (56.4%) | 98 (58.3%) |
| Bottled, Tank, or LP Gas | 0 (0.0%) | 0 (0.0%) |
| Electricity | 45 (7.5%) | 47 (28.0%) |
| Fuel Oil or Kerosene | 0 (0.0%) | 0 (0.0%) |
| Coal or Coke | 0 (0.0%) | 0 (0.0%) |
| All other Fuels | 218 (36.1%) | 23 (13.7%) |
| No Fuel Used | 0 (0.0%) | 0 (0.0%) |
| Total | 603 (100.0%) | 168 (100.0%) |
Household Vehicle Usage in El Valle de Arroyo Seco
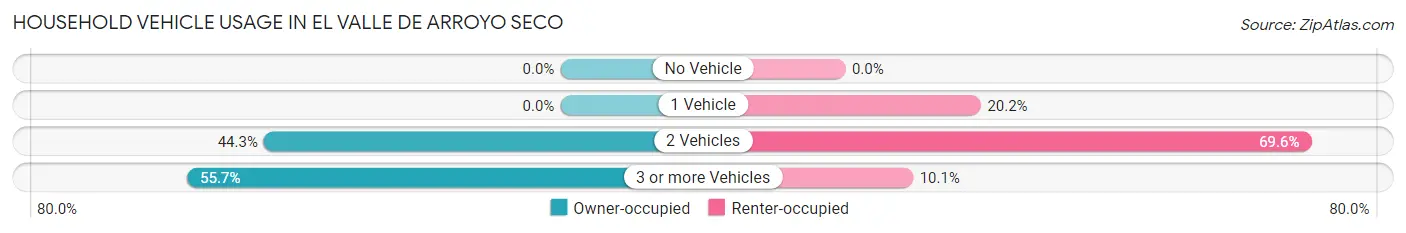
| Vehicles per Household | Owner-occupied | Renter-occupied |
| No Vehicle | 0 (0.0%) | 0 (0.0%) |
| 1 Vehicle | 0 (0.0%) | 34 (20.2%) |
| 2 Vehicles | 267 (44.3%) | 117 (69.6%) |
| 3 or more Vehicles | 336 (55.7%) | 17 (10.1%) |
| Total | 603 (100.0%) | 168 (100.0%) |
Real Estate & Mortgages in El Valle de Arroyo Seco
Real Estate and Mortgage Overview in El Valle de Arroyo Seco
| Characteristic | Without Mortgage | With Mortgage |
| Housing Units | 425 | 178 |
| Median Property Value | - | - |
| Median Household Income | $50,409 | $32 |
| Monthly Housing Costs | $302 | $0 |
| Real Estate Taxes | - | - |
Property Value by Mortgage Status in El Valle de Arroyo Seco
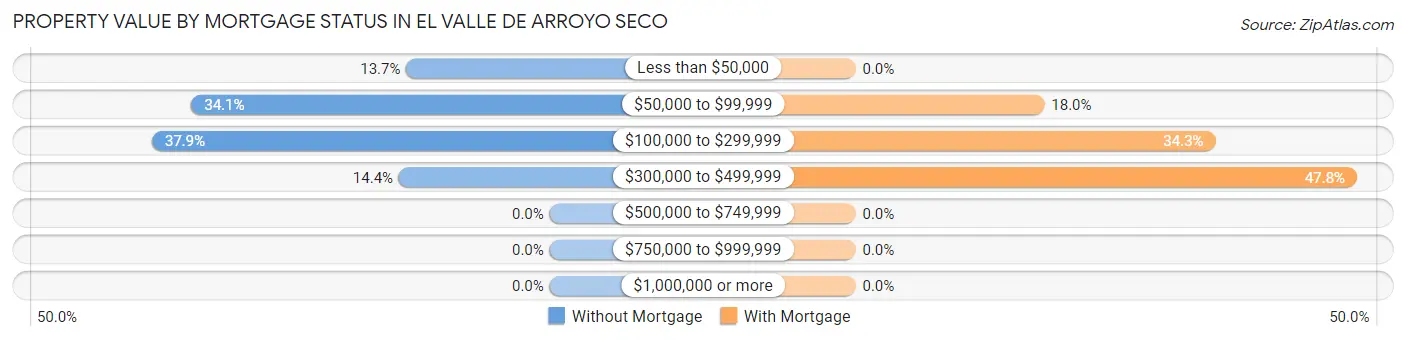
| Property Value | Without Mortgage | With Mortgage |
| Less than $50,000 | 58 (13.7%) | 0 (0.0%) |
| $50,000 to $99,999 | 145 (34.1%) | 32 (18.0%) |
| $100,000 to $299,999 | 161 (37.9%) | 61 (34.3%) |
| $300,000 to $499,999 | 61 (14.3%) | 85 (47.7%) |
| $500,000 to $749,999 | 0 (0.0%) | 0 (0.0%) |
| $750,000 to $999,999 | 0 (0.0%) | 0 (0.0%) |
| $1,000,000 or more | 0 (0.0%) | 0 (0.0%) |
| Total | 425 (100.0%) | 178 (100.0%) |
Household Income by Mortgage Status in El Valle de Arroyo Seco
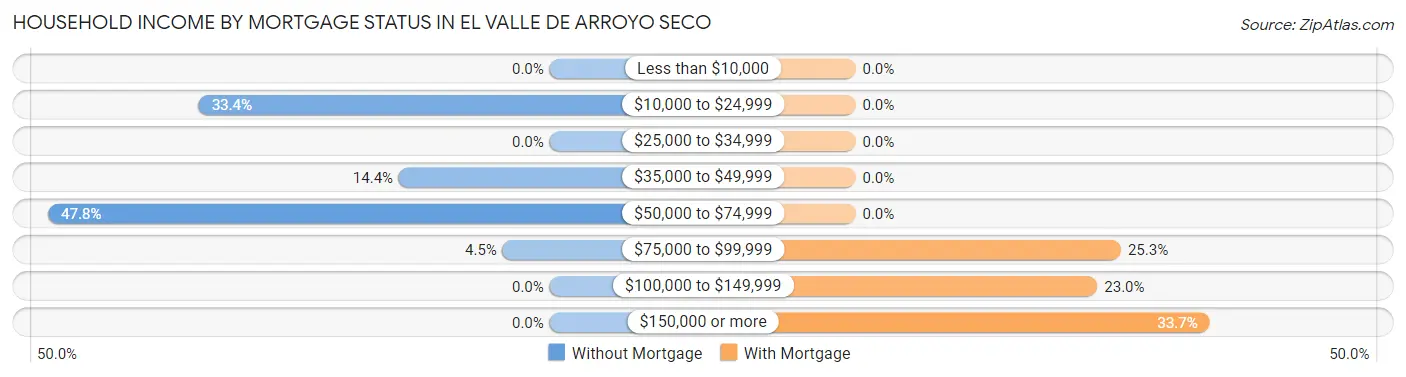
| Household Income | Without Mortgage | With Mortgage |
| Less than $10,000 | 0 (0.0%) | 0 (0.0%) |
| $10,000 to $24,999 | 142 (33.4%) | 0 (0.0%) |
| $25,000 to $34,999 | 0 (0.0%) | 0 (0.0%) |
| $35,000 to $49,999 | 61 (14.3%) | 0 (0.0%) |
| $50,000 to $74,999 | 203 (47.8%) | 0 (0.0%) |
| $75,000 to $99,999 | 19 (4.5%) | 45 (25.3%) |
| $100,000 to $149,999 | 0 (0.0%) | 41 (23.0%) |
| $150,000 or more | 0 (0.0%) | 60 (33.7%) |
| Total | 425 (100.0%) | 178 (100.0%) |
Property Value to Household Income Ratio in El Valle de Arroyo Seco
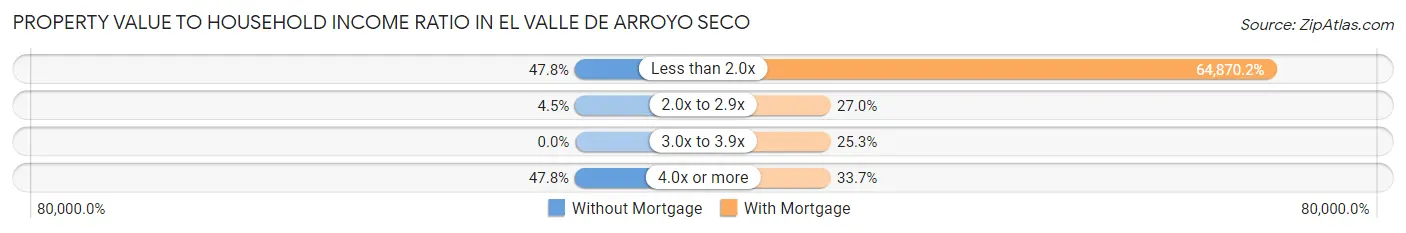
| Value-to-Income Ratio | Without Mortgage | With Mortgage |
| Less than 2.0x | 203 (47.8%) | 115,469 (64,870.2%) |
| 2.0x to 2.9x | 19 (4.5%) | 48 (27.0%) |
| 3.0x to 3.9x | 0 (0.0%) | 45 (25.3%) |
| 4.0x or more | 203 (47.8%) | 60 (33.7%) |
| Total | 425 (100.0%) | 178 (100.0%) |
Real Estate Taxes by Mortgage Status in El Valle de Arroyo Seco
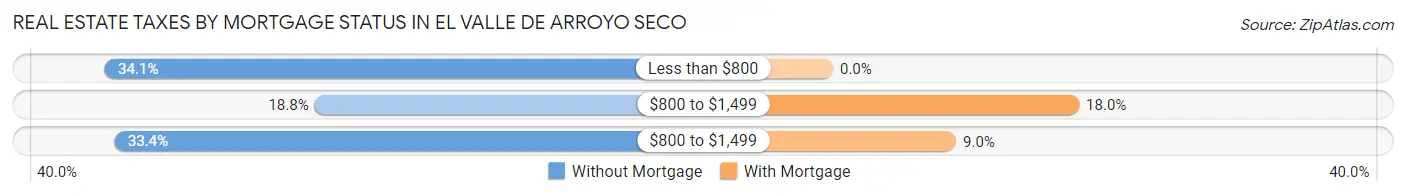
| Property Taxes | Without Mortgage | With Mortgage |
| Less than $800 | 145 (34.1%) | 0 (0.0%) |
| $800 to $1,499 | 80 (18.8%) | 32 (18.0%) |
| $800 to $1,499 | 142 (33.4%) | 16 (9.0%) |
| Total | 425 (100.0%) | 178 (100.0%) |
Health & Disability in El Valle de Arroyo Seco
Health Insurance Coverage by Age in El Valle de Arroyo Seco
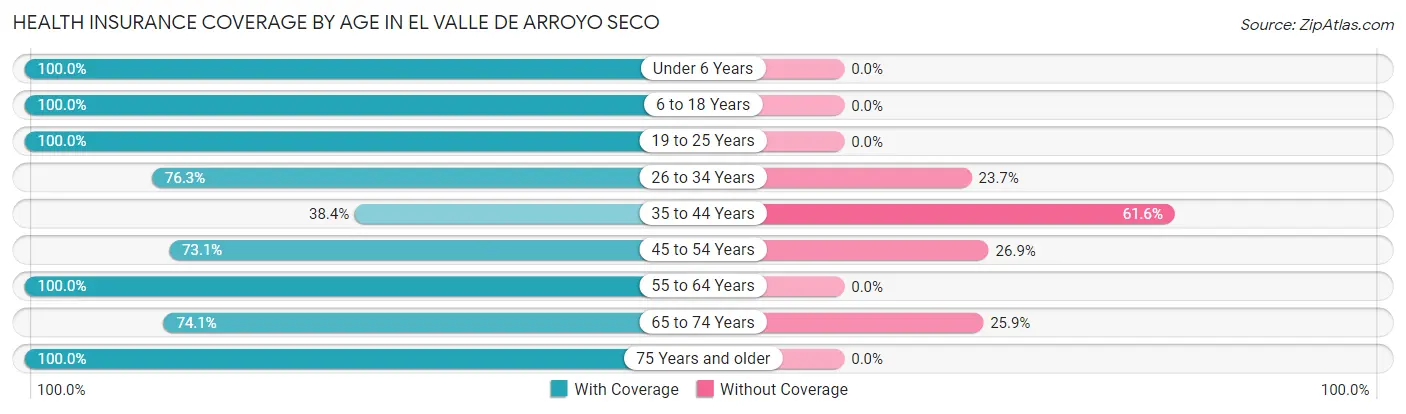
| Age Bracket | With Coverage | Without Coverage |
| Under 6 Years | 151 (100.0%) | 0 (0.0%) |
| 6 to 18 Years | 234 (100.0%) | 0 (0.0%) |
| 19 to 25 Years | 139 (100.0%) | 0 (0.0%) |
| 26 to 34 Years | 106 (76.3%) | 33 (23.7%) |
| 35 to 44 Years | 142 (38.4%) | 228 (61.6%) |
| 45 to 54 Years | 209 (73.1%) | 77 (26.9%) |
| 55 to 64 Years | 32 (100.0%) | 0 (0.0%) |
| 65 to 74 Years | 186 (74.1%) | 65 (25.9%) |
| 75 Years and older | 142 (100.0%) | 0 (0.0%) |
| Total | 1,341 (76.9%) | 403 (23.1%) |
Health Insurance Coverage by Citizenship Status in El Valle de Arroyo Seco
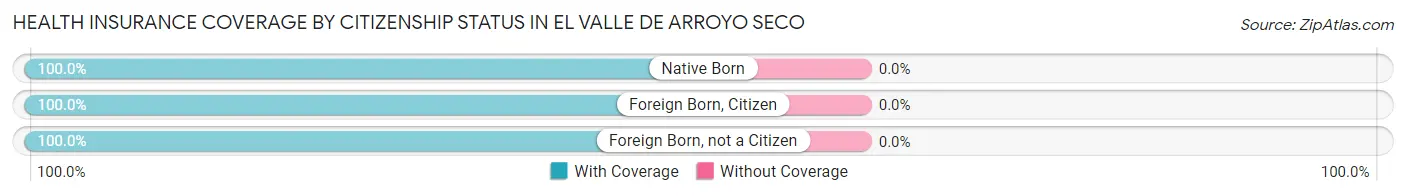
| Citizenship Status | With Coverage | Without Coverage |
| Native Born | 151 (100.0%) | 0 (0.0%) |
| Foreign Born, Citizen | 234 (100.0%) | 0 (0.0%) |
| Foreign Born, not a Citizen | 139 (100.0%) | 0 (0.0%) |
Health Insurance Coverage by Household Income in El Valle de Arroyo Seco
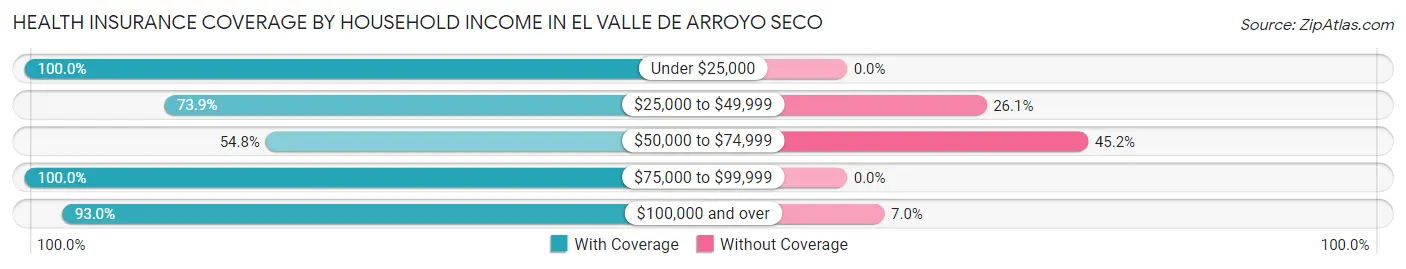
| Household Income | With Coverage | Without Coverage |
| Under $25,000 | 142 (100.0%) | 0 (0.0%) |
| $25,000 to $49,999 | 345 (73.9%) | 122 (26.1%) |
| $50,000 to $74,999 | 301 (54.8%) | 248 (45.2%) |
| $75,000 to $99,999 | 114 (100.0%) | 0 (0.0%) |
| $100,000 and over | 439 (93.0%) | 33 (7.0%) |
Public vs Private Health Insurance Coverage by Age in El Valle de Arroyo Seco
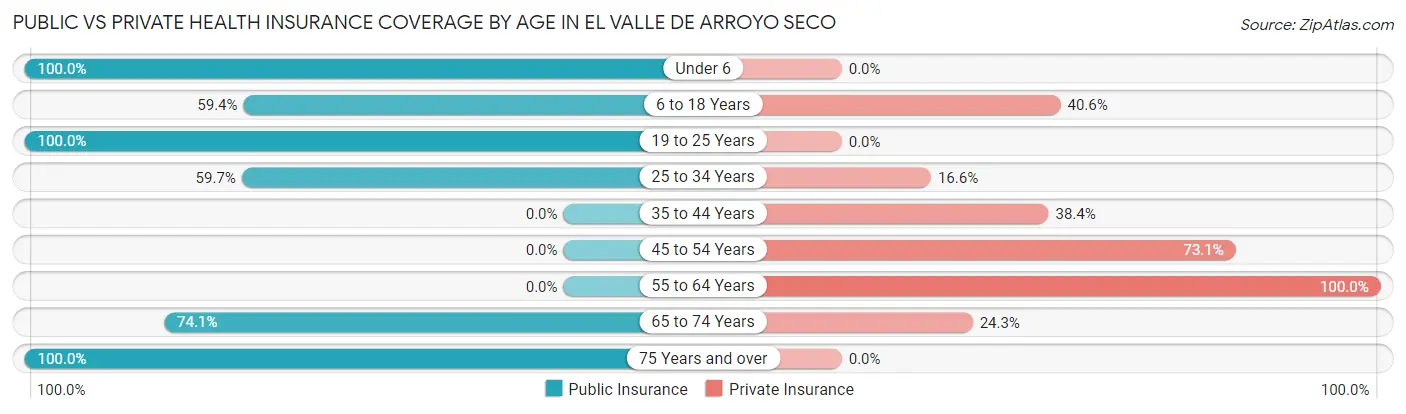
| Age Bracket | Public Insurance | Private Insurance |
| Under 6 | 151 (100.0%) | 0 (0.0%) |
| 6 to 18 Years | 139 (59.4%) | 95 (40.6%) |
| 19 to 25 Years | 139 (100.0%) | 0 (0.0%) |
| 25 to 34 Years | 83 (59.7%) | 23 (16.6%) |
| 35 to 44 Years | 0 (0.0%) | 142 (38.4%) |
| 45 to 54 Years | 0 (0.0%) | 209 (73.1%) |
| 55 to 64 Years | 0 (0.0%) | 32 (100.0%) |
| 65 to 74 Years | 186 (74.1%) | 61 (24.3%) |
| 75 Years and over | 142 (100.0%) | 0 (0.0%) |
| Total | 840 (48.2%) | 562 (32.2%) |
Disability Status by Sex by Age in El Valle de Arroyo Seco
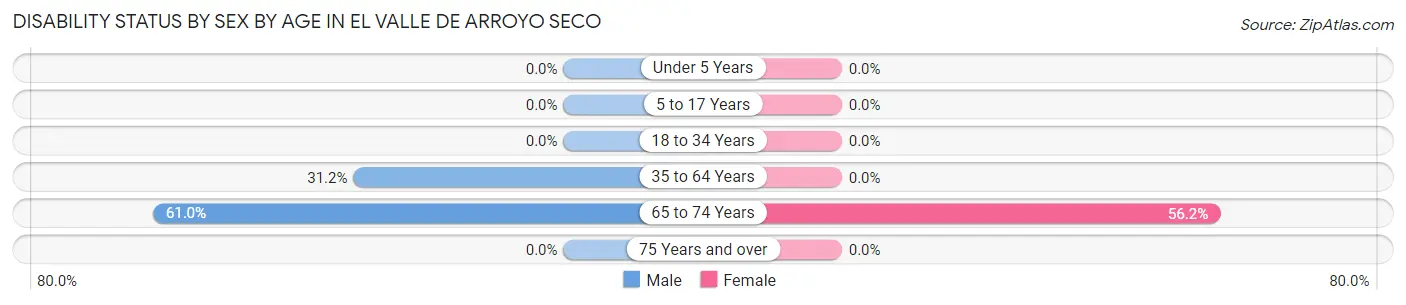
| Age Bracket | Male | Female |
| Under 5 Years | 0 (0.0%) | 0 (0.0%) |
| 5 to 17 Years | 0 (0.0%) | 0 (0.0%) |
| 18 to 34 Years | 0 (0.0%) | 0 (0.0%) |
| 35 to 64 Years | 92 (31.2%) | 0 (0.0%) |
| 65 to 74 Years | 64 (61.0%) | 82 (56.2%) |
| 75 Years and over | 0 (0.0%) | 0 (0.0%) |
Disability Class by Sex by Age in El Valle de Arroyo Seco
Disability Class: Hearing Difficulty
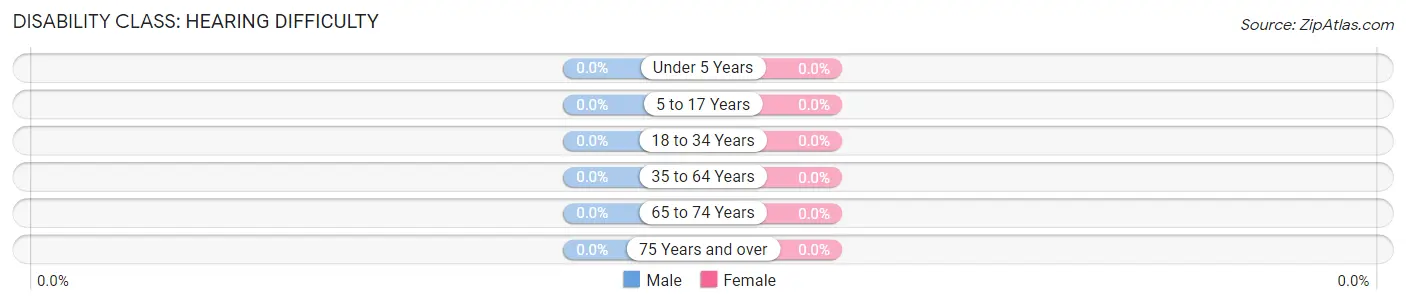
| Age Bracket | Male | Female |
| Under 5 Years | 0 (0.0%) | 0 (0.0%) |
| 5 to 17 Years | 0 (0.0%) | 0 (0.0%) |
| 18 to 34 Years | 0 (0.0%) | 0 (0.0%) |
| 35 to 64 Years | 0 (0.0%) | 0 (0.0%) |
| 65 to 74 Years | 0 (0.0%) | 0 (0.0%) |
| 75 Years and over | 0 (0.0%) | 0 (0.0%) |
Disability Class: Vision Difficulty
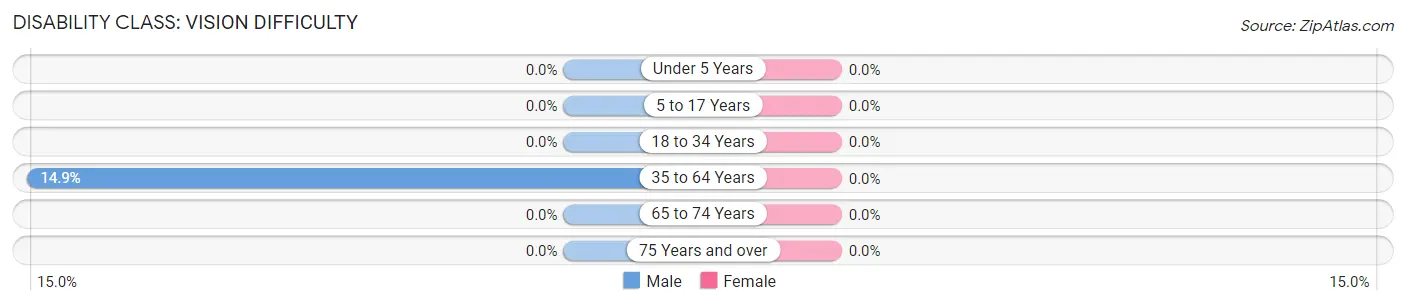
| Age Bracket | Male | Female |
| Under 5 Years | 0 (0.0%) | 0 (0.0%) |
| 5 to 17 Years | 0 (0.0%) | 0 (0.0%) |
| 18 to 34 Years | 0 (0.0%) | 0 (0.0%) |
| 35 to 64 Years | 44 (14.9%) | 0 (0.0%) |
| 65 to 74 Years | 0 (0.0%) | 0 (0.0%) |
| 75 Years and over | 0 (0.0%) | 0 (0.0%) |
Disability Class: Cognitive Difficulty
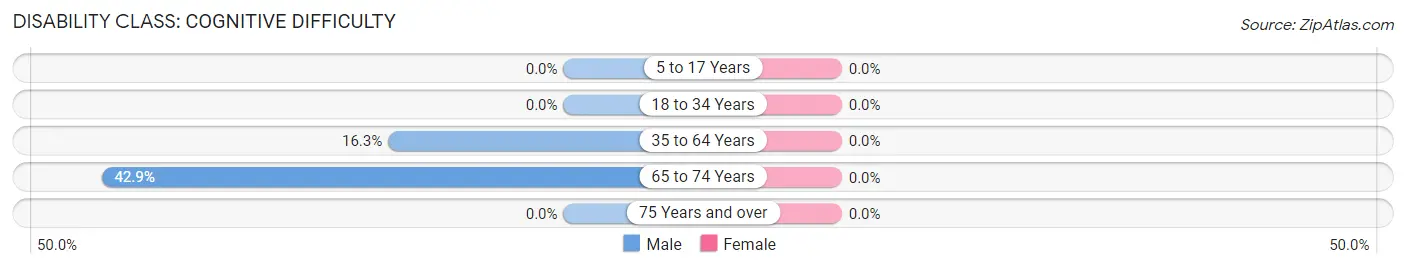
| Age Bracket | Male | Female |
| 5 to 17 Years | 0 (0.0%) | 0 (0.0%) |
| 18 to 34 Years | 0 (0.0%) | 0 (0.0%) |
| 35 to 64 Years | 48 (16.3%) | 0 (0.0%) |
| 65 to 74 Years | 45 (42.9%) | 0 (0.0%) |
| 75 Years and over | 0 (0.0%) | 0 (0.0%) |
Disability Class: Ambulatory Difficulty
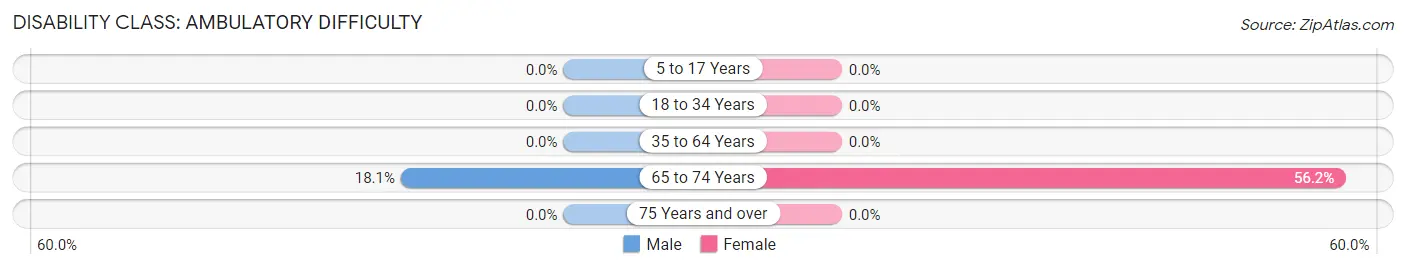
| Age Bracket | Male | Female |
| 5 to 17 Years | 0 (0.0%) | 0 (0.0%) |
| 18 to 34 Years | 0 (0.0%) | 0 (0.0%) |
| 35 to 64 Years | 0 (0.0%) | 0 (0.0%) |
| 65 to 74 Years | 19 (18.1%) | 82 (56.2%) |
| 75 Years and over | 0 (0.0%) | 0 (0.0%) |
Disability Class: Self-Care Difficulty
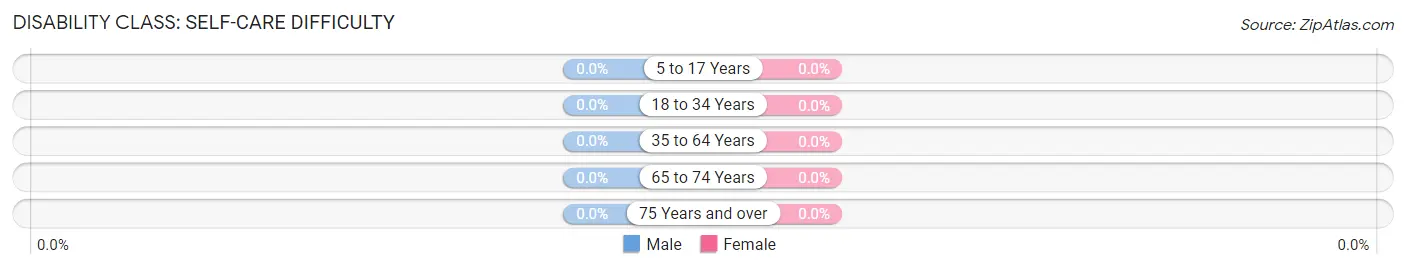
| Age Bracket | Male | Female |
| 5 to 17 Years | 0 (0.0%) | 0 (0.0%) |
| 18 to 34 Years | 0 (0.0%) | 0 (0.0%) |
| 35 to 64 Years | 0 (0.0%) | 0 (0.0%) |
| 65 to 74 Years | 0 (0.0%) | 0 (0.0%) |
| 75 Years and over | 0 (0.0%) | 0 (0.0%) |
Technology Access in El Valle de Arroyo Seco
Computing Device Access in El Valle de Arroyo Seco
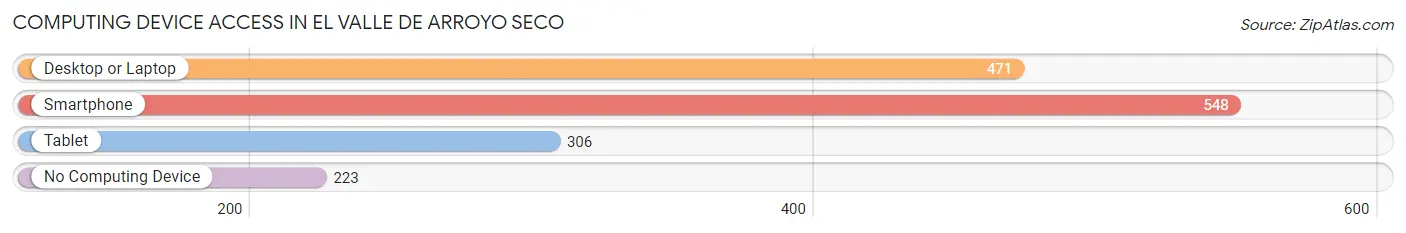
| Device Type | # Households | % Households |
| Desktop or Laptop | 471 | 61.1% |
| Smartphone | 548 | 71.1% |
| Tablet | 306 | 39.7% |
| No Computing Device | 223 | 28.9% |
| Total | 771 | 100.0% |
Internet Access in El Valle de Arroyo Seco
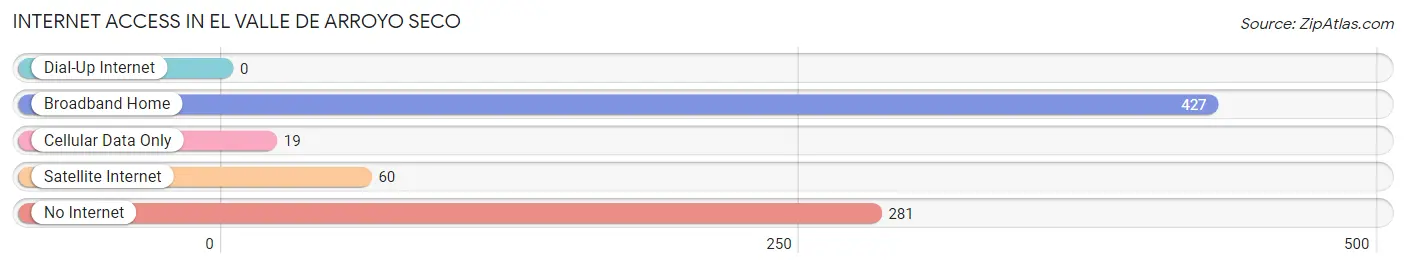
| Internet Type | # Households | % Households |
| Dial-Up Internet | 0 | 0.0% |
| Broadband Home | 427 | 55.4% |
| Cellular Data Only | 19 | 2.5% |
| Satellite Internet | 60 | 7.8% |
| No Internet | 281 | 36.4% |
| Total | 771 | 100.0% |
El Valle de Arroyo Seco Summary
Valley of Arroyo Seco, New Mexico is a small unincorporated community located in Taos County, New Mexico. It is situated in the Sangre de Cristo Mountains, approximately 25 miles south of Taos. The area is known for its stunning views of the surrounding mountains and its unique culture.
History
The Valley of Arroyo Seco has a long and rich history. The area was first inhabited by the Taos Indians, who lived in the area for centuries before the arrival of the Spanish in the 16th century. The Spanish established a mission in the area in 1617, and the area was later settled by Spanish colonists. The area was part of the Spanish province of New Mexico until 1821, when Mexico gained independence from Spain.
In 1848, the United States acquired the area as part of the Treaty of Guadalupe Hidalgo, which ended the Mexican-American War. The area was then part of the New Mexico Territory until 1912, when it became part of the state of New Mexico.
The Valley of Arroyo Seco was first settled by Anglo-Americans in the late 19th century. The area was initially used for ranching and farming, and the first post office was established in 1891. The area was also home to a number of small mining operations, which were active until the early 20th century.
Geography
The Valley of Arroyo Seco is located in the Sangre de Cristo Mountains, approximately 25 miles south of Taos. The area is characterized by its rugged terrain, with steep canyons and high mountains. The area is also home to a number of small streams and rivers, including the Rio Grande, which flows through the area.
The climate in the Valley of Arroyo Seco is semi-arid, with hot summers and cold winters. The average annual temperature is approximately 50 degrees Fahrenheit, and the average annual precipitation is approximately 12 inches.
Economy
The economy of the Valley of Arroyo Seco is largely based on tourism and agriculture. The area is home to a number of small farms and ranches, which produce a variety of crops, including hay, alfalfa, and vegetables. The area is also home to a number of small businesses, including restaurants, stores, and art galleries.
The area is also home to a number of outdoor recreation opportunities, including hiking, camping, fishing, and hunting. The area is also home to a number of ski resorts, which attract visitors from around the world.
Demographics
As of the 2010 census, the population of the Valley of Arroyo Seco was 1,845. The population is largely Hispanic, with approximately 75% of the population identifying as Hispanic or Latino. The median household income in the area is approximately $35,000, and the median home value is approximately $150,000.
Conclusion
The Valley of Arroyo Seco is a small unincorporated community located in Taos County, New Mexico. The area has a long and rich history, and is known for its stunning views of the surrounding mountains and its unique culture. The economy of the area is largely based on tourism and agriculture, and the area is home to a number of outdoor recreation opportunities. The population of the area is largely Hispanic, with approximately 75% of the population identifying as Hispanic or Latino.
Common Questions
What is Per Capita Income in El Valle de Arroyo Seco?
Per Capita income in El Valle de Arroyo Seco is $32,065.
What is the Median Family Income in El Valle de Arroyo Seco?
Median Family Income in El Valle de Arroyo Seco is $56,755.
What is the Median Household income in El Valle de Arroyo Seco?
Median Household Income in El Valle de Arroyo Seco is $65,750.
What is Inequality or Gini Index in El Valle de Arroyo Seco?
Inequality or Gini Index in El Valle de Arroyo Seco is 0.32.
What is the Total Population of El Valle de Arroyo Seco?
Total Population of El Valle de Arroyo Seco is 1,744.
What is the Total Male Population of El Valle de Arroyo Seco?
Total Male Population of El Valle de Arroyo Seco is 876.
What is the Total Female Population of El Valle de Arroyo Seco?
Total Female Population of El Valle de Arroyo Seco is 868.
What is the Ratio of Males per 100 Females in El Valle de Arroyo Seco?
There are 100.92 Males per 100 Females in El Valle de Arroyo Seco.
What is the Ratio of Females per 100 Males in El Valle de Arroyo Seco?
There are 99.09 Females per 100 Males in El Valle de Arroyo Seco.
What is the Median Population Age in El Valle de Arroyo Seco?
Median Population Age in El Valle de Arroyo Seco is 40.6 Years.
What is the Average Family Size in El Valle de Arroyo Seco
Average Family Size in El Valle de Arroyo Seco is 3.5 People.
What is the Average Household Size in El Valle de Arroyo Seco
Average Household Size in El Valle de Arroyo Seco is 2.3 People.
How Large is the Labor Force in El Valle de Arroyo Seco?
There are 816 People in the Labor Forcein in El Valle de Arroyo Seco.
What is the Percentage of People in the Labor Force in El Valle de Arroyo Seco?
57.2% of People are in the Labor Force in El Valle de Arroyo Seco.
What is the Unemployment Rate in El Valle de Arroyo Seco?
Unemployment Rate in El Valle de Arroyo Seco is 6.0%.