Placitas CDP Sandoval County, NM Map & Demographics
Placitas CDP Sandoval County Overview
$65,890
PER CAPITA INCOME
$118,750
AVG FAMILY INCOME
$105,216
AVG HOUSEHOLD INCOME
6.2%
WAGE / INCOME GAP [ % ]
93.8¢/ $1
WAGE / INCOME GAP [ $ ]
0.40
INEQUALITY / GINI INDEX
4,066
TOTAL POPULATION
2,138
MALE POPULATION
1,928
FEMALE POPULATION
110.89
MALES / 100 FEMALES
90.18
FEMALES / 100 MALES
62.8
MEDIAN AGE
2.3
AVG FAMILY SIZE
2.0
AVG HOUSEHOLD SIZE
1,820
LABOR FORCE [ PEOPLE ]
46.6%
PERCENT IN LABOR FORCE
3.0%
UNEMPLOYMENT RATE
Income in Placitas CDP Sandoval County
Income Overview in Placitas CDP Sandoval County
Per Capita Income in Placitas CDP Sandoval County is $65,890, while median incomes of families and households are $118,750 and $105,216 respectively.
| Characteristic | Number | Measure |
| Per Capita Income | 4,066 | $65,890 |
| Median Family Income | 1,401 | $118,750 |
| Mean Family Income | 1,401 | $148,618 |
| Median Household Income | 2,015 | $105,216 |
| Mean Household Income | 2,015 | $132,512 |
| Income Deficit | 1,401 | $0 |
| Wage / Income Gap (%) | 4,066 | 6.19% |
| Wage / Income Gap ($) | 4,066 | 93.81¢ per $1 |
| Gini / Inequality Index | 4,066 | 0.40 |
Earnings by Sex in Placitas CDP Sandoval County
Average Earnings in Placitas CDP Sandoval County are $59,227, $60,574 for men and $56,827 for women, a difference of 6.2%.
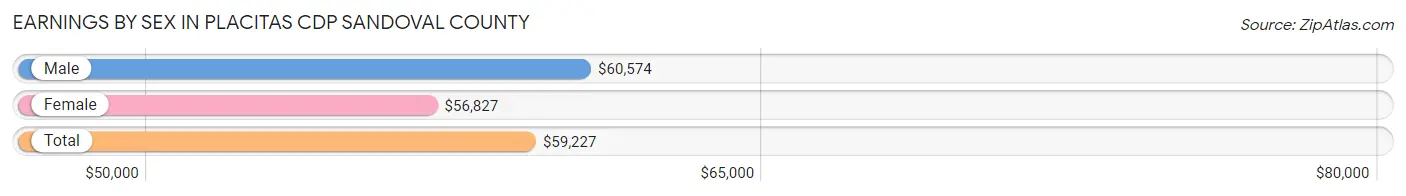
| Sex | Number | Average Earnings |
| Male | 1,265 (59.0%) | $60,574 |
| Female | 881 (41.0%) | $56,827 |
| Total | 2,146 (100.0%) | $59,227 |
Earnings by Sex by Income Bracket in Placitas CDP Sandoval County
The most common earnings brackets in Placitas CDP Sandoval County are $100,000+ for men (412 | 32.6%) and $55,000 to $64,999 for women (130 | 14.8%).
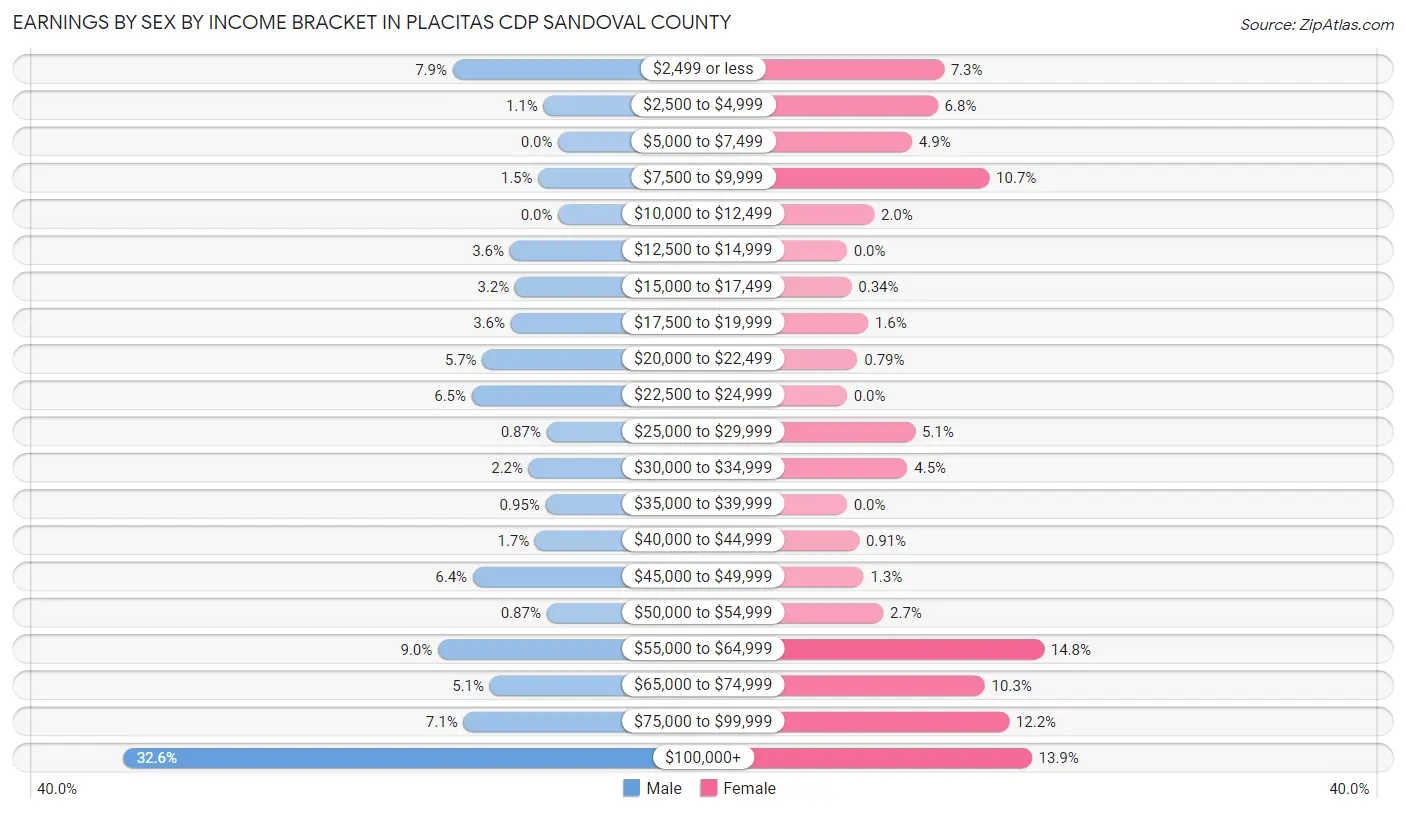
| Income | Male | Female |
| $2,499 or less | 100 (7.9%) | 64 (7.3%) |
| $2,500 to $4,999 | 14 (1.1%) | 60 (6.8%) |
| $5,000 to $7,499 | 0 (0.0%) | 43 (4.9%) |
| $7,500 to $9,999 | 19 (1.5%) | 94 (10.7%) |
| $10,000 to $12,499 | 0 (0.0%) | 18 (2.0%) |
| $12,500 to $14,999 | 46 (3.6%) | 0 (0.0%) |
| $15,000 to $17,499 | 41 (3.2%) | 3 (0.3%) |
| $17,500 to $19,999 | 45 (3.6%) | 14 (1.6%) |
| $20,000 to $22,499 | 72 (5.7%) | 7 (0.8%) |
| $22,500 to $24,999 | 82 (6.5%) | 0 (0.0%) |
| $25,000 to $29,999 | 11 (0.9%) | 45 (5.1%) |
| $30,000 to $34,999 | 28 (2.2%) | 40 (4.5%) |
| $35,000 to $39,999 | 12 (0.9%) | 0 (0.0%) |
| $40,000 to $44,999 | 22 (1.7%) | 8 (0.9%) |
| $45,000 to $49,999 | 81 (6.4%) | 11 (1.3%) |
| $50,000 to $54,999 | 11 (0.9%) | 24 (2.7%) |
| $55,000 to $64,999 | 114 (9.0%) | 130 (14.8%) |
| $65,000 to $74,999 | 65 (5.1%) | 91 (10.3%) |
| $75,000 to $99,999 | 90 (7.1%) | 107 (12.1%) |
| $100,000+ | 412 (32.6%) | 122 (13.9%) |
| Total | 1,265 (100.0%) | 881 (100.0%) |
Earnings by Sex by Educational Attainment in Placitas CDP Sandoval County
Average earnings in Placitas CDP Sandoval County are $62,029 for men and $56,827 for women, a difference of 8.4%. Men with an educational attainment of graduate degree enjoy the highest average annual earnings of $115,464, while those with high school diploma education earn the least with $21,349. Women with an educational attainment of bachelor's degree earn the most with the average annual earnings of $71,613, while those with graduate degree education have the smallest earnings of $64,167.
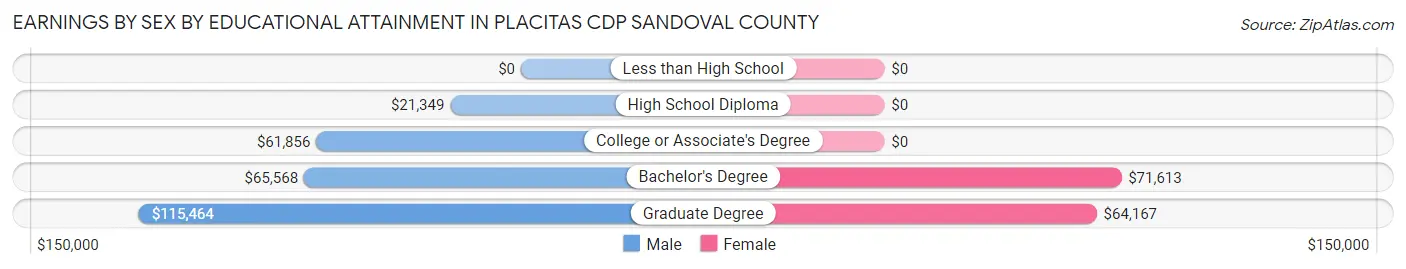
| Educational Attainment | Male Income | Female Income |
| Less than High School | - | - |
| High School Diploma | $21,349 | $0 |
| College or Associate's Degree | $61,856 | $0 |
| Bachelor's Degree | $65,568 | $71,613 |
| Graduate Degree | $115,464 | $64,167 |
| Total | $62,029 | $56,827 |
Family Income in Placitas CDP Sandoval County
Family Income Brackets in Placitas CDP Sandoval County
According to the Placitas CDP Sandoval County family income data, there are 298 families falling into the $100,000 to $149,999 income range, which is the most common income bracket and makes up 21.3% of all families.
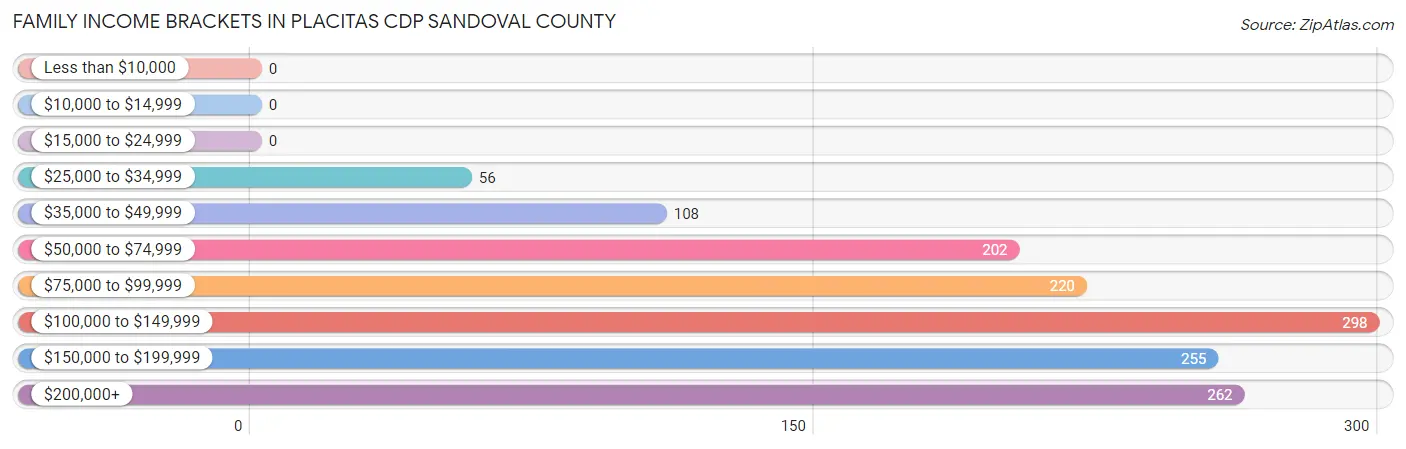
| Income Bracket | # Families | % Families |
| Less than $10,000 | 0 | 0.0% |
| $10,000 to $14,999 | 0 | 0.0% |
| $15,000 to $24,999 | 0 | 0.0% |
| $25,000 to $34,999 | 56 | 4.0% |
| $35,000 to $49,999 | 108 | 7.7% |
| $50,000 to $74,999 | 202 | 14.4% |
| $75,000 to $99,999 | 220 | 15.7% |
| $100,000 to $149,999 | 298 | 21.3% |
| $150,000 to $199,999 | 255 | 18.2% |
| $200,000+ | 262 | 18.7% |
Family Income by Famaliy Size in Placitas CDP Sandoval County
2-person families (1,110 | 79.2%) account for the highest median family income in Placitas CDP Sandoval County with $121,544 per family, while 2-person families (1,110 | 79.2%) have the highest median income of $60,772 per family member.
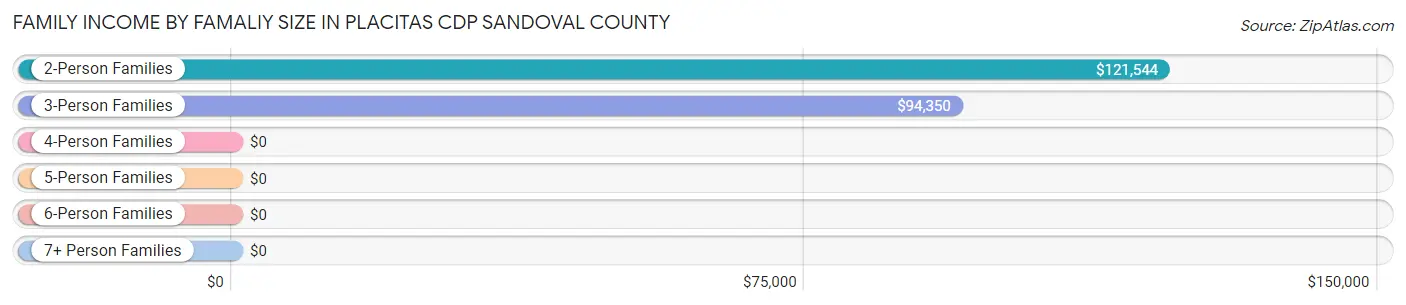
| Income Bracket | # Families | Median Income |
| 2-Person Families | 1,110 (79.2%) | $121,544 |
| 3-Person Families | 193 (13.8%) | $94,350 |
| 4-Person Families | 71 (5.1%) | $0 |
| 5-Person Families | 27 (1.9%) | $0 |
| 6-Person Families | 0 (0.0%) | $0 |
| 7+ Person Families | 0 (0.0%) | $0 |
| Total | 1,401 (100.0%) | $118,750 |
Family Income by Number of Earners in Placitas CDP Sandoval County
The median family income in Placitas CDP Sandoval County is $118,750, with families comprising 3+ earners (122) having the highest median family income of $250,001, while families with no earners (456) have the lowest median family income of $85,179, accounting for 8.7% and 32.6% of families, respectively.
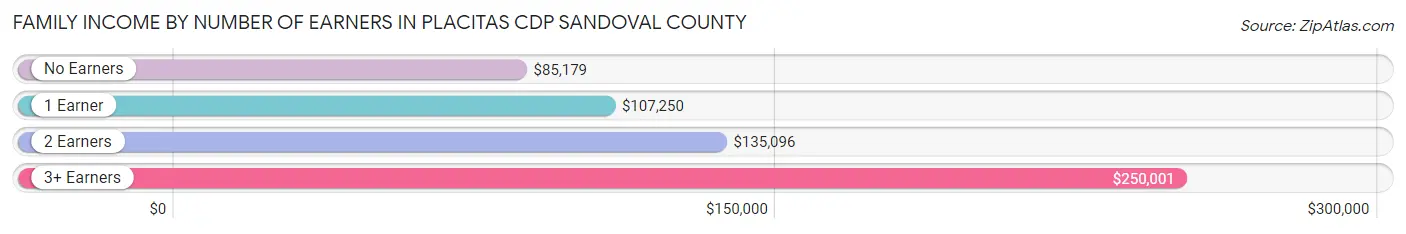
| Number of Earners | # Families | Median Income |
| No Earners | 456 (32.6%) | $85,179 |
| 1 Earner | 289 (20.6%) | $107,250 |
| 2 Earners | 534 (38.1%) | $135,096 |
| 3+ Earners | 122 (8.7%) | $250,001 |
| Total | 1,401 (100.0%) | $118,750 |
Household Income in Placitas CDP Sandoval County
Household Income Brackets in Placitas CDP Sandoval County
With 435 households falling in the category, the $100,000 to $149,999 income range is the most frequent in Placitas CDP Sandoval County, accounting for 21.6% of all households.
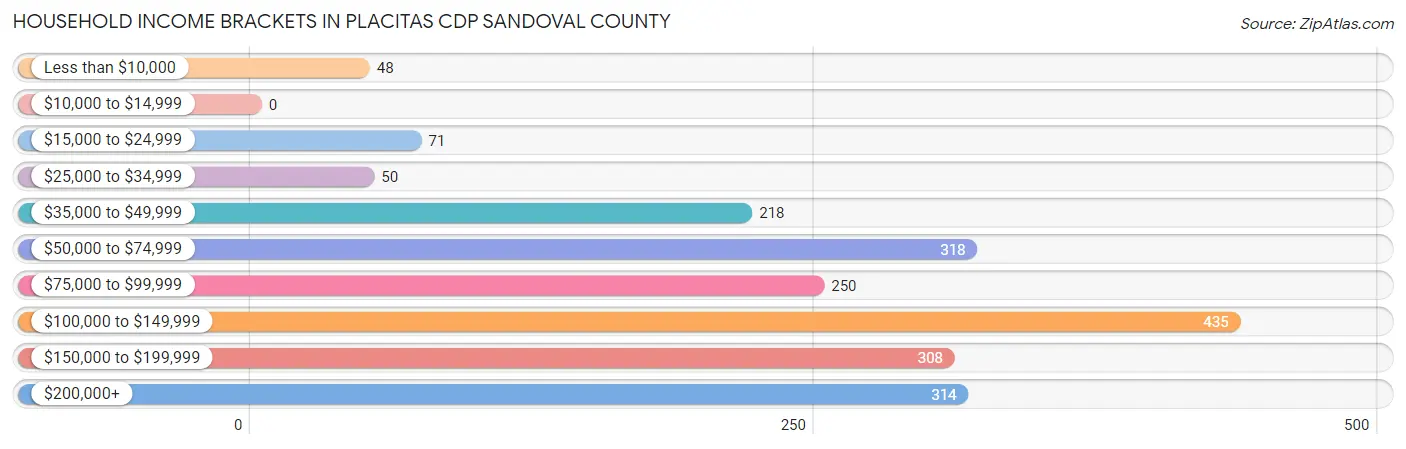
| Income Bracket | # Households | % Households |
| Less than $10,000 | 48 | 2.4% |
| $10,000 to $14,999 | 0 | 0.0% |
| $15,000 to $24,999 | 71 | 3.5% |
| $25,000 to $34,999 | 50 | 2.5% |
| $35,000 to $49,999 | 218 | 10.8% |
| $50,000 to $74,999 | 318 | 15.8% |
| $75,000 to $99,999 | 250 | 12.4% |
| $100,000 to $149,999 | 435 | 21.6% |
| $150,000 to $199,999 | 308 | 15.3% |
| $200,000+ | 314 | 15.6% |
Household Income by Householder Age in Placitas CDP Sandoval County
The median household income in Placitas CDP Sandoval County is $105,216, with the highest median household income of $127,006 found in the 45 to 64 years age bracket for the primary householder. A total of 921 households (45.7%) fall into this category.
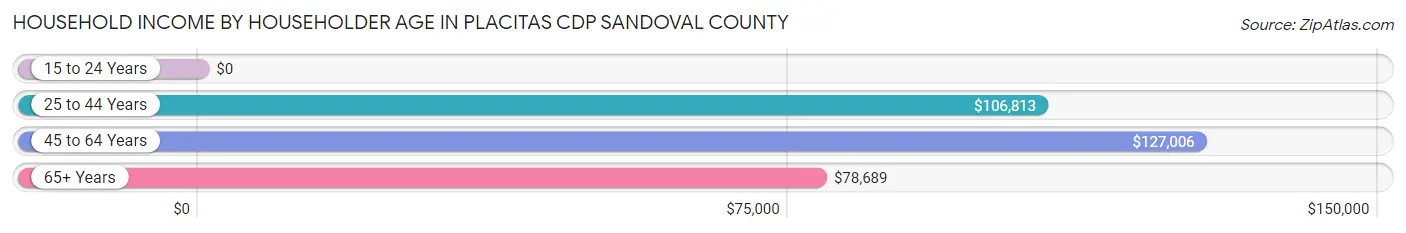
| Income Bracket | # Households | Median Income |
| 15 to 24 Years | 0 (0.0%) | $0 |
| 25 to 44 Years | 131 (6.5%) | $106,813 |
| 45 to 64 Years | 921 (45.7%) | $127,006 |
| 65+ Years | 963 (47.8%) | $78,689 |
| Total | 2,015 (100.0%) | $105,216 |
Poverty in Placitas CDP Sandoval County
Income Below Poverty by Sex and Age in Placitas CDP Sandoval County
With 2.3% poverty level for males and 3.7% for females among the residents of Placitas CDP Sandoval County, 45 to 54 year old males and 35 to 44 year old females are the most vulnerable to poverty, with 49 males (15.2%) and 41 females (16.9%) in their respective age groups living below the poverty level.
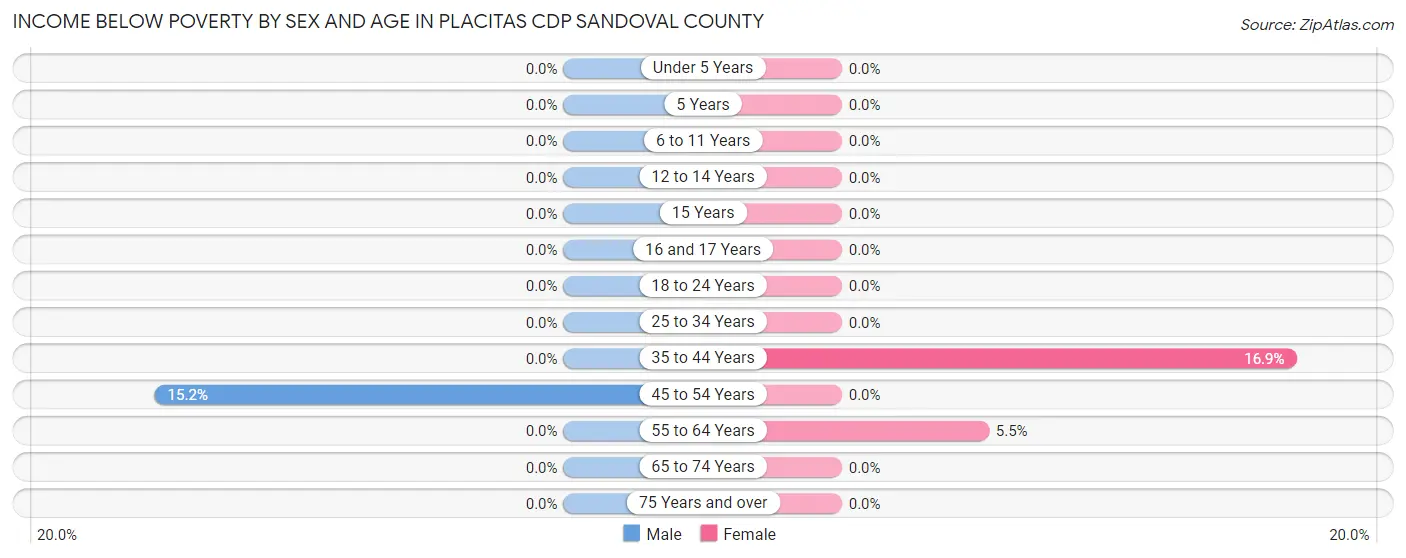
| Age Bracket | Male | Female |
| Under 5 Years | 0 (0.0%) | 0 (0.0%) |
| 5 Years | 0 (0.0%) | 0 (0.0%) |
| 6 to 11 Years | 0 (0.0%) | 0 (0.0%) |
| 12 to 14 Years | 0 (0.0%) | 0 (0.0%) |
| 15 Years | 0 (0.0%) | 0 (0.0%) |
| 16 and 17 Years | 0 (0.0%) | 0 (0.0%) |
| 18 to 24 Years | 0 (0.0%) | 0 (0.0%) |
| 25 to 34 Years | 0 (0.0%) | 0 (0.0%) |
| 35 to 44 Years | 0 (0.0%) | 41 (16.9%) |
| 45 to 54 Years | 49 (15.2%) | 0 (0.0%) |
| 55 to 64 Years | 0 (0.0%) | 30 (5.5%) |
| 65 to 74 Years | 0 (0.0%) | 0 (0.0%) |
| 75 Years and over | 0 (0.0%) | 0 (0.0%) |
| Total | 49 (2.3%) | 71 (3.7%) |
Income Above Poverty by Sex and Age in Placitas CDP Sandoval County
According to the poverty statistics in Placitas CDP Sandoval County, males aged under 5 years and females aged under 5 years are the age groups that are most secure financially, with 100.0% of males and 100.0% of females in these age groups living above the poverty line.
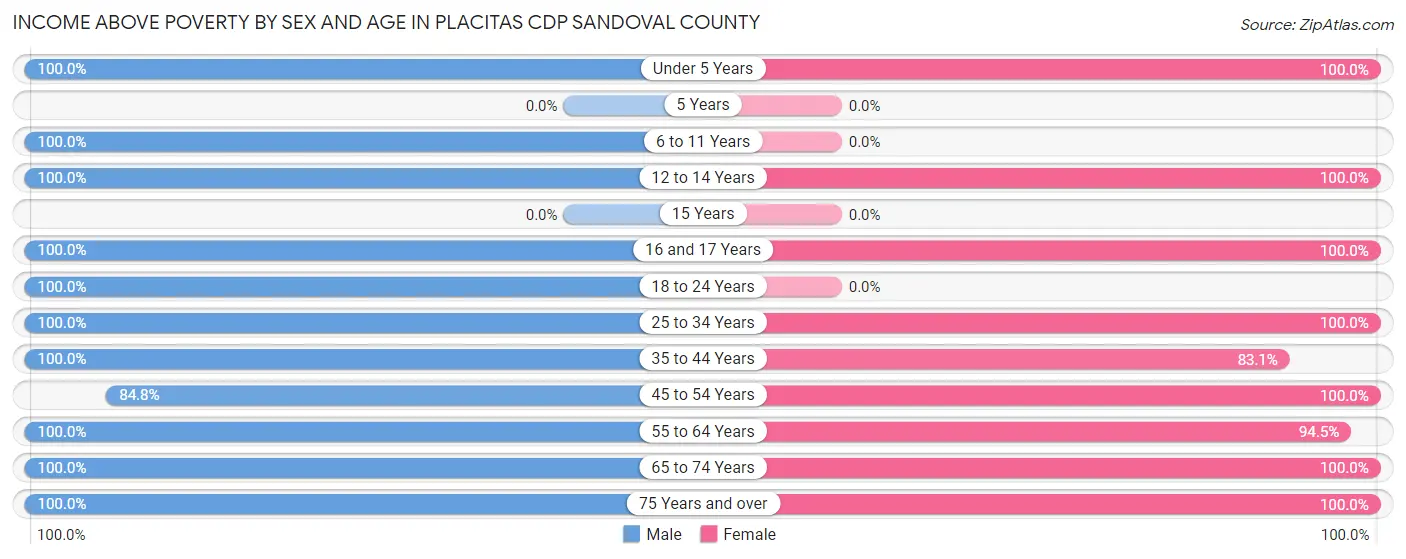
| Age Bracket | Male | Female |
| Under 5 Years | 77 (100.0%) | 32 (100.0%) |
| 5 Years | 0 (0.0%) | 0 (0.0%) |
| 6 to 11 Years | 19 (100.0%) | 0 (0.0%) |
| 12 to 14 Years | 14 (100.0%) | 18 (100.0%) |
| 15 Years | 0 (0.0%) | 0 (0.0%) |
| 16 and 17 Years | 44 (100.0%) | 13 (100.0%) |
| 18 to 24 Years | 85 (100.0%) | 0 (0.0%) |
| 25 to 34 Years | 32 (100.0%) | 59 (100.0%) |
| 35 to 44 Years | 176 (100.0%) | 202 (83.1%) |
| 45 to 54 Years | 274 (84.8%) | 199 (100.0%) |
| 55 to 64 Years | 490 (100.0%) | 519 (94.5%) |
| 65 to 74 Years | 640 (100.0%) | 608 (100.0%) |
| 75 Years and over | 238 (100.0%) | 207 (100.0%) |
| Total | 2,089 (97.7%) | 1,857 (96.3%) |
Income Below Poverty Among Married-Couple Families in Placitas CDP Sandoval County
| Children | Above Poverty | Below Poverty |
| No Children | 1,267 (100.0%) | 0 (0.0%) |
| 1 or 2 Children | 71 (100.0%) | 0 (0.0%) |
| 3 or 4 Children | 27 (100.0%) | 0 (0.0%) |
| 5 or more Children | 0 (0.0%) | 0 (0.0%) |
| Total | 1,365 (100.0%) | 0 (0.0%) |
Income Below Poverty Among Single-Parent Households in Placitas CDP Sandoval County
| Children | Single Father | Single Mother |
| No Children | 0 (0.0%) | 0 (0.0%) |
| 1 or 2 Children | 0 (0.0%) | 0 (0.0%) |
| 3 or 4 Children | 0 (0.0%) | 0 (0.0%) |
| 5 or more Children | 0 (0.0%) | 0 (0.0%) |
| Total | 0 (0.0%) | 0 (0.0%) |
Income Below Poverty Among Married-Couple vs Single-Parent Households in Placitas CDP Sandoval County
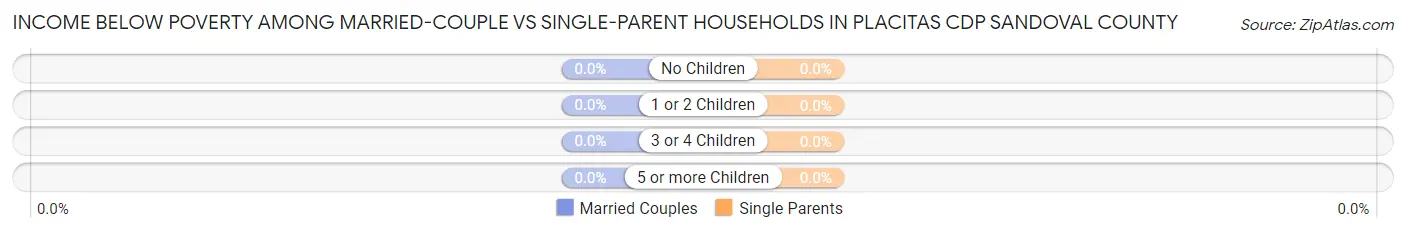
| Children | Married-Couple Families | Single-Parent Households |
| No Children | 0 (0.0%) | 0 (0.0%) |
| 1 or 2 Children | 0 (0.0%) | 0 (0.0%) |
| 3 or 4 Children | 0 (0.0%) | 0 (0.0%) |
| 5 or more Children | 0 (0.0%) | 0 (0.0%) |
| Total | 0 (0.0%) | 0 (0.0%) |
Race in Placitas CDP Sandoval County
The most populous races in Placitas CDP Sandoval County are White / Caucasian (3,504 | 86.2%), Hispanic or Latino (730 | 17.9%), and Some other Race (209 | 5.1%).
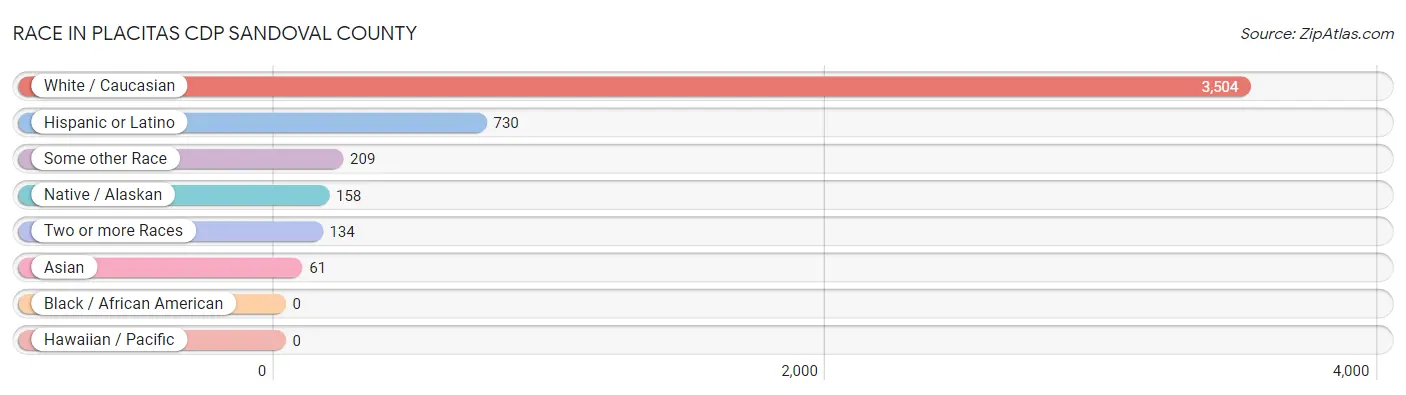
| Race | # Population | % Population |
| Asian | 61 | 1.5% |
| Black / African American | 0 | 0.0% |
| Hawaiian / Pacific | 0 | 0.0% |
| Hispanic or Latino | 730 | 17.9% |
| Native / Alaskan | 158 | 3.9% |
| White / Caucasian | 3,504 | 86.2% |
| Two or more Races | 134 | 3.3% |
| Some other Race | 209 | 5.1% |
| Total | 4,066 | 100.0% |
Ancestry in Placitas CDP Sandoval County
The most populous ancestries reported in Placitas CDP Sandoval County are English (736 | 18.1%), Irish (710 | 17.5%), Mexican (444 | 10.9%), German (425 | 10.4%), and European (323 | 7.9%), together accounting for 64.9% of all Placitas CDP Sandoval County residents.
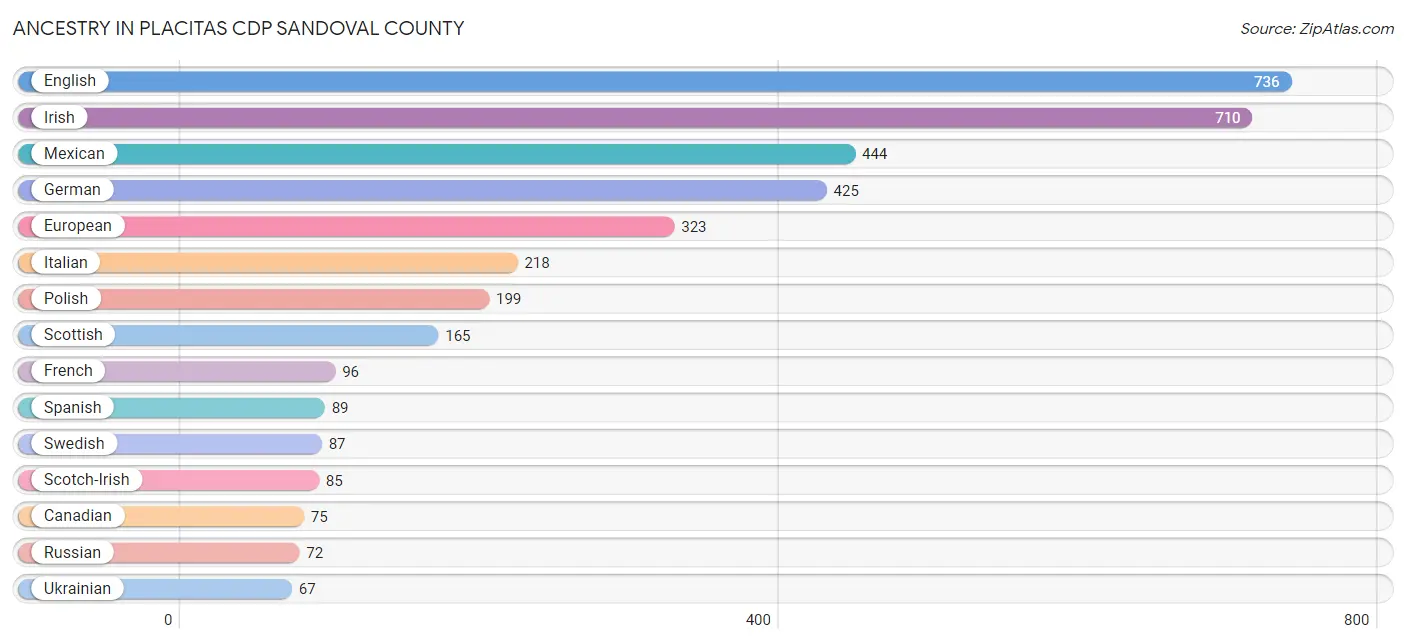
| Ancestry | # Population | % Population |
| American | 59 | 1.5% |
| Austrian | 40 | 1.0% |
| Brazilian | 9 | 0.2% |
| British | 46 | 1.1% |
| Burmese | 10 | 0.3% |
| Canadian | 75 | 1.8% |
| Cherokee | 21 | 0.5% |
| Croatian | 12 | 0.3% |
| Czech | 38 | 0.9% |
| Czechoslovakian | 13 | 0.3% |
| Danish | 17 | 0.4% |
| Dutch | 21 | 0.5% |
| Eastern European | 33 | 0.8% |
| English | 736 | 18.1% |
| European | 323 | 7.9% |
| Finnish | 4 | 0.1% |
| French | 96 | 2.4% |
| French Canadian | 52 | 1.3% |
| German | 425 | 10.4% |
| Greek | 45 | 1.1% |
| Hungarian | 14 | 0.3% |
| Indian (Asian) | 38 | 0.9% |
| Irish | 710 | 17.5% |
| Italian | 218 | 5.4% |
| Lithuanian | 23 | 0.6% |
| Luxembourger | 12 | 0.3% |
| Mexican | 444 | 10.9% |
| Native Hawaiian | 9 | 0.2% |
| Navajo | 29 | 0.7% |
| Northern European | 64 | 1.6% |
| Norwegian | 47 | 1.2% |
| Polish | 199 | 4.9% |
| Pueblo | 27 | 0.7% |
| Russian | 72 | 1.8% |
| Scandinavian | 44 | 1.1% |
| Scotch-Irish | 85 | 2.1% |
| Scottish | 165 | 4.1% |
| Spaniard | 19 | 0.5% |
| Spanish | 89 | 2.2% |
| Swedish | 87 | 2.1% |
| Swiss | 19 | 0.5% |
| Thai | 22 | 0.5% |
| Ukrainian | 67 | 1.7% |
| Welsh | 51 | 1.3% | View All 44 Rows |
Immigrants in Placitas CDP Sandoval County
The most numerous immigrant groups reported in Placitas CDP Sandoval County came from Asia (46 | 1.1%), Europe (37 | 0.9%), Canada (31 | 0.8%), Germany (29 | 0.7%), and Latin America (29 | 0.7%), together accounting for 4.2% of all Placitas CDP Sandoval County residents.
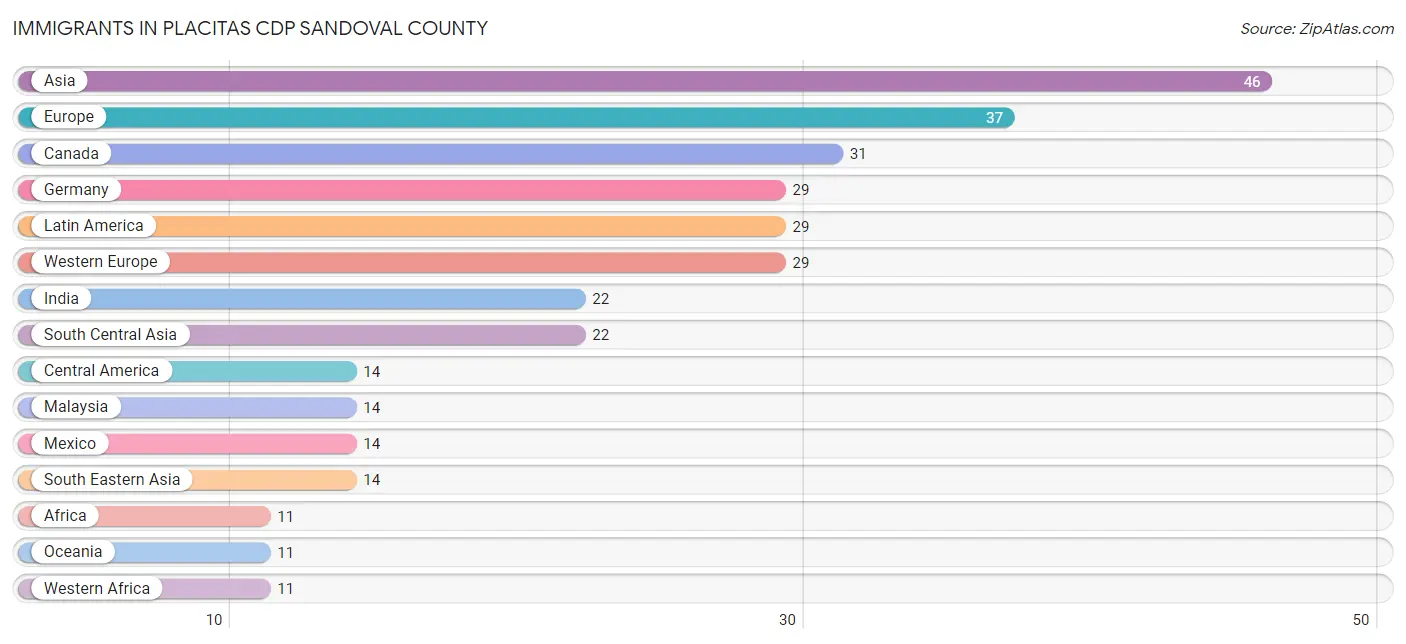
| Immigration Origin | # Population | % Population |
| Africa | 11 | 0.3% |
| Asia | 46 | 1.1% |
| Brazil | 9 | 0.2% |
| Canada | 31 | 0.8% |
| Caribbean | 6 | 0.2% |
| Central America | 14 | 0.3% |
| Eastern Asia | 10 | 0.3% |
| Europe | 37 | 0.9% |
| Germany | 29 | 0.7% |
| India | 22 | 0.5% |
| Italy | 8 | 0.2% |
| Korea | 10 | 0.3% |
| Latin America | 29 | 0.7% |
| Malaysia | 14 | 0.3% |
| Mexico | 14 | 0.3% |
| Oceania | 11 | 0.3% |
| South America | 9 | 0.2% |
| South Central Asia | 22 | 0.5% |
| South Eastern Asia | 14 | 0.3% |
| Southern Europe | 8 | 0.2% |
| Trinidad and Tobago | 6 | 0.2% |
| Western Africa | 11 | 0.3% |
| Western Europe | 29 | 0.7% | View All 23 Rows |
Sex and Age in Placitas CDP Sandoval County
Sex and Age in Placitas CDP Sandoval County
The most populous age groups in Placitas CDP Sandoval County are 65 to 69 Years (378 | 17.7%) for men and 60 to 64 Years (418 | 21.7%) for women.
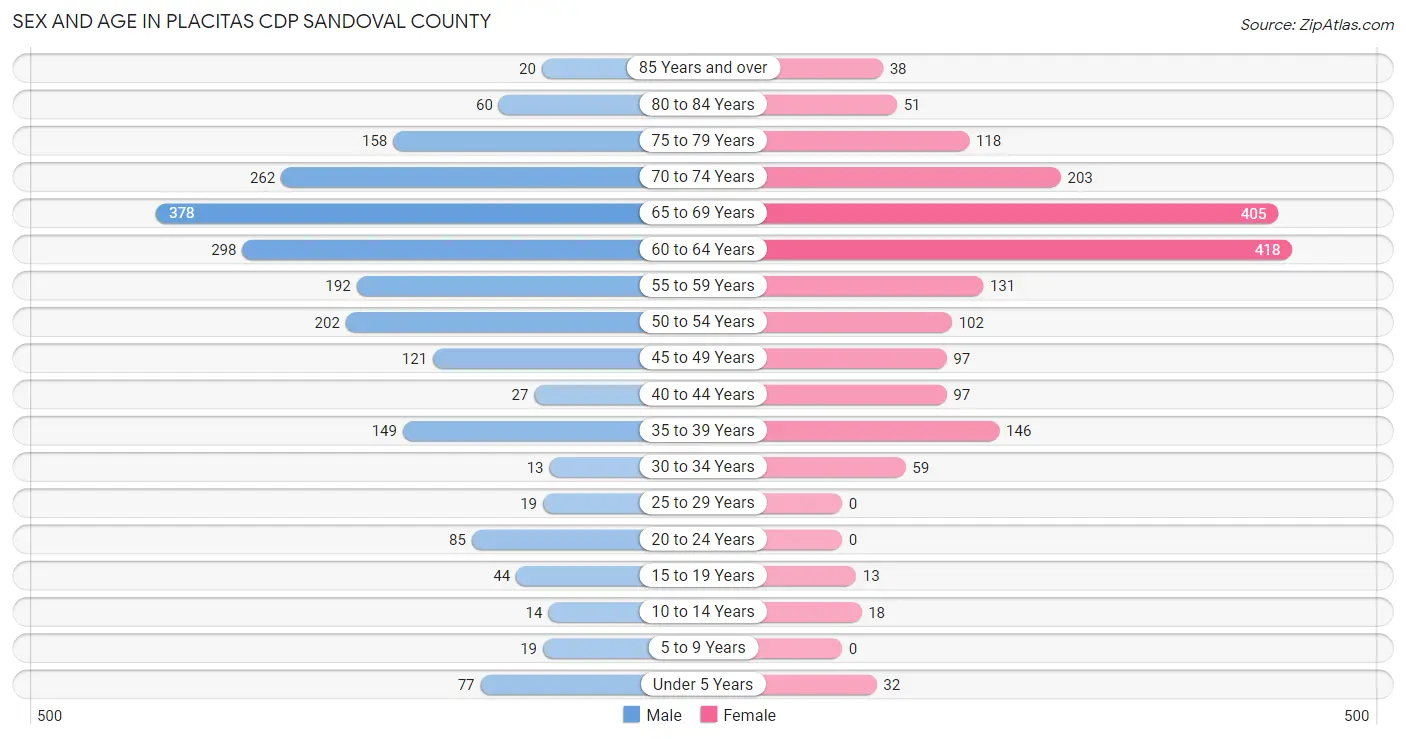
| Age Bracket | Male | Female |
| Under 5 Years | 77 (3.6%) | 32 (1.7%) |
| 5 to 9 Years | 19 (0.9%) | 0 (0.0%) |
| 10 to 14 Years | 14 (0.6%) | 18 (0.9%) |
| 15 to 19 Years | 44 (2.1%) | 13 (0.7%) |
| 20 to 24 Years | 85 (4.0%) | 0 (0.0%) |
| 25 to 29 Years | 19 (0.9%) | 0 (0.0%) |
| 30 to 34 Years | 13 (0.6%) | 59 (3.1%) |
| 35 to 39 Years | 149 (7.0%) | 146 (7.6%) |
| 40 to 44 Years | 27 (1.3%) | 97 (5.0%) |
| 45 to 49 Years | 121 (5.7%) | 97 (5.0%) |
| 50 to 54 Years | 202 (9.5%) | 102 (5.3%) |
| 55 to 59 Years | 192 (9.0%) | 131 (6.8%) |
| 60 to 64 Years | 298 (13.9%) | 418 (21.7%) |
| 65 to 69 Years | 378 (17.7%) | 405 (21.0%) |
| 70 to 74 Years | 262 (12.2%) | 203 (10.5%) |
| 75 to 79 Years | 158 (7.4%) | 118 (6.1%) |
| 80 to 84 Years | 60 (2.8%) | 51 (2.6%) |
| 85 Years and over | 20 (0.9%) | 38 (2.0%) |
| Total | 2,138 (100.0%) | 1,928 (100.0%) |
Families and Households in Placitas CDP Sandoval County
Median Family Size in Placitas CDP Sandoval County
The median family size in Placitas CDP Sandoval County is 2.31 persons per family, with married-couple families (1,365 | 97.4%) accounting for the largest median family size of 2.31 persons per family. On the other hand, single male/father families (16 | 1.1%) represent the smallest median family size with 2.06 persons per family.
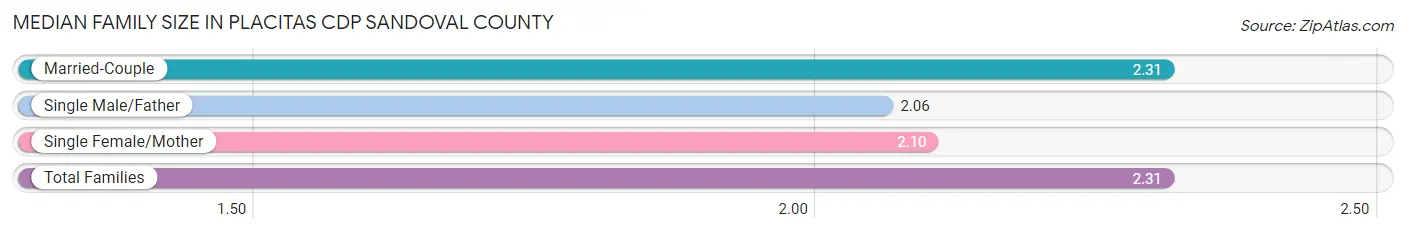
| Family Type | # Families | Family Size |
| Married-Couple | 1,365 (97.4%) | 2.31 |
| Single Male/Father | 16 (1.1%) | 2.06 |
| Single Female/Mother | 20 (1.4%) | 2.10 |
| Total Families | 1,401 (100.0%) | 2.31 |
Median Household Size in Placitas CDP Sandoval County
The median household size in Placitas CDP Sandoval County is 2.02 persons per household, with single male/father households (16 | 0.8%) accounting for the largest median household size of 2.75 persons per household. non-family households (614 | 30.5%) represent the smallest median household size with 1.32 persons per household.
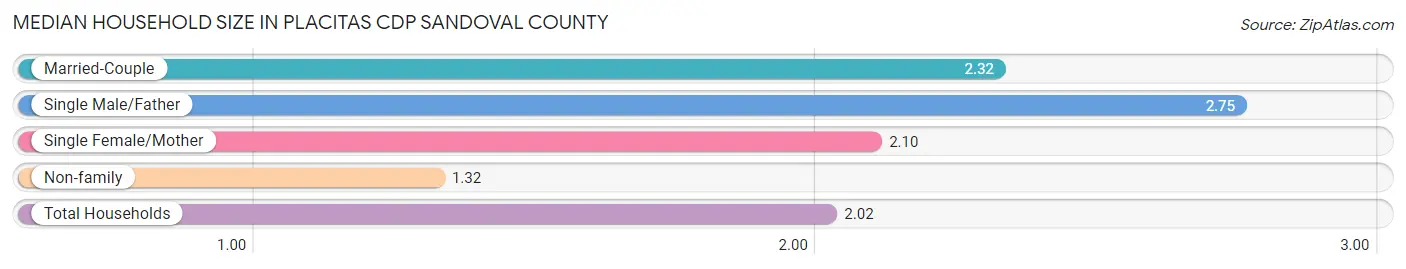
| Household Type | # Households | Household Size |
| Married-Couple | 1,365 (67.7%) | 2.32 |
| Single Male/Father | 16 (0.8%) | 2.75 |
| Single Female/Mother | 20 (1.0%) | 2.10 |
| Non-family | 614 (30.5%) | 1.32 |
| Total Households | 2,015 (100.0%) | 2.02 |
Household Size by Marriage Status in Placitas CDP Sandoval County
Out of a total of 2,015 households in Placitas CDP Sandoval County, 1,401 (69.5%) are family households, while 614 (30.5%) are nonfamily households. The most numerous type of family households are 2-person households, comprising 1,094, and the most common type of nonfamily households are 1-person households, comprising 419.
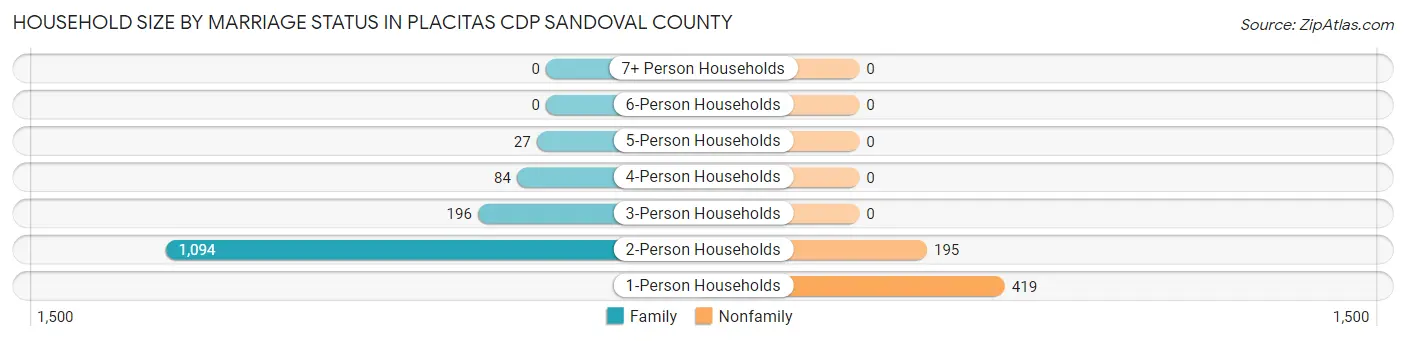
| Household Size | Family Households | Nonfamily Households |
| 1-Person Households | - | 419 (20.8%) |
| 2-Person Households | 1,094 (54.3%) | 195 (9.7%) |
| 3-Person Households | 196 (9.7%) | 0 (0.0%) |
| 4-Person Households | 84 (4.2%) | 0 (0.0%) |
| 5-Person Households | 27 (1.3%) | 0 (0.0%) |
| 6-Person Households | 0 (0.0%) | 0 (0.0%) |
| 7+ Person Households | 0 (0.0%) | 0 (0.0%) |
| Total | 1,401 (69.5%) | 614 (30.5%) |
Female Fertility in Placitas CDP Sandoval County
Fertility by Age in Placitas CDP Sandoval County
Average fertility rate in Placitas CDP Sandoval County is 68.0 births per 1,000 women. Women in the age bracket of 20 to 34 years have the highest fertility rate with 153.0 births per 1,000 women. Women in the age bracket of 35 to 50 years acount for 67.9% of all women with births.
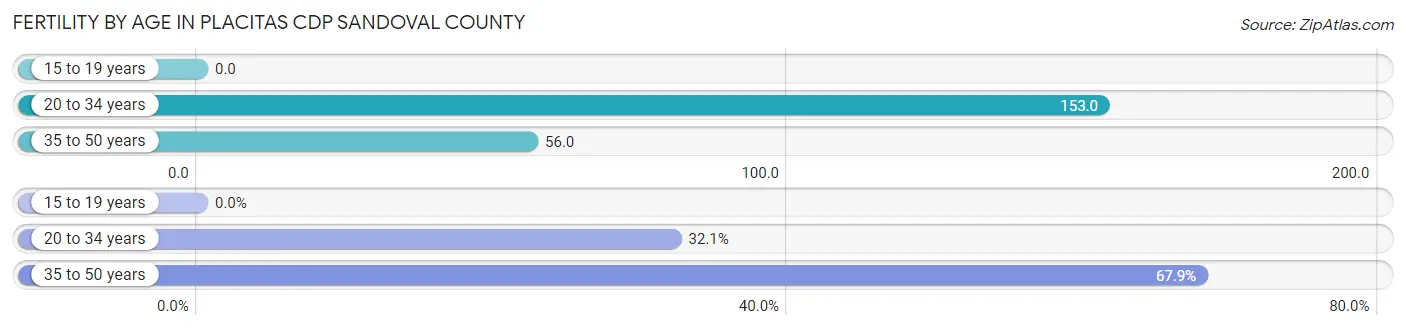
| Age Bracket | Women with Births | Births / 1,000 Women |
| 15 to 19 years | 0 (0.0%) | 0.0 |
| 20 to 34 years | 9 (32.1%) | 153.0 |
| 35 to 50 years | 19 (67.9%) | 56.0 |
| Total | 28 (100.0%) | 68.0 |
Fertility by Age by Marriage Status in Placitas CDP Sandoval County
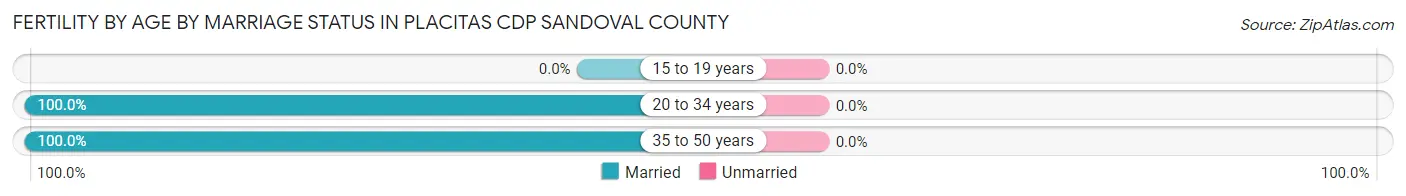
| Age Bracket | Married | Unmarried |
| 15 to 19 years | 0 (0.0%) | 0 (0.0%) |
| 20 to 34 years | 9 (100.0%) | 0 (0.0%) |
| 35 to 50 years | 19 (100.0%) | 0 (0.0%) |
| Total | 28 (100.0%) | 0 (0.0%) |
Fertility by Education in Placitas CDP Sandoval County
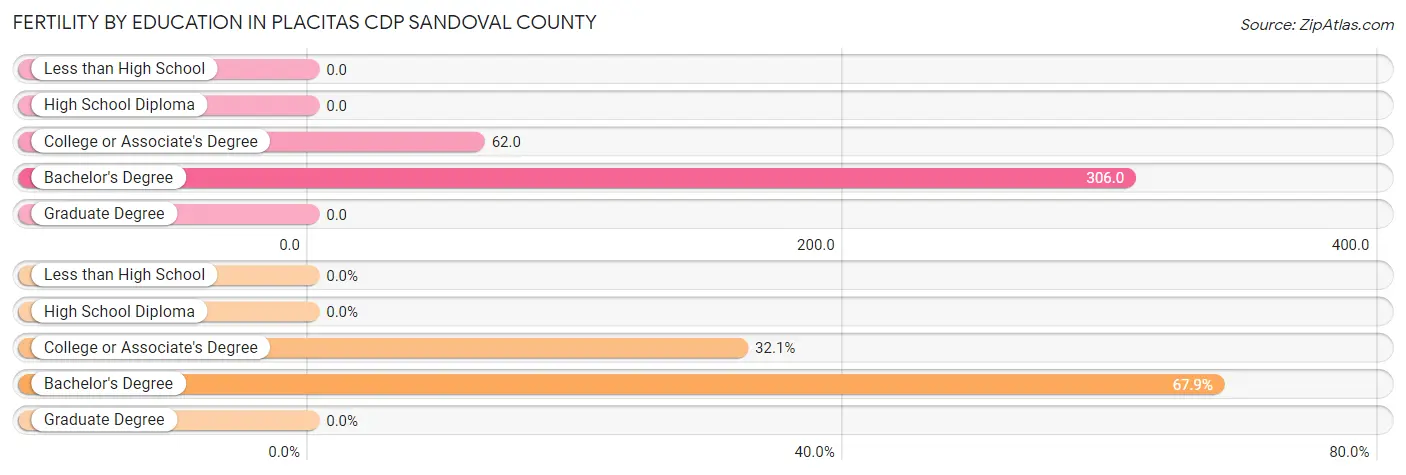
| Educational Attainment | Women with Births | Births / 1,000 Women |
| Less than High School | 0 (0.0%) | 0.0 |
| High School Diploma | 0 (0.0%) | 0.0 |
| College or Associate's Degree | 9 (32.1%) | 62.0 |
| Bachelor's Degree | 19 (67.9%) | 306.0 |
| Graduate Degree | 0 (0.0%) | 0.0 |
| Total | 28 (100.0%) | 68.0 |
Fertility by Education by Marriage Status in Placitas CDP Sandoval County
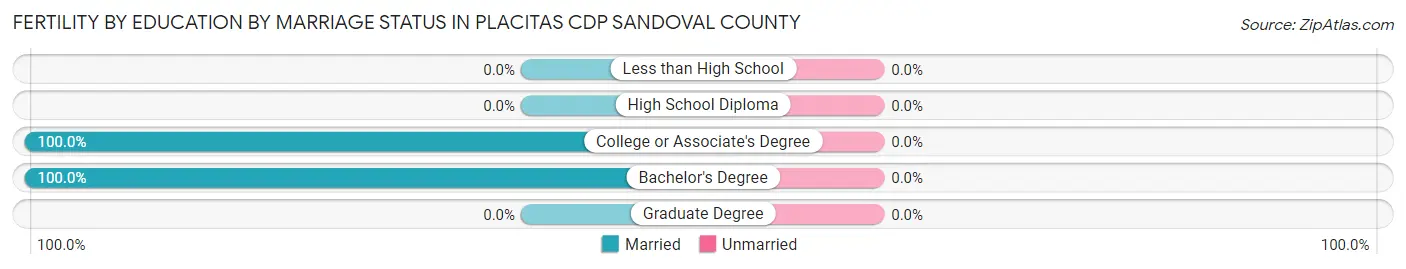
| Educational Attainment | Married | Unmarried |
| Less than High School | 0 (0.0%) | 0 (0.0%) |
| High School Diploma | 0 (0.0%) | 0 (0.0%) |
| College or Associate's Degree | 9 (100.0%) | 0 (0.0%) |
| Bachelor's Degree | 19 (100.0%) | 0 (0.0%) |
| Graduate Degree | 0 (0.0%) | 0 (0.0%) |
| Total | 28 (100.0%) | 0 (0.0%) |
Employment Characteristics in Placitas CDP Sandoval County
Employment by Class of Employer in Placitas CDP Sandoval County
Among the 1,717 employed individuals in Placitas CDP Sandoval County, private company employees (760 | 44.3%), not-for-profit organizations (329 | 19.2%), and state government employees (300 | 17.5%) make up the most common classes of employment.
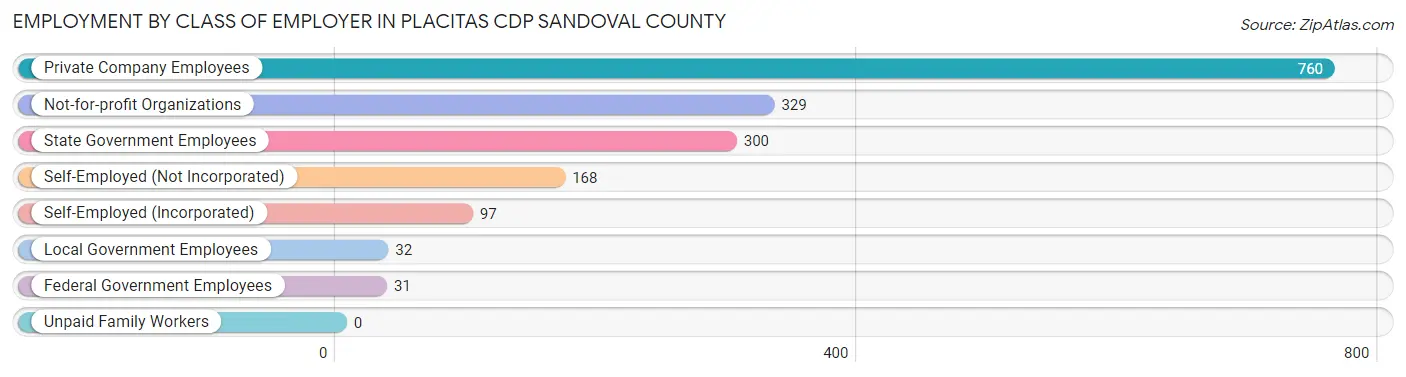
| Employer Class | # Employees | % Employees |
| Private Company Employees | 760 | 44.3% |
| Self-Employed (Incorporated) | 97 | 5.7% |
| Self-Employed (Not Incorporated) | 168 | 9.8% |
| Not-for-profit Organizations | 329 | 19.2% |
| Local Government Employees | 32 | 1.9% |
| State Government Employees | 300 | 17.5% |
| Federal Government Employees | 31 | 1.8% |
| Unpaid Family Workers | 0 | 0.0% |
| Total | 1,717 | 100.0% |
Employment Status by Age in Placitas CDP Sandoval County
According to the labor force statistics for Placitas CDP Sandoval County, out of the total population over 16 years of age (3,906), 46.6% or 1,820 individuals are in the labor force, with 3.0% or 55 of them unemployed. The age group with the highest labor force participation rate is 25 to 29 years, with 100.0% or 19 individuals in the labor force. Within the labor force, the 20 to 24 years age range has the highest percentage of unemployed individuals, with 30.3% or 20 of them being unemployed.
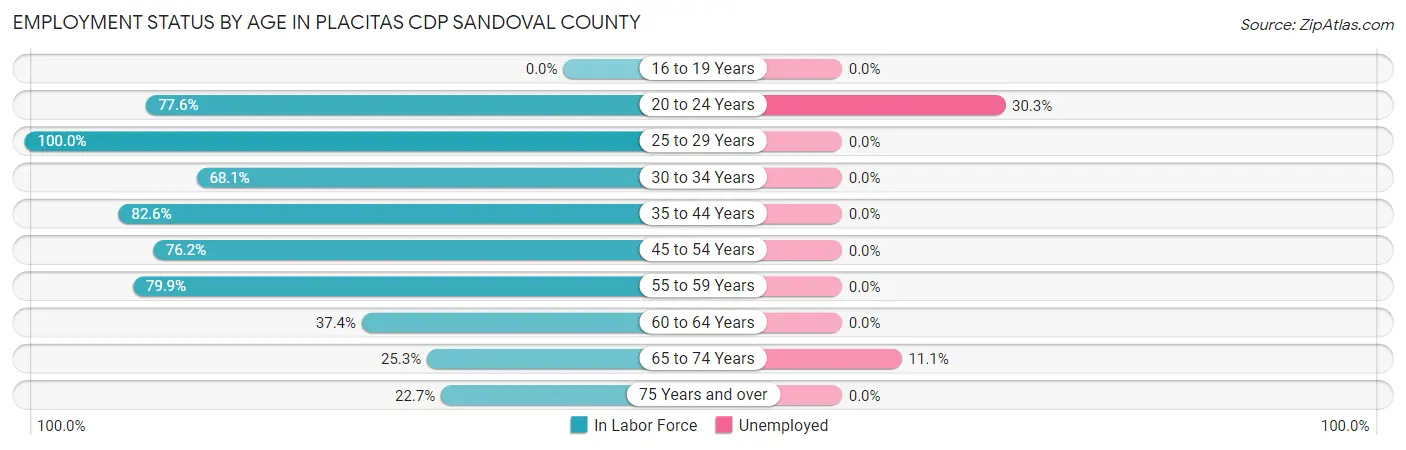
| Age Bracket | In Labor Force | Unemployed |
| 16 to 19 Years | 0 (0.0%) | 0 (0.0%) |
| 20 to 24 Years | 66 (77.6%) | 20 (30.3%) |
| 25 to 29 Years | 19 (100.0%) | 0 (0.0%) |
| 30 to 34 Years | 49 (68.1%) | 0 (0.0%) |
| 35 to 44 Years | 346 (82.6%) | 0 (0.0%) |
| 45 to 54 Years | 398 (76.2%) | 0 (0.0%) |
| 55 to 59 Years | 258 (79.9%) | 0 (0.0%) |
| 60 to 64 Years | 268 (37.4%) | 0 (0.0%) |
| 65 to 74 Years | 316 (25.3%) | 35 (11.1%) |
| 75 Years and over | 101 (22.7%) | 0 (0.0%) |
| Total | 1,820 (46.6%) | 55 (3.0%) |
Employment Status by Educational Attainment in Placitas CDP Sandoval County
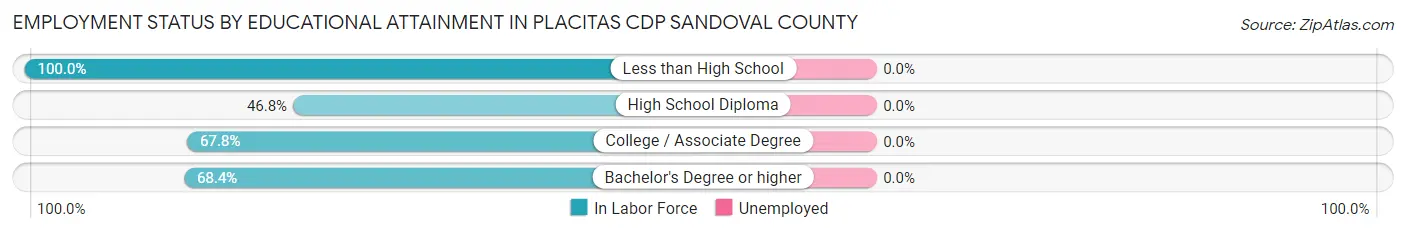
| Educational Attainment | In Labor Force | Unemployed |
| Less than High School | 7 (100.0%) | 0 (0.0%) |
| High School Diploma | 171 (46.8%) | 0 (0.0%) |
| College / Associate Degree | 240 (67.8%) | 0 (0.0%) |
| Bachelor's Degree or higher | 920 (68.4%) | 0 (0.0%) |
| Total | 1,338 (64.6%) | 0 (0.0%) |
Employment Occupations by Sex in Placitas CDP Sandoval County
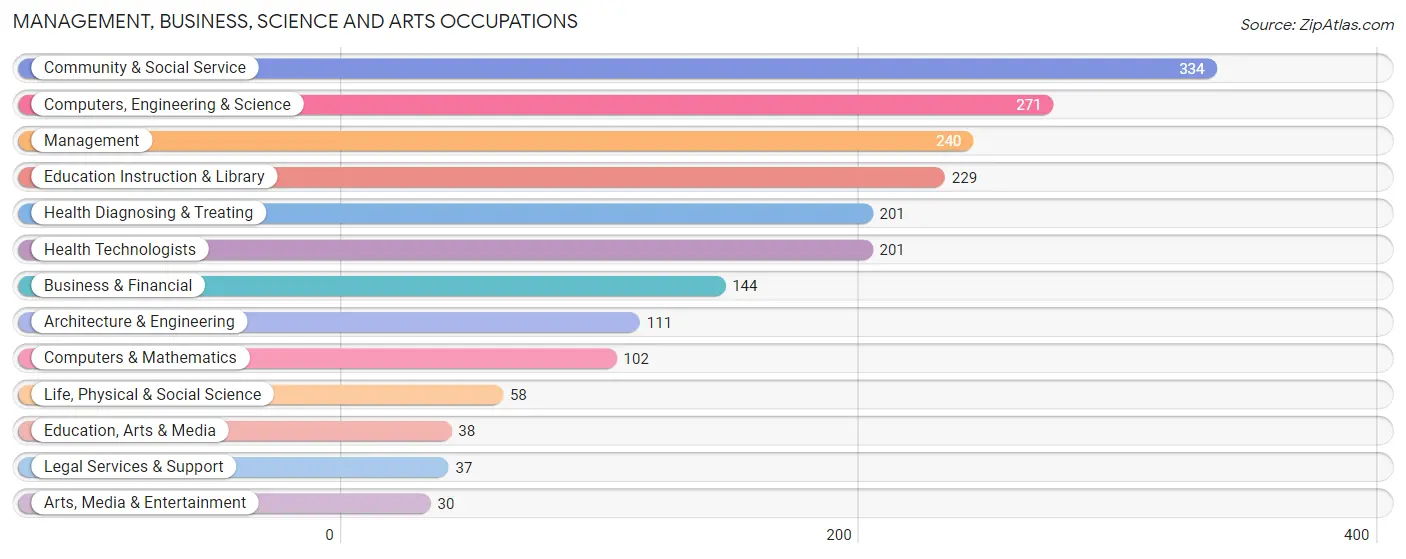
Management, Business, Science and Arts Occupations
The most common Management, Business, Science and Arts occupations in Placitas CDP Sandoval County are Community & Social Service (334 | 18.9%), Computers, Engineering & Science (271 | 15.3%), Management (240 | 13.6%), Education Instruction & Library (229 | 13.0%), and Health Diagnosing & Treating (201 | 11.4%).
Management, Business, Science and Arts Occupations by Sex
Within the Management, Business, Science and Arts occupations in Placitas CDP Sandoval County, the most male-oriented occupations are Legal Services & Support (100.0%), Architecture & Engineering (91.0%), and Education Instruction & Library (76.9%), while the most female-oriented occupations are Arts, Media & Entertainment (100.0%), Life, Physical & Social Science (58.6%), and Health Diagnosing & Treating (53.2%).
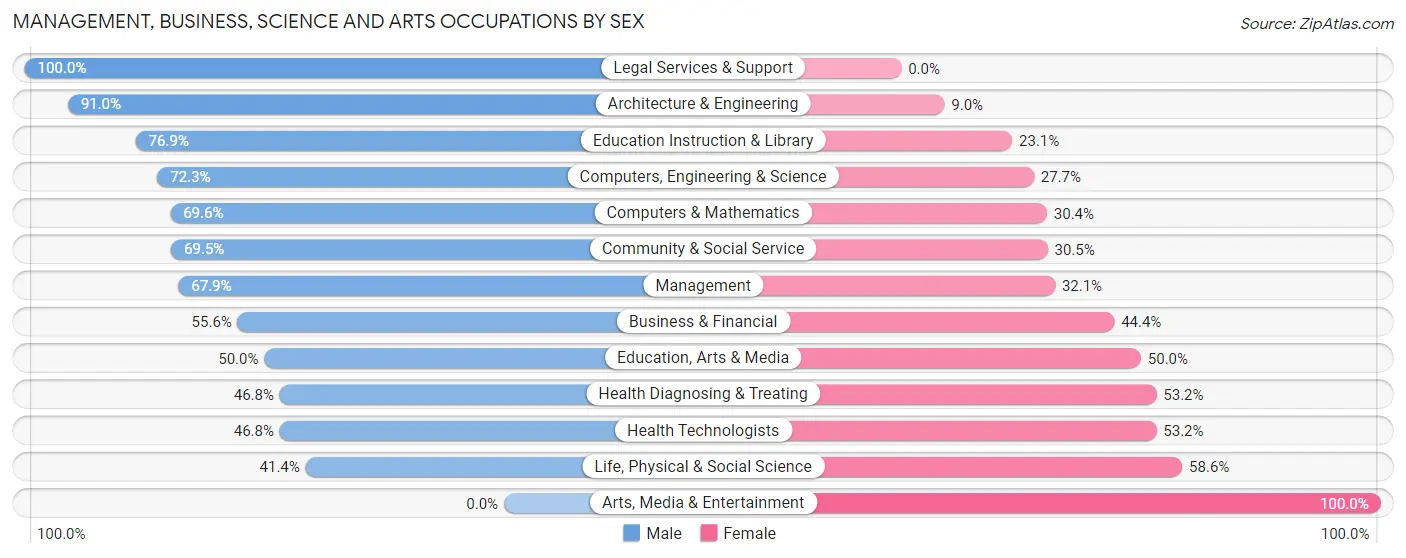
| Occupation | Male | Female |
| Management | 163 (67.9%) | 77 (32.1%) |
| Business & Financial | 80 (55.6%) | 64 (44.4%) |
| Computers, Engineering & Science | 196 (72.3%) | 75 (27.7%) |
| Computers & Mathematics | 71 (69.6%) | 31 (30.4%) |
| Architecture & Engineering | 101 (91.0%) | 10 (9.0%) |
| Life, Physical & Social Science | 24 (41.4%) | 34 (58.6%) |
| Community & Social Service | 232 (69.5%) | 102 (30.5%) |
| Education, Arts & Media | 19 (50.0%) | 19 (50.0%) |
| Legal Services & Support | 37 (100.0%) | 0 (0.0%) |
| Education Instruction & Library | 176 (76.9%) | 53 (23.1%) |
| Arts, Media & Entertainment | 0 (0.0%) | 30 (100.0%) |
| Health Diagnosing & Treating | 94 (46.8%) | 107 (53.2%) |
| Health Technologists | 94 (46.8%) | 107 (53.2%) |
| Total (Category) | 765 (64.3%) | 425 (35.7%) |
| Total (Overall) | 1,022 (57.9%) | 744 (42.1%) |
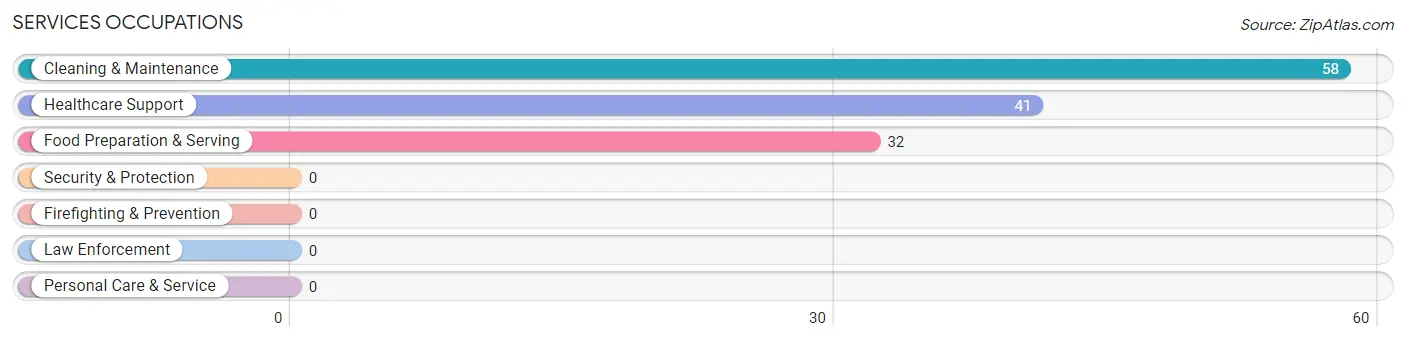
Services Occupations
The most common Services occupations in Placitas CDP Sandoval County are Cleaning & Maintenance (58 | 3.3%), Healthcare Support (41 | 2.3%), and Food Preparation & Serving (32 | 1.8%).
Services Occupations by Sex
Within the Services occupations in Placitas CDP Sandoval County, the most male-oriented occupations are Cleaning & Maintenance (100.0%), and Food Preparation & Serving (59.4%), while the most female-oriented occupations are Healthcare Support (100.0%), and Food Preparation & Serving (40.6%).
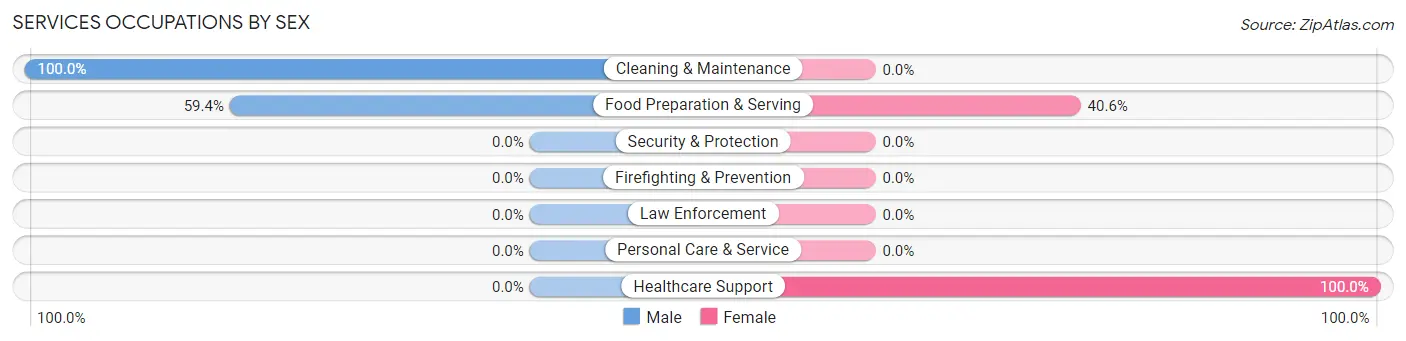
| Occupation | Male | Female |
| Healthcare Support | 0 (0.0%) | 41 (100.0%) |
| Security & Protection | 0 (0.0%) | 0 (0.0%) |
| Firefighting & Prevention | 0 (0.0%) | 0 (0.0%) |
| Law Enforcement | 0 (0.0%) | 0 (0.0%) |
| Food Preparation & Serving | 19 (59.4%) | 13 (40.6%) |
| Cleaning & Maintenance | 58 (100.0%) | 0 (0.0%) |
| Personal Care & Service | 0 (0.0%) | 0 (0.0%) |
| Total (Category) | 77 (58.8%) | 54 (41.2%) |
| Total (Overall) | 1,022 (57.9%) | 744 (42.1%) |
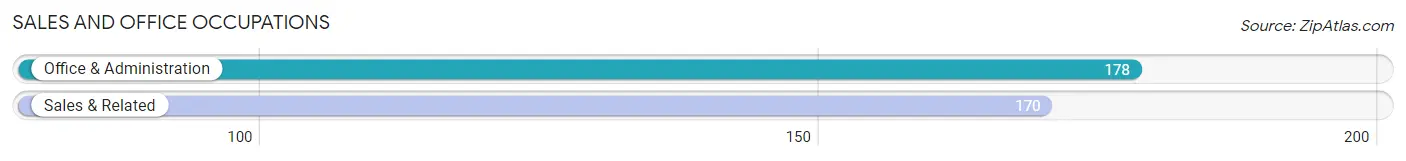
Sales and Office Occupations
The most common Sales and Office occupations in Placitas CDP Sandoval County are Office & Administration (178 | 10.1%), and Sales & Related (170 | 9.6%).
Sales and Office Occupations by Sex
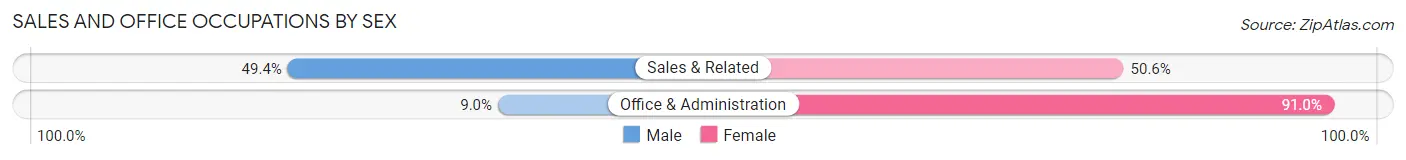
| Occupation | Male | Female |
| Sales & Related | 84 (49.4%) | 86 (50.6%) |
| Office & Administration | 16 (9.0%) | 162 (91.0%) |
| Total (Category) | 100 (28.7%) | 248 (71.3%) |
| Total (Overall) | 1,022 (57.9%) | 744 (42.1%) |
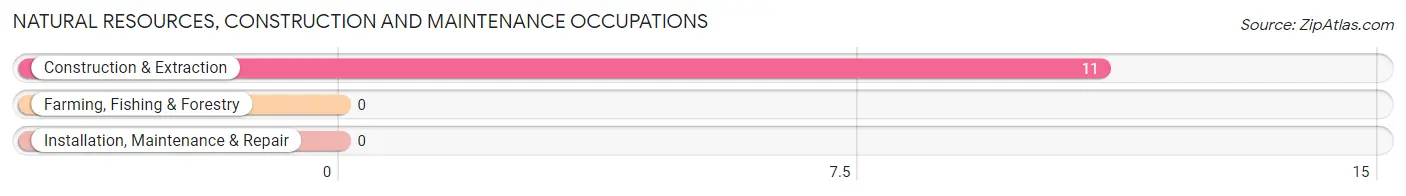
Natural Resources, Construction and Maintenance Occupations
The most common Natural Resources, Construction and Maintenance occupations in Placitas CDP Sandoval County are , and Construction & Extraction (11 | 0.6%).
Natural Resources, Construction and Maintenance Occupations by Sex
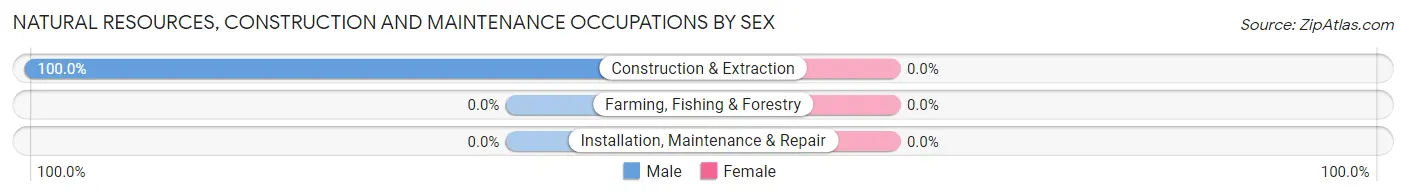
| Occupation | Male | Female |
| Farming, Fishing & Forestry | 0 (0.0%) | 0 (0.0%) |
| Construction & Extraction | 11 (100.0%) | 0 (0.0%) |
| Installation, Maintenance & Repair | 0 (0.0%) | 0 (0.0%) |
| Total (Category) | 11 (100.0%) | 0 (0.0%) |
| Total (Overall) | 1,022 (57.9%) | 744 (42.1%) |
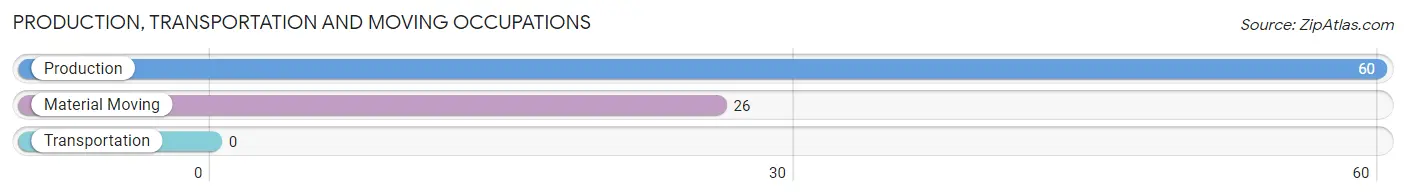
Production, Transportation and Moving Occupations
The most common Production, Transportation and Moving occupations in Placitas CDP Sandoval County are Production (60 | 3.4%), and Material Moving (26 | 1.5%).
Production, Transportation and Moving Occupations by Sex
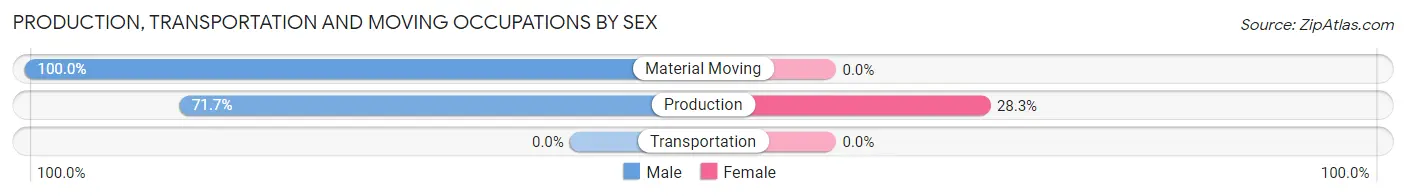
| Occupation | Male | Female |
| Production | 43 (71.7%) | 17 (28.3%) |
| Transportation | 0 (0.0%) | 0 (0.0%) |
| Material Moving | 26 (100.0%) | 0 (0.0%) |
| Total (Category) | 69 (80.2%) | 17 (19.8%) |
| Total (Overall) | 1,022 (57.9%) | 744 (42.1%) |
Employment Industries by Sex in Placitas CDP Sandoval County
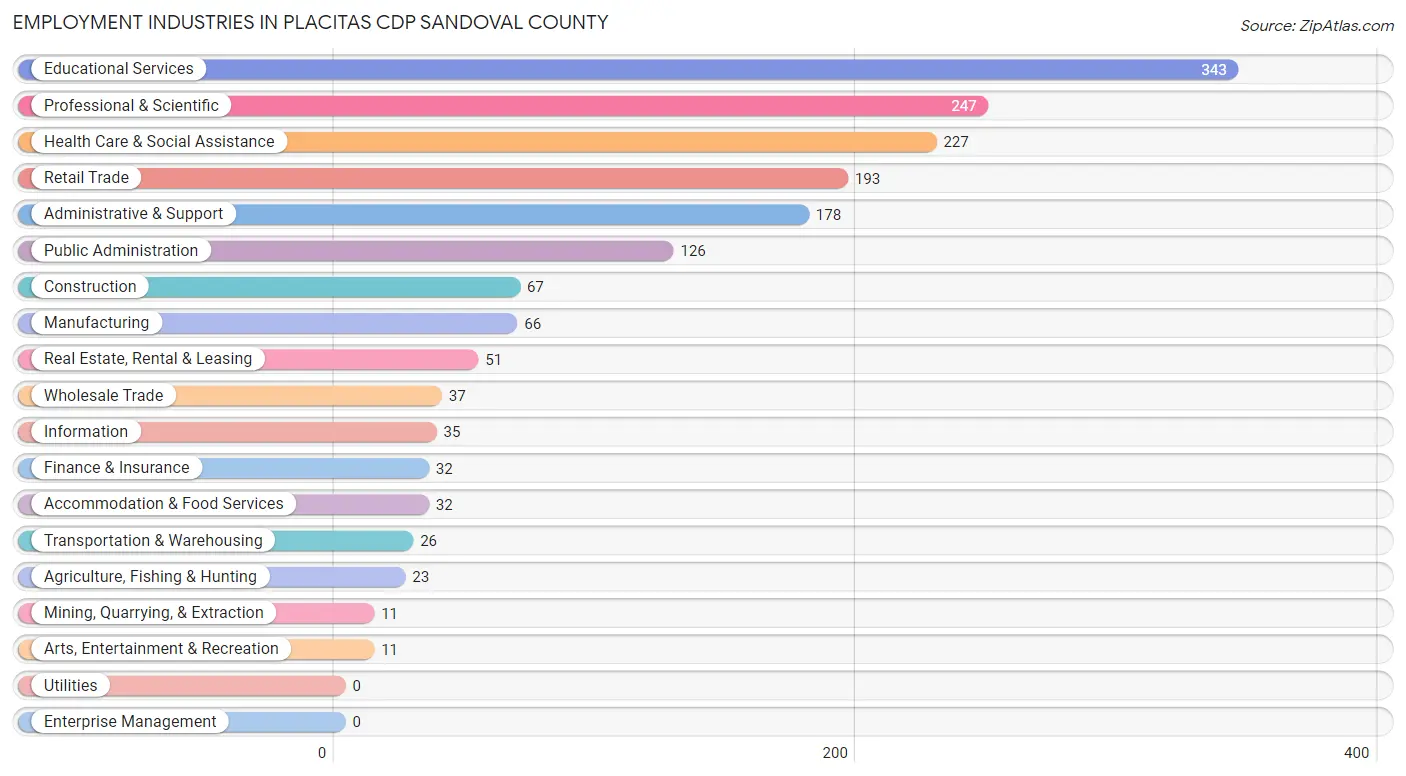
Employment Industries in Placitas CDP Sandoval County
The major employment industries in Placitas CDP Sandoval County include Educational Services (343 | 19.4%), Professional & Scientific (247 | 14.0%), Health Care & Social Assistance (227 | 12.9%), Retail Trade (193 | 10.9%), and Administrative & Support (178 | 10.1%).
Employment Industries by Sex in Placitas CDP Sandoval County
The Placitas CDP Sandoval County industries that see more men than women are Agriculture, Fishing & Hunting (100.0%), Mining, Quarrying, & Extraction (100.0%), and Construction (100.0%), whereas the industries that tend to have a higher number of women are Arts, Entertainment & Recreation (100.0%), Health Care & Social Assistance (77.5%), and Real Estate, Rental & Leasing (74.5%).
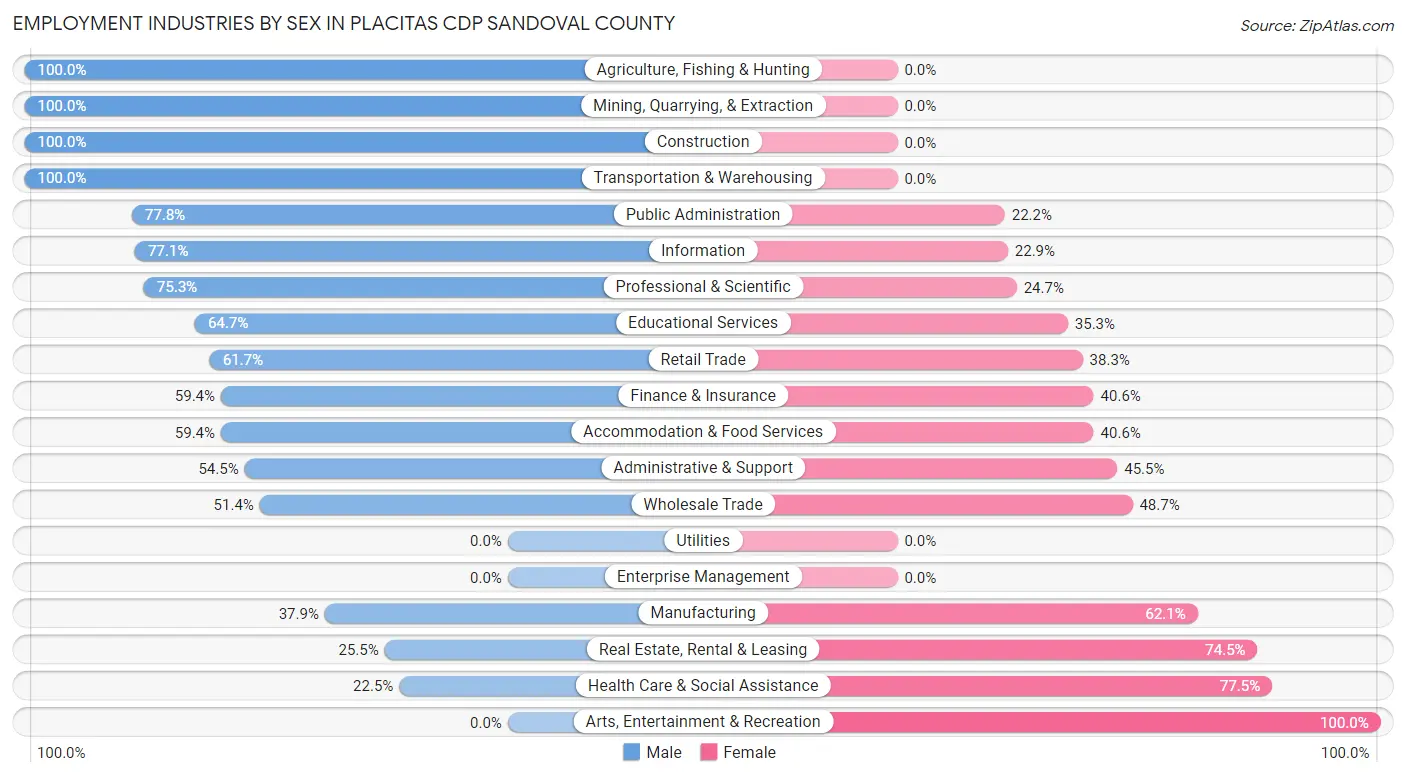
| Industry | Male | Female |
| Agriculture, Fishing & Hunting | 23 (100.0%) | 0 (0.0%) |
| Mining, Quarrying, & Extraction | 11 (100.0%) | 0 (0.0%) |
| Construction | 67 (100.0%) | 0 (0.0%) |
| Manufacturing | 25 (37.9%) | 41 (62.1%) |
| Wholesale Trade | 19 (51.3%) | 18 (48.6%) |
| Retail Trade | 119 (61.7%) | 74 (38.3%) |
| Transportation & Warehousing | 26 (100.0%) | 0 (0.0%) |
| Utilities | 0 (0.0%) | 0 (0.0%) |
| Information | 27 (77.1%) | 8 (22.9%) |
| Finance & Insurance | 19 (59.4%) | 13 (40.6%) |
| Real Estate, Rental & Leasing | 13 (25.5%) | 38 (74.5%) |
| Professional & Scientific | 186 (75.3%) | 61 (24.7%) |
| Enterprise Management | 0 (0.0%) | 0 (0.0%) |
| Administrative & Support | 97 (54.5%) | 81 (45.5%) |
| Educational Services | 222 (64.7%) | 121 (35.3%) |
| Health Care & Social Assistance | 51 (22.5%) | 176 (77.5%) |
| Arts, Entertainment & Recreation | 0 (0.0%) | 11 (100.0%) |
| Accommodation & Food Services | 19 (59.4%) | 13 (40.6%) |
| Public Administration | 98 (77.8%) | 28 (22.2%) |
| Total | 1,022 (57.9%) | 744 (42.1%) |
Education in Placitas CDP Sandoval County
School Enrollment in Placitas CDP Sandoval County
The most common levels of schooling among the 228 students in Placitas CDP Sandoval County are high school (82 | 36.0%), college / undergraduate (56 | 24.6%), and graduate / professional (40 | 17.5%).
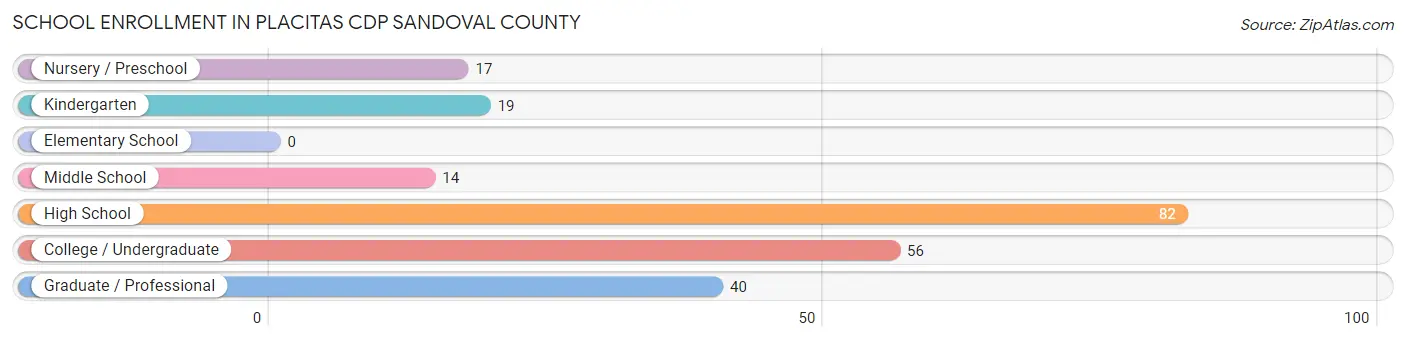
| School Level | # Students | % Students |
| Nursery / Preschool | 17 | 7.5% |
| Kindergarten | 19 | 8.3% |
| Elementary School | 0 | 0.0% |
| Middle School | 14 | 6.1% |
| High School | 82 | 36.0% |
| College / Undergraduate | 56 | 24.6% |
| Graduate / Professional | 40 | 17.5% |
| Total | 228 | 100.0% |
School Enrollment by Age by Funding Source in Placitas CDP Sandoval County
Out of a total of 228 students who are enrolled in schools in Placitas CDP Sandoval County, 78 (34.2%) attend a private institution, while the remaining 150 (65.8%) are enrolled in public schools. The age group of 3 to 4 year olds has the highest likelihood of being enrolled in private schools, with 17 (100.0% in the age bracket) enrolled. Conversely, the age group of 20 to 24 year olds has the lowest likelihood of being enrolled in a private school, with 19 (100.0% in the age bracket) attending a public institution.
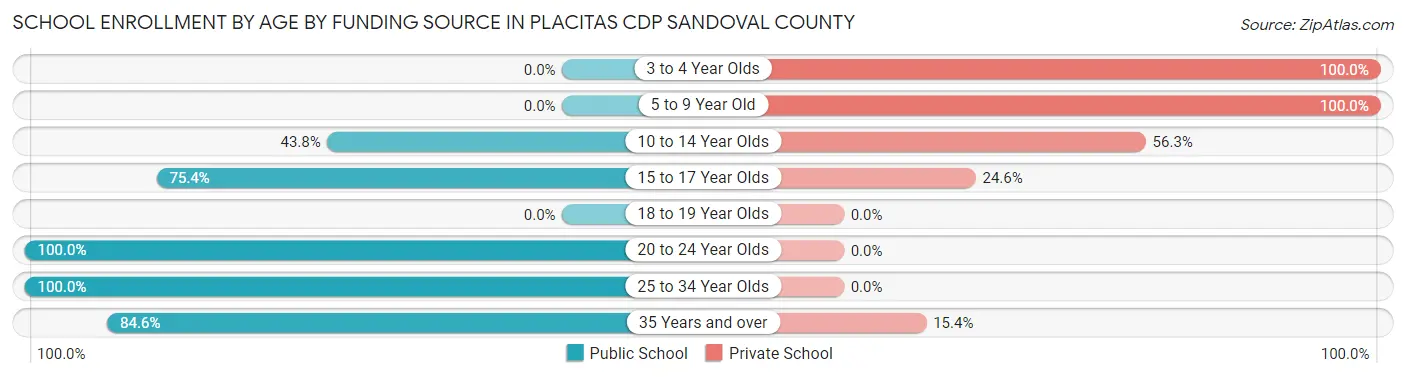
| Age Bracket | Public School | Private School |
| 3 to 4 Year Olds | 0 (0.0%) | 17 (100.0%) |
| 5 to 9 Year Old | 0 (0.0%) | 19 (100.0%) |
| 10 to 14 Year Olds | 14 (43.8%) | 18 (56.2%) |
| 15 to 17 Year Olds | 43 (75.4%) | 14 (24.6%) |
| 18 to 19 Year Olds | 0 (0.0%) | 0 (0.0%) |
| 20 to 24 Year Olds | 19 (100.0%) | 0 (0.0%) |
| 25 to 34 Year Olds | 19 (100.0%) | 0 (0.0%) |
| 35 Years and over | 55 (84.6%) | 10 (15.4%) |
| Total | 150 (65.8%) | 78 (34.2%) |
Educational Attainment by Field of Study in Placitas CDP Sandoval County
Business (497 | 18.5%), bio, nature & agricultural (323 | 12.0%), science & technology (274 | 10.2%), engineering (252 | 9.4%), and social sciences (186 | 6.9%) are the most common fields of study among 2,683 individuals in Placitas CDP Sandoval County who have obtained a bachelor's degree or higher.
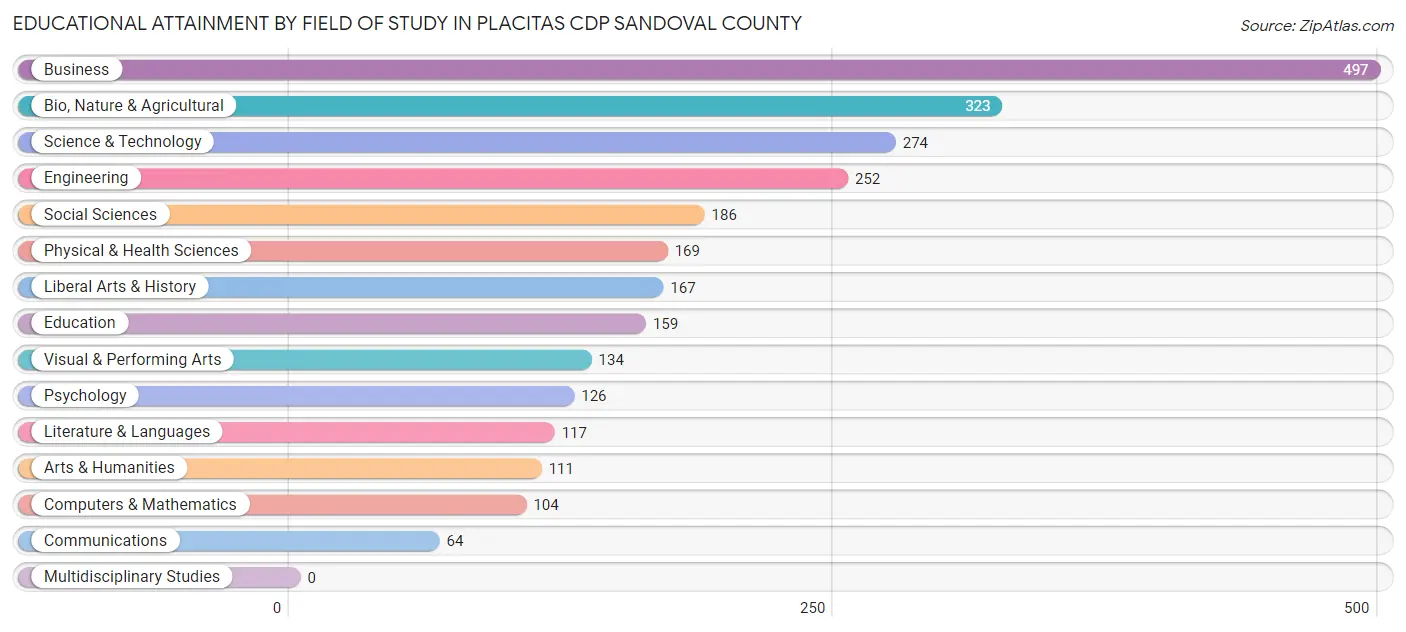
| Field of Study | # Graduates | % Graduates |
| Computers & Mathematics | 104 | 3.9% |
| Bio, Nature & Agricultural | 323 | 12.0% |
| Physical & Health Sciences | 169 | 6.3% |
| Psychology | 126 | 4.7% |
| Social Sciences | 186 | 6.9% |
| Engineering | 252 | 9.4% |
| Multidisciplinary Studies | 0 | 0.0% |
| Science & Technology | 274 | 10.2% |
| Business | 497 | 18.5% |
| Education | 159 | 5.9% |
| Literature & Languages | 117 | 4.4% |
| Liberal Arts & History | 167 | 6.2% |
| Visual & Performing Arts | 134 | 5.0% |
| Communications | 64 | 2.4% |
| Arts & Humanities | 111 | 4.1% |
| Total | 2,683 | 100.0% |
Transportation & Commute in Placitas CDP Sandoval County
Vehicle Availability by Sex in Placitas CDP Sandoval County
The most prevalent vehicle ownership categories in Placitas CDP Sandoval County are males with 2 vehicles (409, accounting for 42.0%) and females with 2 vehicles (297, making up 55.0%).
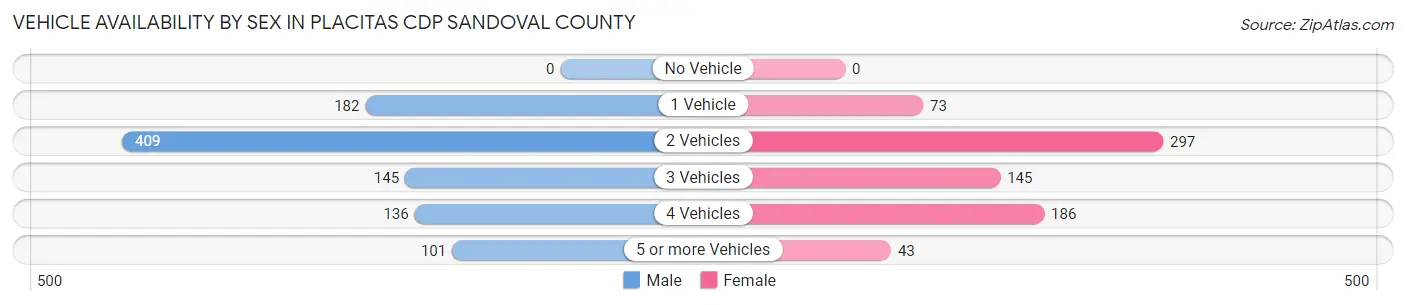
| Vehicles Available | Male | Female |
| No Vehicle | 0 (0.0%) | 0 (0.0%) |
| 1 Vehicle | 182 (18.7%) | 73 (9.8%) |
| 2 Vehicles | 409 (42.0%) | 297 (39.9%) |
| 3 Vehicles | 145 (14.9%) | 145 (19.5%) |
| 4 Vehicles | 136 (14.0%) | 186 (25.0%) |
| 5 or more Vehicles | 101 (10.4%) | 43 (5.8%) |
| Total | 973 (100.0%) | 744 (100.0%) |
Commute Time in Placitas CDP Sandoval County
The most frequently occuring commute durations in Placitas CDP Sandoval County are 30 to 34 minutes (365 commuters, 27.0%), 25 to 29 minutes (254 commuters, 18.8%), and 40 to 44 minutes (138 commuters, 10.2%).
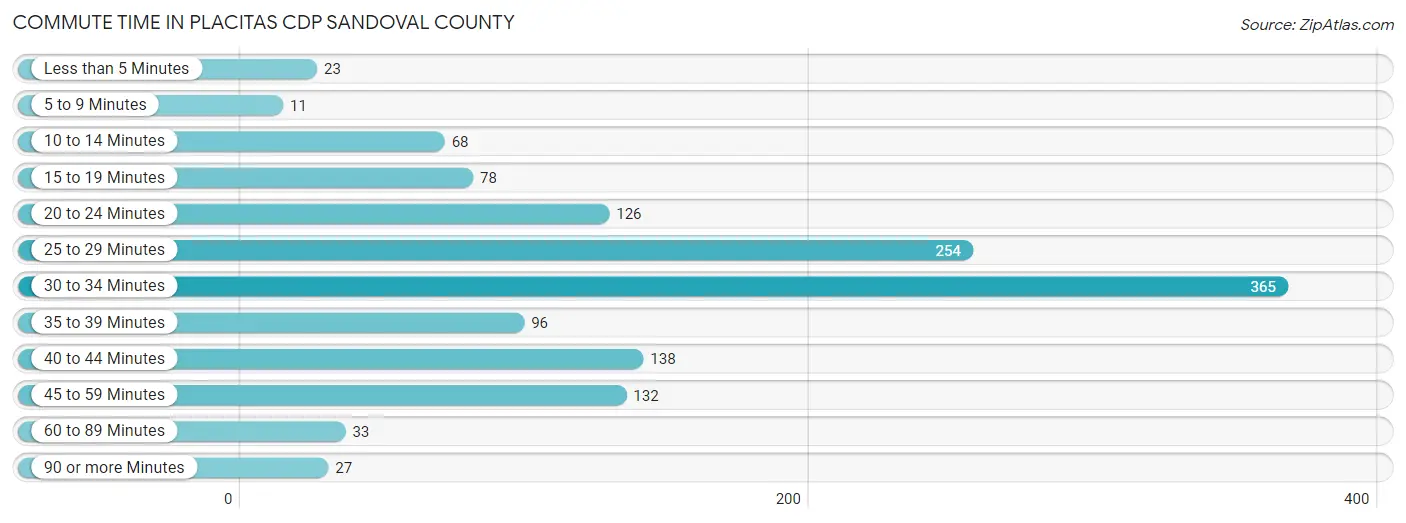
| Commute Time | # Commuters | % Commuters |
| Less than 5 Minutes | 23 | 1.7% |
| 5 to 9 Minutes | 11 | 0.8% |
| 10 to 14 Minutes | 68 | 5.0% |
| 15 to 19 Minutes | 78 | 5.8% |
| 20 to 24 Minutes | 126 | 9.3% |
| 25 to 29 Minutes | 254 | 18.8% |
| 30 to 34 Minutes | 365 | 27.0% |
| 35 to 39 Minutes | 96 | 7.1% |
| 40 to 44 Minutes | 138 | 10.2% |
| 45 to 59 Minutes | 132 | 9.8% |
| 60 to 89 Minutes | 33 | 2.4% |
| 90 or more Minutes | 27 | 2.0% |
Commute Time by Sex in Placitas CDP Sandoval County
The most common commute times in Placitas CDP Sandoval County are 30 to 34 minutes (249 commuters, 31.5%) for males and 20 to 24 minutes (119 commuters, 21.2%) for females.
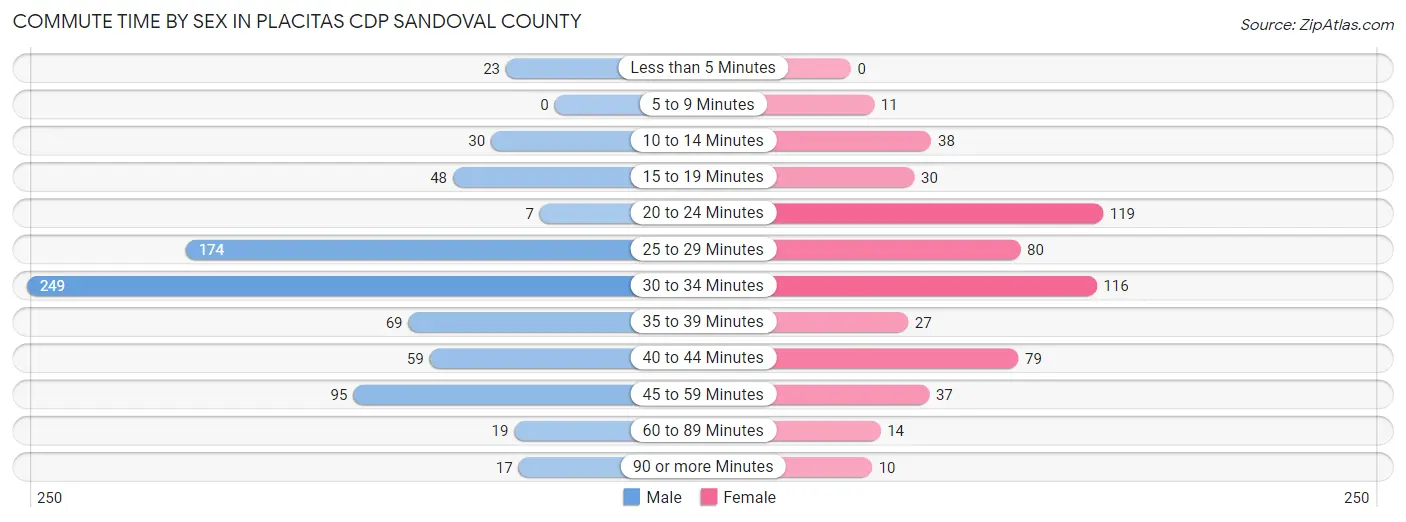
| Commute Time | Male | Female |
| Less than 5 Minutes | 23 (2.9%) | 0 (0.0%) |
| 5 to 9 Minutes | 0 (0.0%) | 11 (2.0%) |
| 10 to 14 Minutes | 30 (3.8%) | 38 (6.8%) |
| 15 to 19 Minutes | 48 (6.1%) | 30 (5.3%) |
| 20 to 24 Minutes | 7 (0.9%) | 119 (21.2%) |
| 25 to 29 Minutes | 174 (22.0%) | 80 (14.3%) |
| 30 to 34 Minutes | 249 (31.5%) | 116 (20.7%) |
| 35 to 39 Minutes | 69 (8.7%) | 27 (4.8%) |
| 40 to 44 Minutes | 59 (7.5%) | 79 (14.1%) |
| 45 to 59 Minutes | 95 (12.0%) | 37 (6.6%) |
| 60 to 89 Minutes | 19 (2.4%) | 14 (2.5%) |
| 90 or more Minutes | 17 (2.1%) | 10 (1.8%) |
Time of Departure to Work by Sex in Placitas CDP Sandoval County
The most frequent times of departure to work in Placitas CDP Sandoval County are 7:00 AM to 7:29 AM (169, 21.4%) for males and 6:30 AM to 6:59 AM (218, 38.9%) for females.
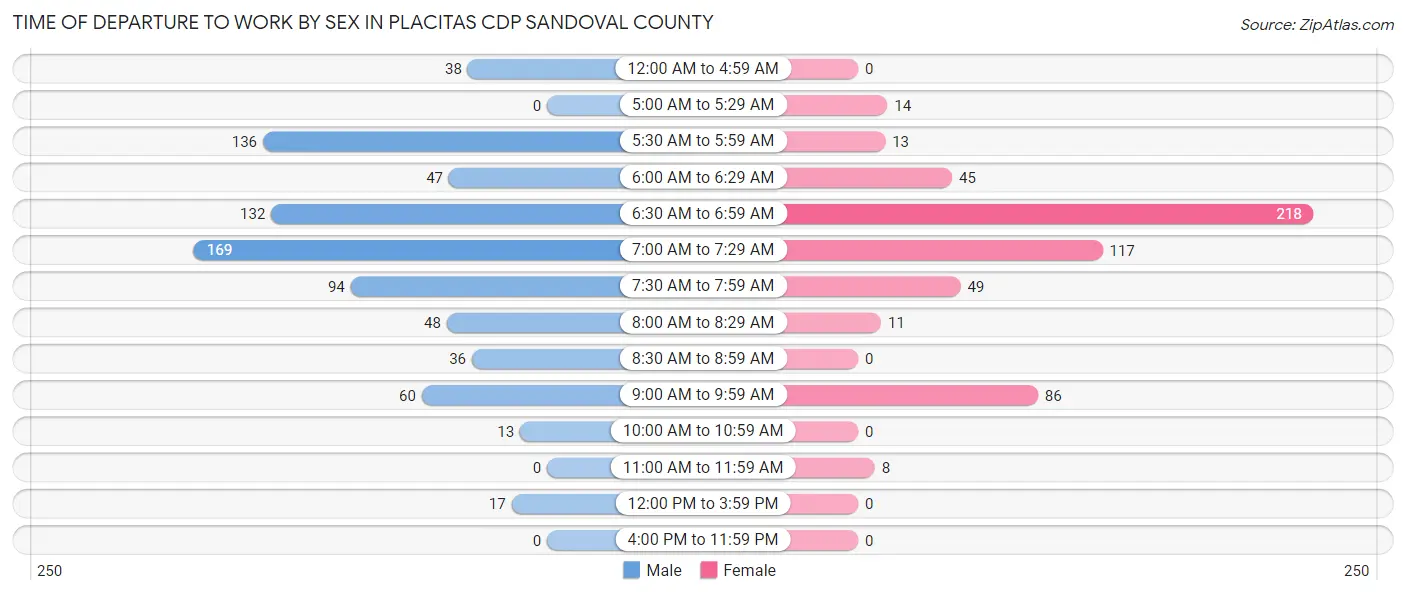
| Time of Departure | Male | Female |
| 12:00 AM to 4:59 AM | 38 (4.8%) | 0 (0.0%) |
| 5:00 AM to 5:29 AM | 0 (0.0%) | 14 (2.5%) |
| 5:30 AM to 5:59 AM | 136 (17.2%) | 13 (2.3%) |
| 6:00 AM to 6:29 AM | 47 (5.9%) | 45 (8.0%) |
| 6:30 AM to 6:59 AM | 132 (16.7%) | 218 (38.9%) |
| 7:00 AM to 7:29 AM | 169 (21.4%) | 117 (20.9%) |
| 7:30 AM to 7:59 AM | 94 (11.9%) | 49 (8.7%) |
| 8:00 AM to 8:29 AM | 48 (6.1%) | 11 (2.0%) |
| 8:30 AM to 8:59 AM | 36 (4.6%) | 0 (0.0%) |
| 9:00 AM to 9:59 AM | 60 (7.6%) | 86 (15.3%) |
| 10:00 AM to 10:59 AM | 13 (1.7%) | 0 (0.0%) |
| 11:00 AM to 11:59 AM | 0 (0.0%) | 8 (1.4%) |
| 12:00 PM to 3:59 PM | 17 (2.1%) | 0 (0.0%) |
| 4:00 PM to 11:59 PM | 0 (0.0%) | 0 (0.0%) |
| Total | 790 (100.0%) | 561 (100.0%) |
Housing Occupancy in Placitas CDP Sandoval County
Occupancy by Ownership in Placitas CDP Sandoval County
Of the total 2,015 dwellings in Placitas CDP Sandoval County, owner-occupied units account for 1,882 (93.4%), while renter-occupied units make up 133 (6.6%).
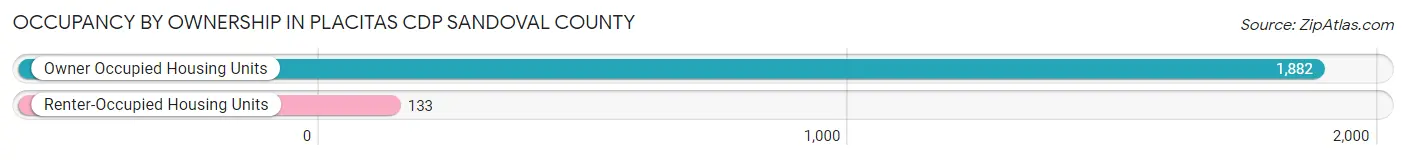
| Occupancy | # Housing Units | % Housing Units |
| Owner Occupied Housing Units | 1,882 | 93.4% |
| Renter-Occupied Housing Units | 133 | 6.6% |
| Total Occupied Housing Units | 2,015 | 100.0% |
Occupancy by Household Size in Placitas CDP Sandoval County
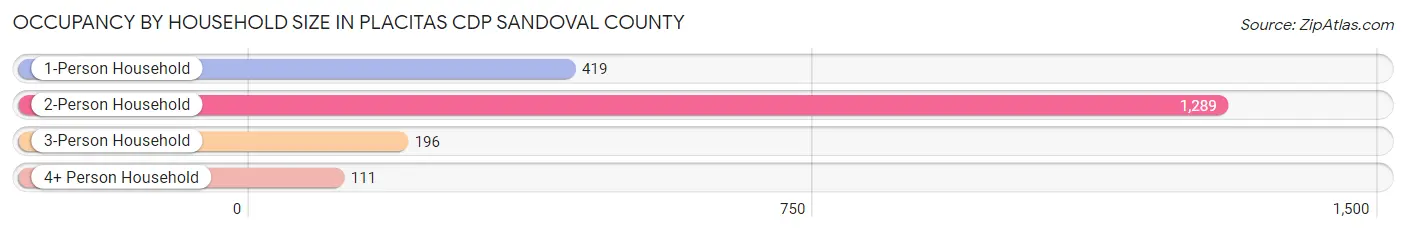
| Household Size | # Housing Units | % Housing Units |
| 1-Person Household | 419 | 20.8% |
| 2-Person Household | 1,289 | 64.0% |
| 3-Person Household | 196 | 9.7% |
| 4+ Person Household | 111 | 5.5% |
| Total Housing Units | 2,015 | 100.0% |
Occupancy by Ownership by Household Size in Placitas CDP Sandoval County
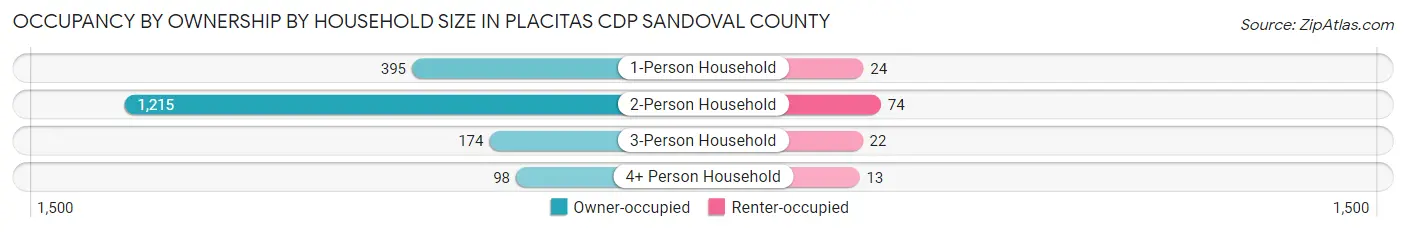
| Household Size | Owner-occupied | Renter-occupied |
| 1-Person Household | 395 (94.3%) | 24 (5.7%) |
| 2-Person Household | 1,215 (94.3%) | 74 (5.7%) |
| 3-Person Household | 174 (88.8%) | 22 (11.2%) |
| 4+ Person Household | 98 (88.3%) | 13 (11.7%) |
| Total Housing Units | 1,882 (93.4%) | 133 (6.6%) |
Occupancy by Educational Attainment in Placitas CDP Sandoval County
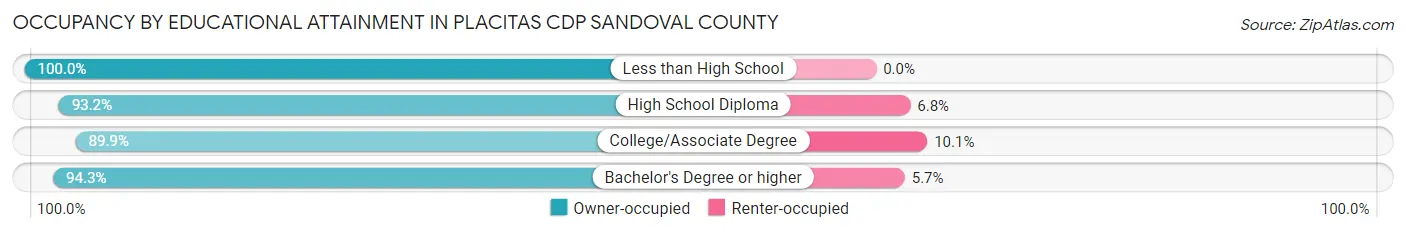
| Household Size | Owner-occupied | Renter-occupied |
| Less than High School | 40 (100.0%) | 0 (0.0%) |
| High School Diploma | 179 (93.2%) | 13 (6.8%) |
| College/Associate Degree | 382 (89.9%) | 43 (10.1%) |
| Bachelor's Degree or higher | 1,281 (94.3%) | 77 (5.7%) |
Occupancy by Age of Householder in Placitas CDP Sandoval County
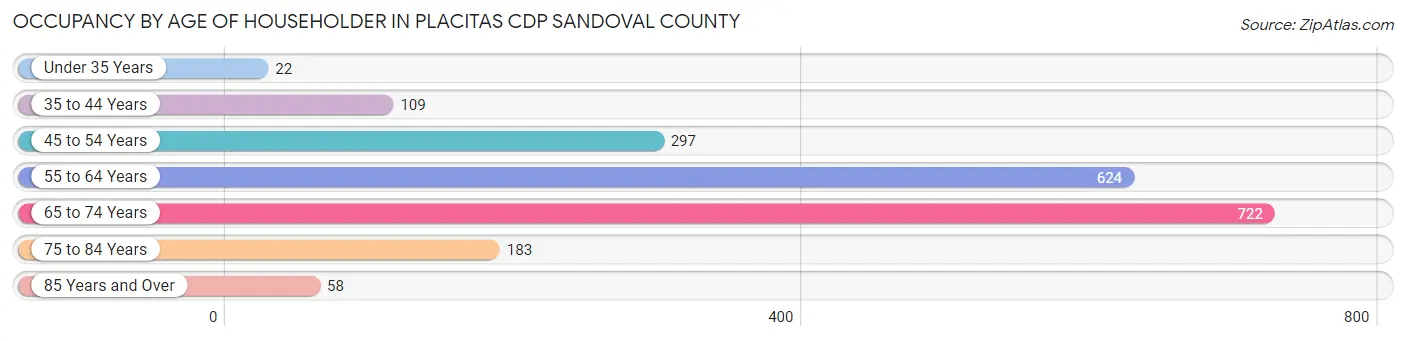
| Age Bracket | # Households | % Households |
| Under 35 Years | 22 | 1.1% |
| 35 to 44 Years | 109 | 5.4% |
| 45 to 54 Years | 297 | 14.7% |
| 55 to 64 Years | 624 | 31.0% |
| 65 to 74 Years | 722 | 35.8% |
| 75 to 84 Years | 183 | 9.1% |
| 85 Years and Over | 58 | 2.9% |
| Total | 2,015 | 100.0% |
Housing Finances in Placitas CDP Sandoval County
Median Income by Occupancy in Placitas CDP Sandoval County
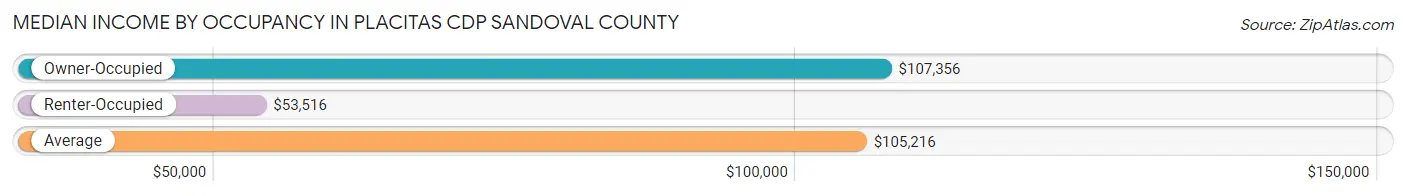
| Occupancy Type | # Households | Median Income |
| Owner-Occupied | 1,882 (93.4%) | $107,356 |
| Renter-Occupied | 133 (6.6%) | $53,516 |
| Average | 2,015 (100.0%) | $105,216 |
Occupancy by Householder Income Bracket in Placitas CDP Sandoval County
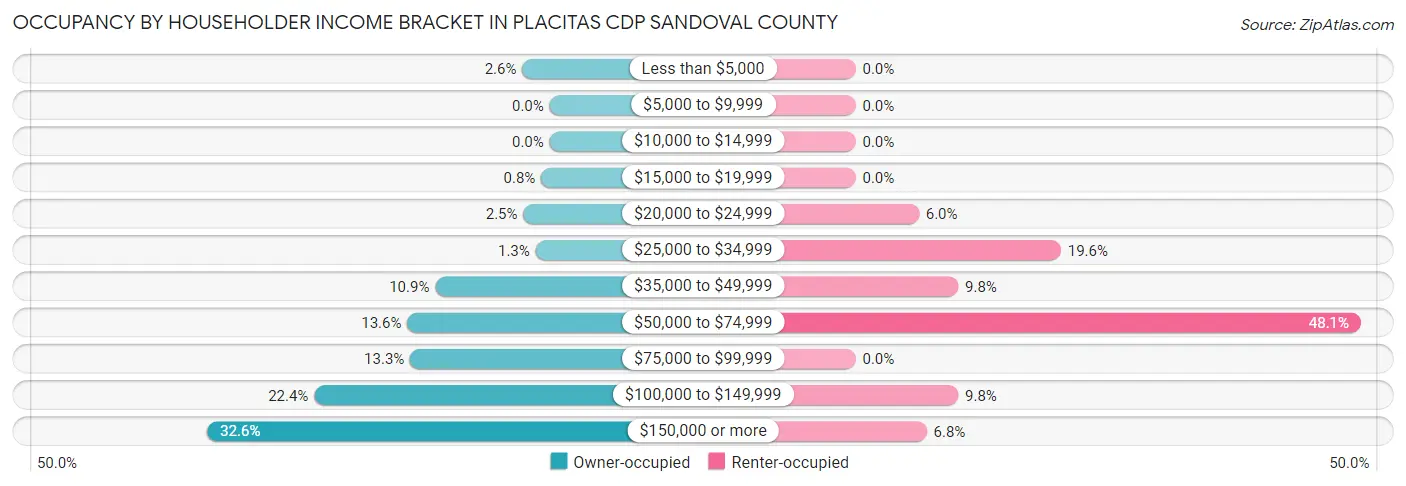
| Income Bracket | Owner-occupied | Renter-occupied |
| Less than $5,000 | 49 (2.6%) | 0 (0.0%) |
| $5,000 to $9,999 | 0 (0.0%) | 0 (0.0%) |
| $10,000 to $14,999 | 0 (0.0%) | 0 (0.0%) |
| $15,000 to $19,999 | 15 (0.8%) | 0 (0.0%) |
| $20,000 to $24,999 | 47 (2.5%) | 8 (6.0%) |
| $25,000 to $34,999 | 25 (1.3%) | 26 (19.6%) |
| $35,000 to $49,999 | 205 (10.9%) | 13 (9.8%) |
| $50,000 to $74,999 | 255 (13.6%) | 64 (48.1%) |
| $75,000 to $99,999 | 250 (13.3%) | 0 (0.0%) |
| $100,000 to $149,999 | 422 (22.4%) | 13 (9.8%) |
| $150,000 or more | 614 (32.6%) | 9 (6.8%) |
| Total | 1,882 (100.0%) | 133 (100.0%) |
Monthly Housing Cost Tiers in Placitas CDP Sandoval County
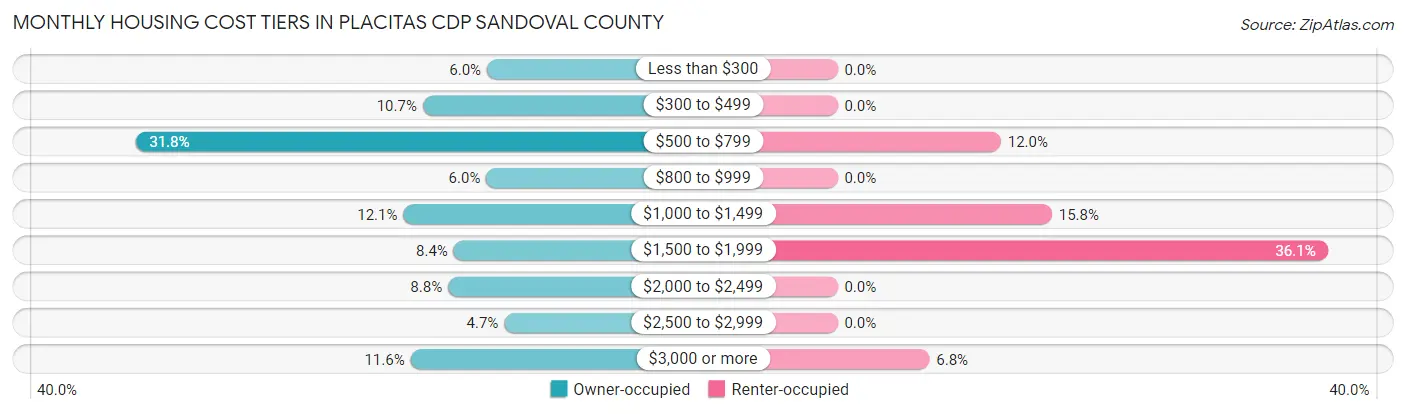
| Monthly Cost | Owner-occupied | Renter-occupied |
| Less than $300 | 112 (5.9%) | 0 (0.0%) |
| $300 to $499 | 201 (10.7%) | 0 (0.0%) |
| $500 to $799 | 598 (31.8%) | 16 (12.0%) |
| $800 to $999 | 113 (6.0%) | 0 (0.0%) |
| $1,000 to $1,499 | 228 (12.1%) | 21 (15.8%) |
| $1,500 to $1,999 | 158 (8.4%) | 48 (36.1%) |
| $2,000 to $2,499 | 166 (8.8%) | 0 (0.0%) |
| $2,500 to $2,999 | 88 (4.7%) | 0 (0.0%) |
| $3,000 or more | 218 (11.6%) | 9 (6.8%) |
| Total | 1,882 (100.0%) | 133 (100.0%) |
Physical Housing Characteristics in Placitas CDP Sandoval County
Housing Structures in Placitas CDP Sandoval County
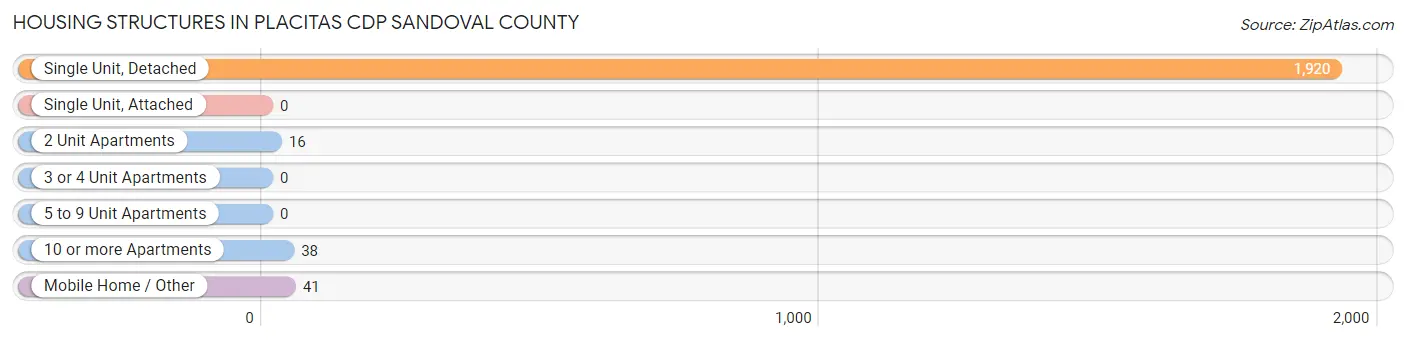
| Structure Type | # Housing Units | % Housing Units |
| Single Unit, Detached | 1,920 | 95.3% |
| Single Unit, Attached | 0 | 0.0% |
| 2 Unit Apartments | 16 | 0.8% |
| 3 or 4 Unit Apartments | 0 | 0.0% |
| 5 to 9 Unit Apartments | 0 | 0.0% |
| 10 or more Apartments | 38 | 1.9% |
| Mobile Home / Other | 41 | 2.0% |
| Total | 2,015 | 100.0% |
Housing Structures by Occupancy in Placitas CDP Sandoval County
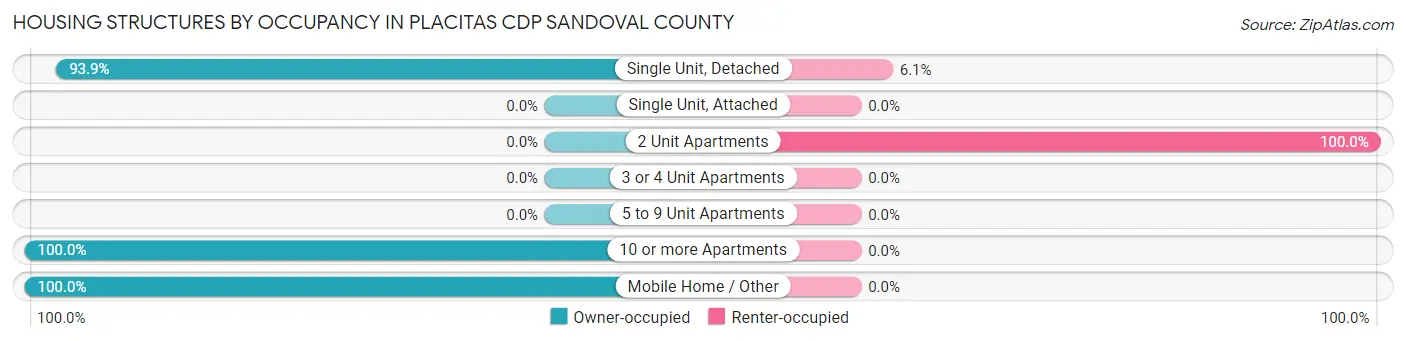
| Structure Type | Owner-occupied | Renter-occupied |
| Single Unit, Detached | 1,803 (93.9%) | 117 (6.1%) |
| Single Unit, Attached | 0 (0.0%) | 0 (0.0%) |
| 2 Unit Apartments | 0 (0.0%) | 16 (100.0%) |
| 3 or 4 Unit Apartments | 0 (0.0%) | 0 (0.0%) |
| 5 to 9 Unit Apartments | 0 (0.0%) | 0 (0.0%) |
| 10 or more Apartments | 38 (100.0%) | 0 (0.0%) |
| Mobile Home / Other | 41 (100.0%) | 0 (0.0%) |
| Total | 1,882 (93.4%) | 133 (6.6%) |
Housing Structures by Number of Rooms in Placitas CDP Sandoval County
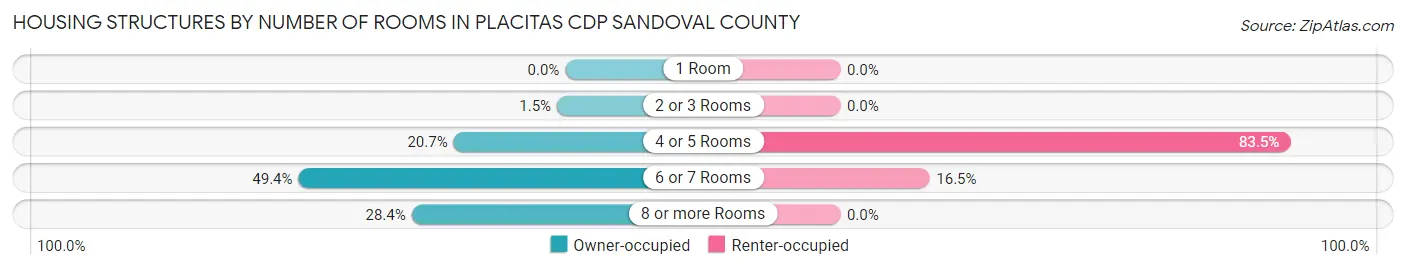
| Number of Rooms | Owner-occupied | Renter-occupied |
| 1 Room | 0 (0.0%) | 0 (0.0%) |
| 2 or 3 Rooms | 29 (1.5%) | 0 (0.0%) |
| 4 or 5 Rooms | 389 (20.7%) | 111 (83.5%) |
| 6 or 7 Rooms | 929 (49.4%) | 22 (16.5%) |
| 8 or more Rooms | 535 (28.4%) | 0 (0.0%) |
| Total | 1,882 (100.0%) | 133 (100.0%) |
Housing Structure by Heating Type in Placitas CDP Sandoval County
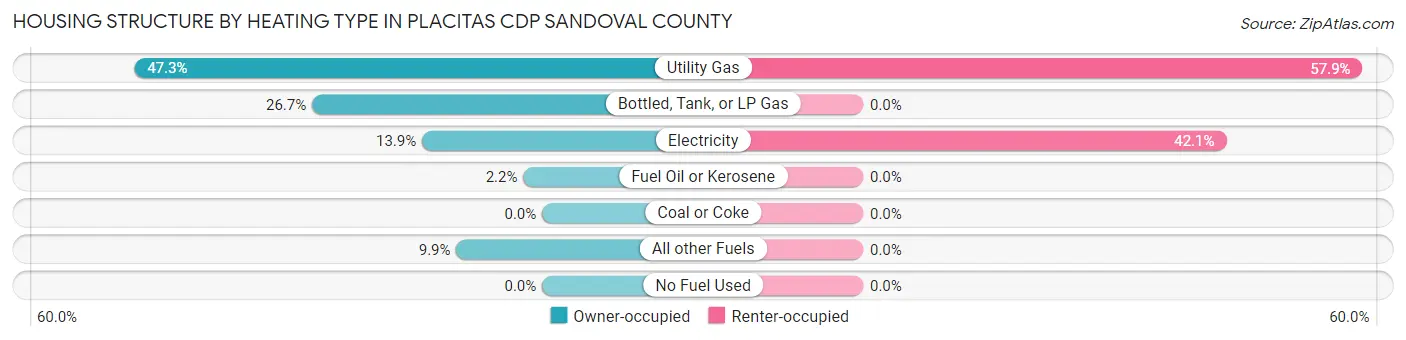
| Heating Type | Owner-occupied | Renter-occupied |
| Utility Gas | 890 (47.3%) | 77 (57.9%) |
| Bottled, Tank, or LP Gas | 502 (26.7%) | 0 (0.0%) |
| Electricity | 262 (13.9%) | 56 (42.1%) |
| Fuel Oil or Kerosene | 41 (2.2%) | 0 (0.0%) |
| Coal or Coke | 0 (0.0%) | 0 (0.0%) |
| All other Fuels | 187 (9.9%) | 0 (0.0%) |
| No Fuel Used | 0 (0.0%) | 0 (0.0%) |
| Total | 1,882 (100.0%) | 133 (100.0%) |
Household Vehicle Usage in Placitas CDP Sandoval County
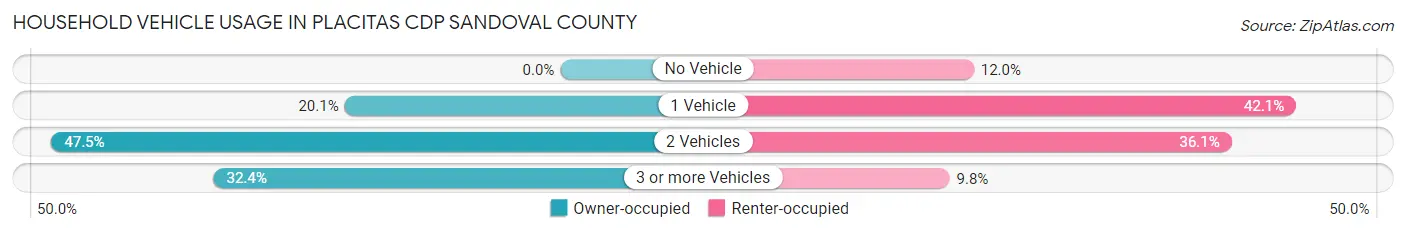
| Vehicles per Household | Owner-occupied | Renter-occupied |
| No Vehicle | 0 (0.0%) | 16 (12.0%) |
| 1 Vehicle | 379 (20.1%) | 56 (42.1%) |
| 2 Vehicles | 894 (47.5%) | 48 (36.1%) |
| 3 or more Vehicles | 609 (32.4%) | 13 (9.8%) |
| Total | 1,882 (100.0%) | 133 (100.0%) |
Real Estate & Mortgages in Placitas CDP Sandoval County
Real Estate and Mortgage Overview in Placitas CDP Sandoval County
| Characteristic | Without Mortgage | With Mortgage |
| Housing Units | 978 | 904 |
| Median Property Value | $450,000 | $516,500 |
| Median Household Income | $93,988 | $411 |
| Monthly Housing Costs | $574 | $218 |
| Real Estate Taxes | $2,873 | $0 |
Property Value by Mortgage Status in Placitas CDP Sandoval County
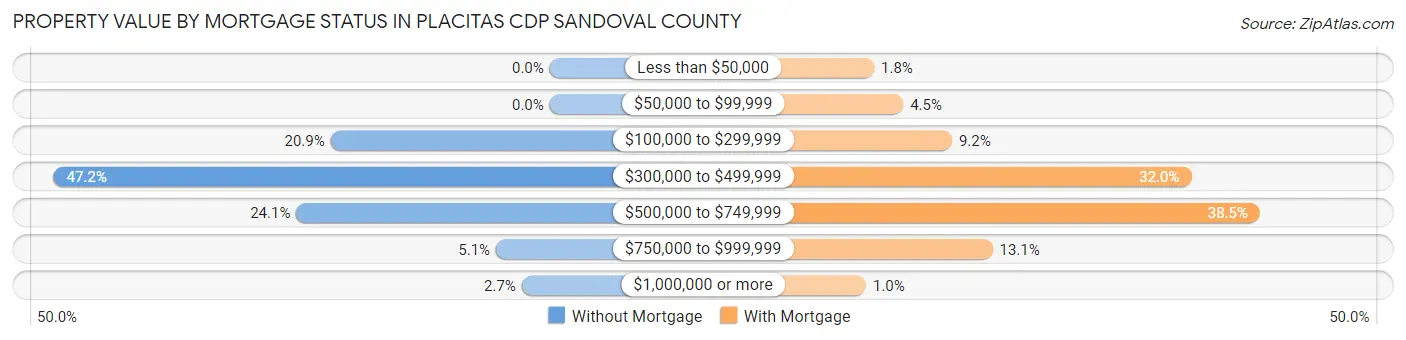
| Property Value | Without Mortgage | With Mortgage |
| Less than $50,000 | 0 (0.0%) | 16 (1.8%) |
| $50,000 to $99,999 | 0 (0.0%) | 41 (4.5%) |
| $100,000 to $299,999 | 204 (20.9%) | 83 (9.2%) |
| $300,000 to $499,999 | 462 (47.2%) | 289 (32.0%) |
| $500,000 to $749,999 | 236 (24.1%) | 348 (38.5%) |
| $750,000 to $999,999 | 50 (5.1%) | 118 (13.1%) |
| $1,000,000 or more | 26 (2.7%) | 9 (1.0%) |
| Total | 978 (100.0%) | 904 (100.0%) |
Household Income by Mortgage Status in Placitas CDP Sandoval County
| Household Income | Without Mortgage | With Mortgage |
| Less than $10,000 | 49 (5.0%) | 0 (0.0%) |
| $10,000 to $24,999 | 38 (3.9%) | 0 (0.0%) |
| $25,000 to $34,999 | 11 (1.1%) | 24 (2.6%) |
| $35,000 to $49,999 | 137 (14.0%) | 14 (1.5%) |
| $50,000 to $74,999 | 143 (14.6%) | 68 (7.5%) |
| $75,000 to $99,999 | 160 (16.4%) | 112 (12.4%) |
| $100,000 to $149,999 | 237 (24.2%) | 90 (10.0%) |
| $150,000 or more | 203 (20.8%) | 185 (20.5%) |
| Total | 978 (100.0%) | 904 (100.0%) |
Property Value to Household Income Ratio in Placitas CDP Sandoval County
| Value-to-Income Ratio | Without Mortgage | With Mortgage |
| Less than 2.0x | 66 (6.8%) | 148,066 (16,379.0%) |
| 2.0x to 2.9x | 111 (11.4%) | 235 (26.0%) |
| 3.0x to 3.9x | 258 (26.4%) | 146 (16.2%) |
| 4.0x or more | 543 (55.5%) | 121 (13.4%) |
| Total | 978 (100.0%) | 904 (100.0%) |
Real Estate Taxes by Mortgage Status in Placitas CDP Sandoval County
| Property Taxes | Without Mortgage | With Mortgage |
| Less than $800 | 25 (2.6%) | 0 (0.0%) |
| $800 to $1,499 | 67 (6.9%) | 57 (6.3%) |
| $800 to $1,499 | 811 (82.9%) | 66 (7.3%) |
| Total | 978 (100.0%) | 904 (100.0%) |
Health & Disability in Placitas CDP Sandoval County
Health Insurance Coverage by Age in Placitas CDP Sandoval County
| Age Bracket | With Coverage | Without Coverage |
| Under 6 Years | 109 (100.0%) | 0 (0.0%) |
| 6 to 18 Years | 108 (100.0%) | 0 (0.0%) |
| 19 to 25 Years | 85 (100.0%) | 0 (0.0%) |
| 26 to 34 Years | 91 (100.0%) | 0 (0.0%) |
| 35 to 44 Years | 419 (100.0%) | 0 (0.0%) |
| 45 to 54 Years | 522 (100.0%) | 0 (0.0%) |
| 55 to 64 Years | 1,039 (100.0%) | 0 (0.0%) |
| 65 to 74 Years | 1,248 (100.0%) | 0 (0.0%) |
| 75 Years and older | 445 (100.0%) | 0 (0.0%) |
| Total | 4,066 (100.0%) | 0 (0.0%) |
Health Insurance Coverage by Citizenship Status in Placitas CDP Sandoval County
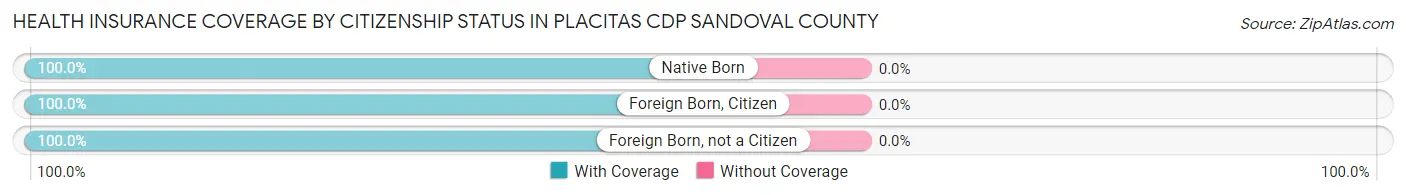
| Citizenship Status | With Coverage | Without Coverage |
| Native Born | 109 (100.0%) | 0 (0.0%) |
| Foreign Born, Citizen | 108 (100.0%) | 0 (0.0%) |
| Foreign Born, not a Citizen | 85 (100.0%) | 0 (0.0%) |
Health Insurance Coverage by Household Income in Placitas CDP Sandoval County
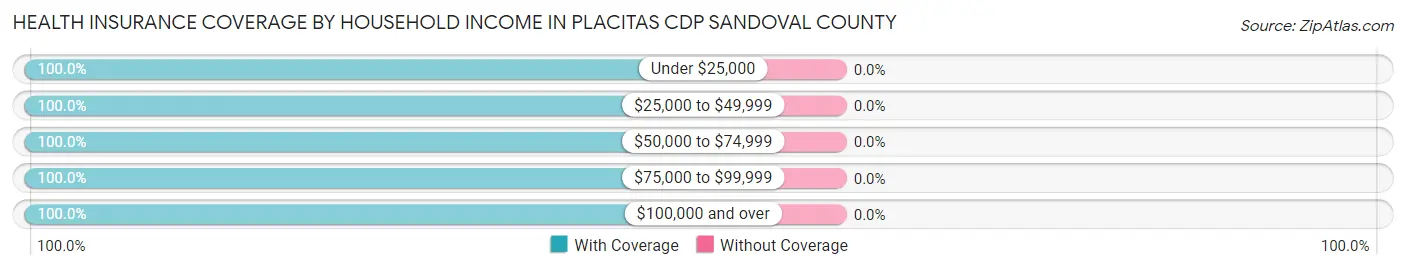
| Household Income | With Coverage | Without Coverage |
| Under $25,000 | 160 (100.0%) | 0 (0.0%) |
| $25,000 to $49,999 | 447 (100.0%) | 0 (0.0%) |
| $50,000 to $74,999 | 608 (100.0%) | 0 (0.0%) |
| $75,000 to $99,999 | 638 (100.0%) | 0 (0.0%) |
| $100,000 and over | 2,213 (100.0%) | 0 (0.0%) |
Public vs Private Health Insurance Coverage by Age in Placitas CDP Sandoval County
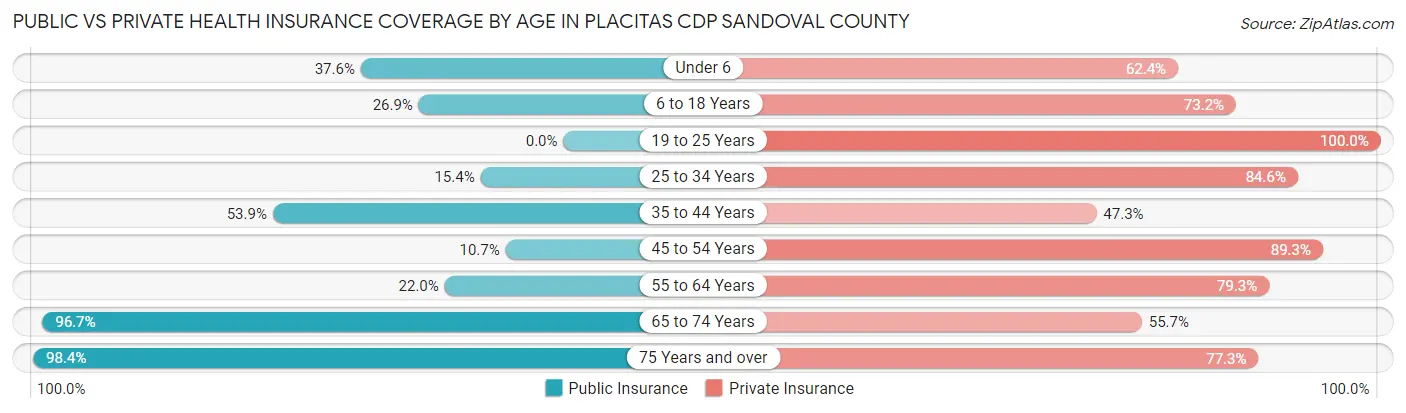
| Age Bracket | Public Insurance | Private Insurance |
| Under 6 | 41 (37.6%) | 68 (62.4%) |
| 6 to 18 Years | 29 (26.9%) | 79 (73.2%) |
| 19 to 25 Years | 0 (0.0%) | 85 (100.0%) |
| 25 to 34 Years | 14 (15.4%) | 77 (84.6%) |
| 35 to 44 Years | 226 (53.9%) | 198 (47.3%) |
| 45 to 54 Years | 56 (10.7%) | 466 (89.3%) |
| 55 to 64 Years | 229 (22.0%) | 824 (79.3%) |
| 65 to 74 Years | 1,207 (96.7%) | 695 (55.7%) |
| 75 Years and over | 438 (98.4%) | 344 (77.3%) |
| Total | 2,240 (55.1%) | 2,836 (69.8%) |
Disability Status by Sex by Age in Placitas CDP Sandoval County
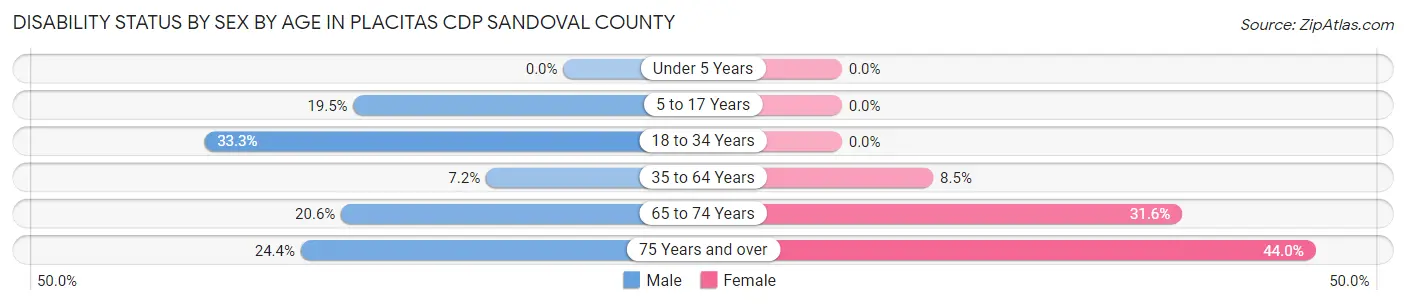
| Age Bracket | Male | Female |
| Under 5 Years | 0 (0.0%) | 0 (0.0%) |
| 5 to 17 Years | 15 (19.5%) | 0 (0.0%) |
| 18 to 34 Years | 39 (33.3%) | 0 (0.0%) |
| 35 to 64 Years | 71 (7.2%) | 84 (8.5%) |
| 65 to 74 Years | 132 (20.6%) | 192 (31.6%) |
| 75 Years and over | 58 (24.4%) | 91 (44.0%) |
Disability Class by Sex by Age in Placitas CDP Sandoval County
Disability Class: Hearing Difficulty
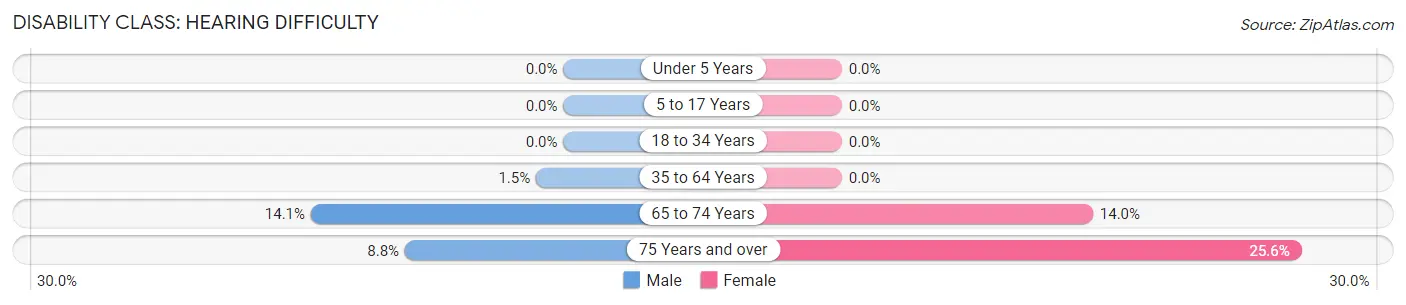
| Age Bracket | Male | Female |
| Under 5 Years | 0 (0.0%) | 0 (0.0%) |
| 5 to 17 Years | 0 (0.0%) | 0 (0.0%) |
| 18 to 34 Years | 0 (0.0%) | 0 (0.0%) |
| 35 to 64 Years | 15 (1.5%) | 0 (0.0%) |
| 65 to 74 Years | 90 (14.1%) | 85 (14.0%) |
| 75 Years and over | 21 (8.8%) | 53 (25.6%) |
Disability Class: Vision Difficulty
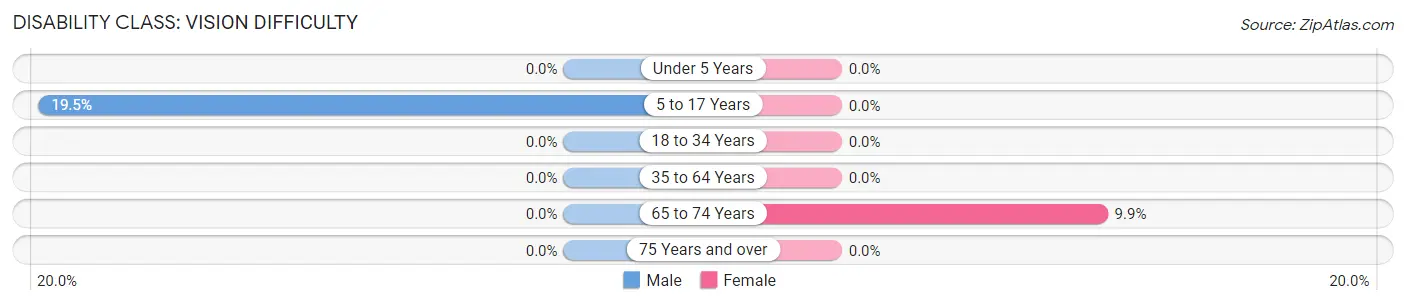
| Age Bracket | Male | Female |
| Under 5 Years | 0 (0.0%) | 0 (0.0%) |
| 5 to 17 Years | 15 (19.5%) | 0 (0.0%) |
| 18 to 34 Years | 0 (0.0%) | 0 (0.0%) |
| 35 to 64 Years | 0 (0.0%) | 0 (0.0%) |
| 65 to 74 Years | 0 (0.0%) | 60 (9.9%) |
| 75 Years and over | 0 (0.0%) | 0 (0.0%) |
Disability Class: Cognitive Difficulty
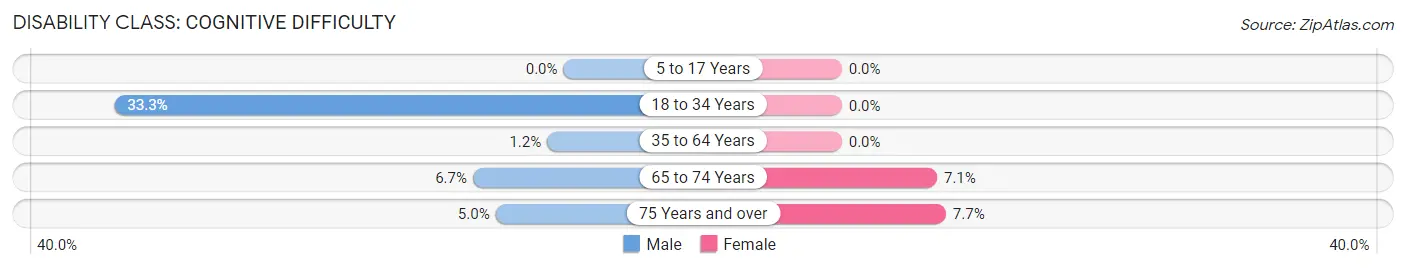
| Age Bracket | Male | Female |
| 5 to 17 Years | 0 (0.0%) | 0 (0.0%) |
| 18 to 34 Years | 39 (33.3%) | 0 (0.0%) |
| 35 to 64 Years | 12 (1.2%) | 0 (0.0%) |
| 65 to 74 Years | 43 (6.7%) | 43 (7.1%) |
| 75 Years and over | 12 (5.0%) | 16 (7.7%) |
Disability Class: Ambulatory Difficulty
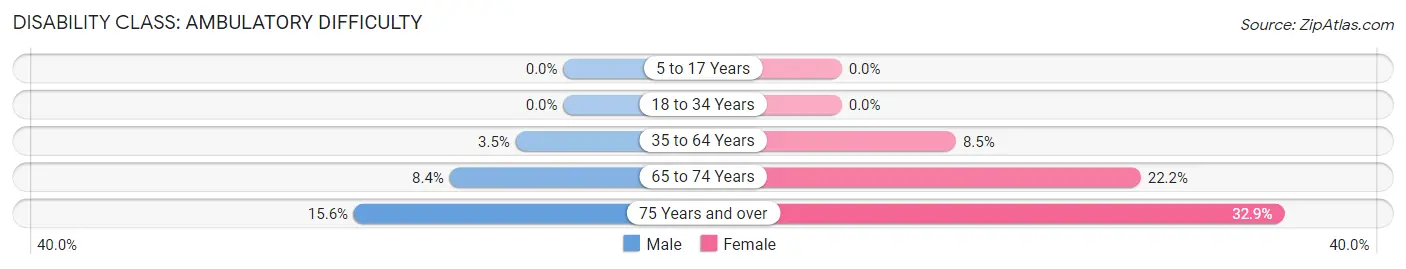
| Age Bracket | Male | Female |
| 5 to 17 Years | 0 (0.0%) | 0 (0.0%) |
| 18 to 34 Years | 0 (0.0%) | 0 (0.0%) |
| 35 to 64 Years | 35 (3.5%) | 84 (8.5%) |
| 65 to 74 Years | 54 (8.4%) | 135 (22.2%) |
| 75 Years and over | 37 (15.5%) | 68 (32.9%) |
Disability Class: Self-Care Difficulty
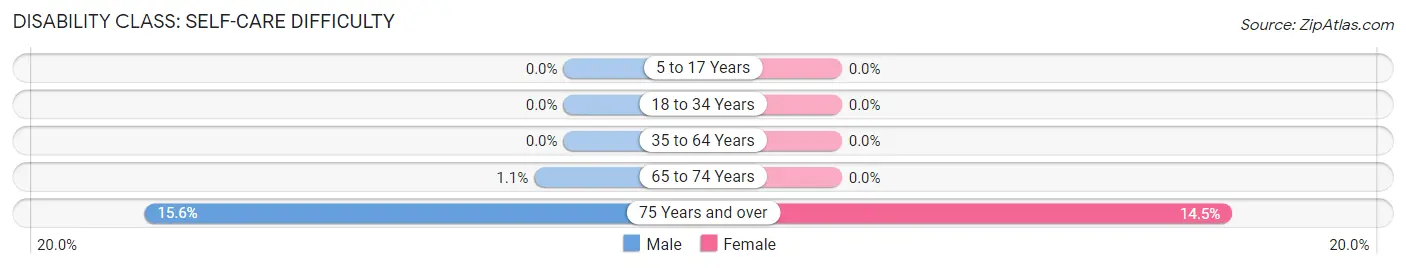
| Age Bracket | Male | Female |
| 5 to 17 Years | 0 (0.0%) | 0 (0.0%) |
| 18 to 34 Years | 0 (0.0%) | 0 (0.0%) |
| 35 to 64 Years | 0 (0.0%) | 0 (0.0%) |
| 65 to 74 Years | 7 (1.1%) | 0 (0.0%) |
| 75 Years and over | 37 (15.5%) | 30 (14.5%) |
Technology Access in Placitas CDP Sandoval County
Computing Device Access in Placitas CDP Sandoval County
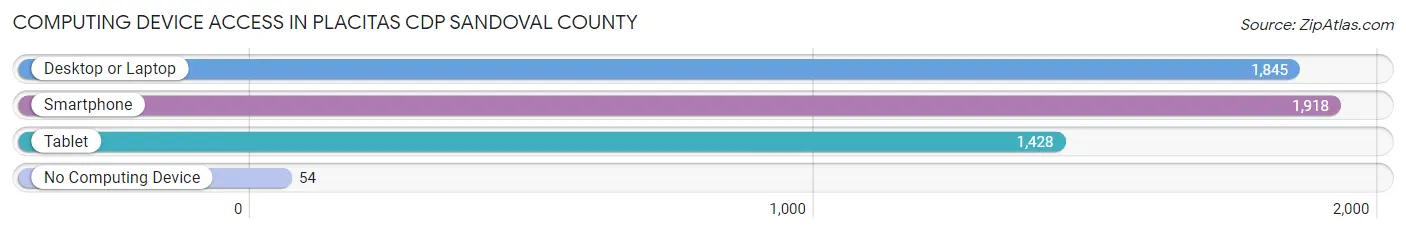
| Device Type | # Households | % Households |
| Desktop or Laptop | 1,845 | 91.6% |
| Smartphone | 1,918 | 95.2% |
| Tablet | 1,428 | 70.9% |
| No Computing Device | 54 | 2.7% |
| Total | 2,015 | 100.0% |
Internet Access in Placitas CDP Sandoval County
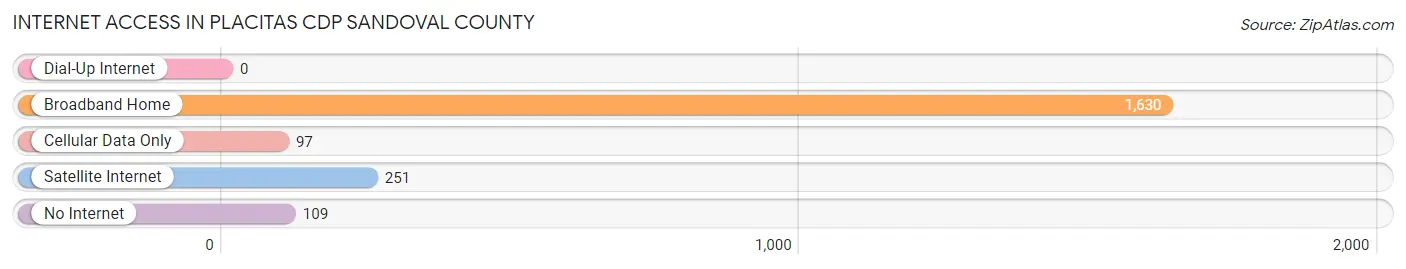
| Internet Type | # Households | % Households |
| Dial-Up Internet | 0 | 0.0% |
| Broadband Home | 1,630 | 80.9% |
| Cellular Data Only | 97 | 4.8% |
| Satellite Internet | 251 | 12.5% |
| No Internet | 109 | 5.4% |
| Total | 2,015 | 100.0% |
Placitas CDP Sandoval County Summary
Placitas CDP is a census-designated place (CDP) located in Sandoval County, New Mexico. It is situated in the northern part of the state, approximately 25 miles north of Albuquerque. As of the 2010 census, the population of Placitas was 2,535.
History
The area now known as Placitas was originally inhabited by the Pueblo Indians. The first European settlers arrived in the area in the late 1700s, and the area was officially established as a CDP in the early 1900s. The name “Placitas” is derived from the Spanish word for “little places”, and was chosen to reflect the small, rural nature of the area.
Geography
Placitas is located in the northern part of Sandoval County, approximately 25 miles north of Albuquerque. It is situated in the foothills of the Sandia Mountains, and is surrounded by the Cibola National Forest. The CDP has a total area of 8.3 square miles, all of which is land.
Climate
Placitas has a semi-arid climate, with hot summers and mild winters. The average annual temperature is approximately 60°F, and the average annual precipitation is approximately 12 inches.
Demographics
As of the 2010 census, the population of Placitas was 2,535. The racial makeup of the CDP was 87.3% White, 0.7% African American, 1.2% Native American, 0.3% Asian, 0.1% Pacific Islander, 8.2% from other races, and 2.4% from two or more races. Hispanic or Latino of any race were 24.3% of the population.
Economy
The economy of Placitas is largely based on tourism and agriculture. The area is home to several wineries, and is a popular destination for outdoor recreation. The CDP is also home to several small businesses, including restaurants, retail stores, and art galleries.
Common Questions
What is Per Capita Income in Placitas CDP Sandoval County?
Per Capita income in Placitas CDP Sandoval County is $65,890.
What is the Median Family Income in Placitas CDP Sandoval County?
Median Family Income in Placitas CDP Sandoval County is $118,750.
What is the Median Household income in Placitas CDP Sandoval County?
Median Household Income in Placitas CDP Sandoval County is $105,216.
What is Income or Wage Gap in Placitas CDP Sandoval County?
Income or Wage Gap in Placitas CDP Sandoval County is 6.2%.
Women in Placitas CDP Sandoval County earn 93.8 cents for every dollar earned by a man.
What is Inequality or Gini Index in Placitas CDP Sandoval County?
Inequality or Gini Index in Placitas CDP Sandoval County is 0.40.
What is the Total Population of Placitas CDP Sandoval County?
Total Population of Placitas CDP Sandoval County is 4,066.
What is the Total Male Population of Placitas CDP Sandoval County?
Total Male Population of Placitas CDP Sandoval County is 2,138.
What is the Total Female Population of Placitas CDP Sandoval County?
Total Female Population of Placitas CDP Sandoval County is 1,928.
What is the Ratio of Males per 100 Females in Placitas CDP Sandoval County?
There are 110.89 Males per 100 Females in Placitas CDP Sandoval County.
What is the Ratio of Females per 100 Males in Placitas CDP Sandoval County?
There are 90.18 Females per 100 Males in Placitas CDP Sandoval County.
What is the Median Population Age in Placitas CDP Sandoval County?
Median Population Age in Placitas CDP Sandoval County is 62.8 Years.
What is the Average Family Size in Placitas CDP Sandoval County
Average Family Size in Placitas CDP Sandoval County is 2.3 People.
What is the Average Household Size in Placitas CDP Sandoval County
Average Household Size in Placitas CDP Sandoval County is 2.0 People.
How Large is the Labor Force in Placitas CDP Sandoval County?
There are 1,820 People in the Labor Forcein in Placitas CDP Sandoval County.
What is the Percentage of People in the Labor Force in Placitas CDP Sandoval County?
46.6% of People are in the Labor Force in Placitas CDP Sandoval County.
What is the Unemployment Rate in Placitas CDP Sandoval County?
Unemployment Rate in Placitas CDP Sandoval County is 3.0%.