Zip Codes with the Highest Percentage of Population Employed in Computer & Mathematics in Gallup, NM
RELATED REPORTS & OPTIONS
Computer & Mathematics
Gallup
Compare Zip Codes
Map of Zip Codes with the Highest Percentage of Population Employed in Computer & Mathematics in Gallup
0.93%
1.4%
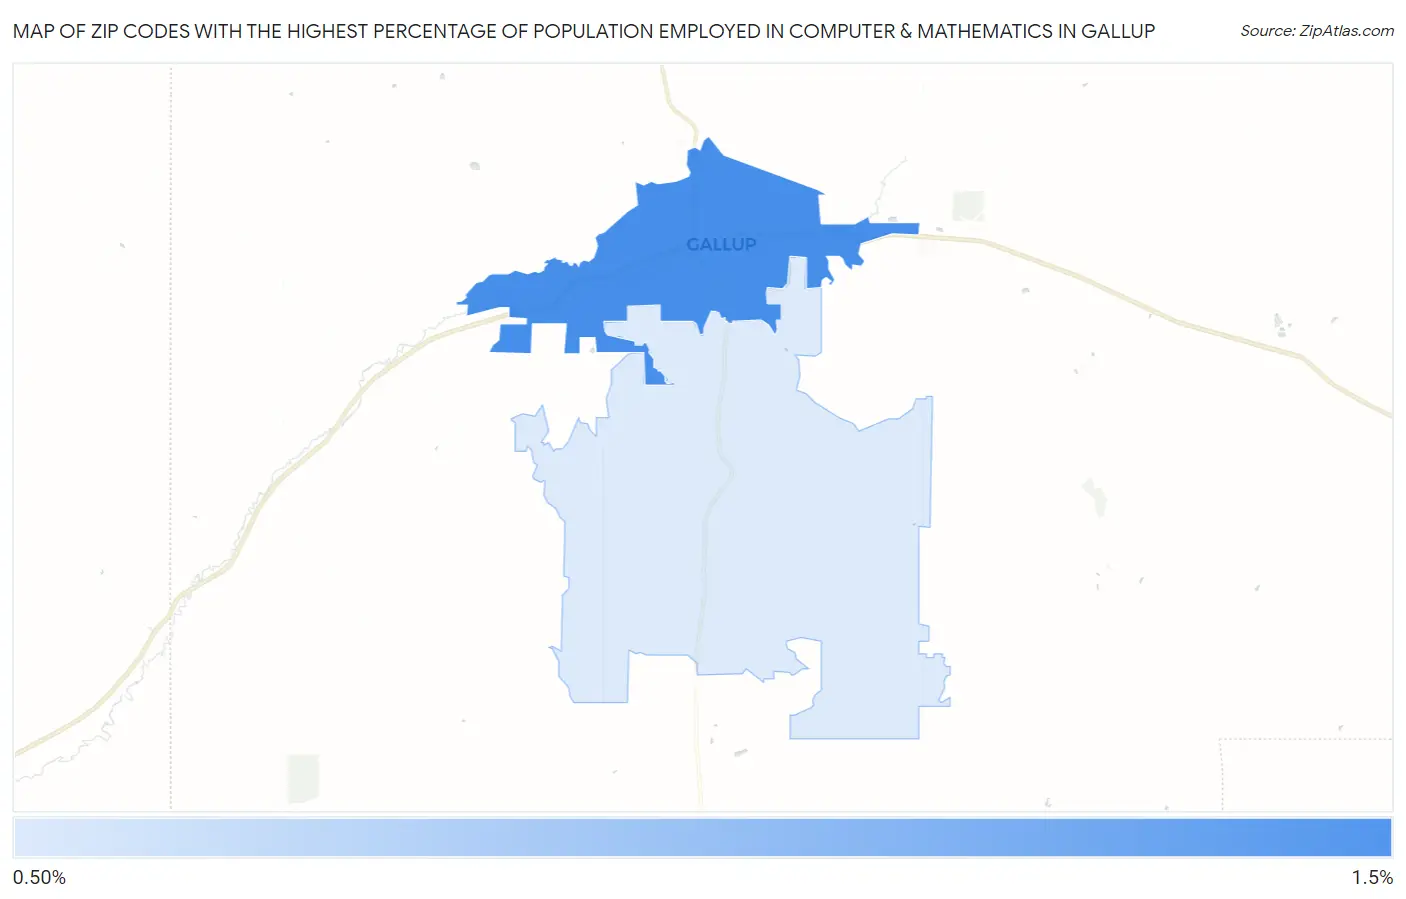
Zip Codes with the Highest Percentage of Population Employed in Computer & Mathematics in Gallup, NM
| Zip Code | % Employed | vs State | vs National | |
| 1. | 87301 | 1.4% | 2.4%(-1.03)#90 | 3.5%(-2.12)#14,883 |
| 2. | 87305 | 0.93% | 2.4%(-1.51)#109 | 3.5%(-2.60)#17,831 |
1
Common Questions
What are the Top Zip Codes with the Highest Percentage of Population Employed in Computer & Mathematics in Gallup, NM?
Top Zip Codes with the Highest Percentage of Population Employed in Computer & Mathematics in Gallup, NM are:
What zip code has the Highest Percentage of Population Employed in Computer & Mathematics in Gallup, NM?
87301 has the Highest Percentage of Population Employed in Computer & Mathematics in Gallup, NM with 1.4%.
What is the Percentage of Population Employed in Computer & Mathematics in Gallup, NM?
Percentage of Population Employed in Computer & Mathematics in Gallup is 1.5%.
What is the Percentage of Population Employed in Computer & Mathematics in New Mexico?
Percentage of Population Employed in Computer & Mathematics in New Mexico is 2.4%.
What is the Percentage of Population Employed in Computer & Mathematics in the United States?
Percentage of Population Employed in Computer & Mathematics in the United States is 3.5%.