San Antonito CDP Bernalillo County, NM Map & Demographics
San Antonito CDP Bernalillo County Overview
$37,614
PER CAPITA INCOME
$77,813
AVG FAMILY INCOME
$58,924
AVG HOUSEHOLD INCOME
0.42
INEQUALITY / GINI INDEX
772
TOTAL POPULATION
344
MALE POPULATION
428
FEMALE POPULATION
80.37
MALES / 100 FEMALES
124.42
FEMALES / 100 MALES
52.6
MEDIAN AGE
2.8
AVG FAMILY SIZE
2.0
AVG HOUSEHOLD SIZE
328
LABOR FORCE [ PEOPLE ]
55.9%
PERCENT IN LABOR FORCE
6.1%
UNEMPLOYMENT RATE
Income in San Antonito CDP Bernalillo County
Income Overview in San Antonito CDP Bernalillo County
Per Capita Income in San Antonito CDP Bernalillo County is $37,614, while median incomes of families and households are $77,813 and $58,924 respectively.
| Characteristic | Number | Measure |
| Per Capita Income | 772 | $37,614 |
| Median Family Income | 209 | $77,813 |
| Mean Family Income | 209 | $95,987 |
| Median Household Income | 377 | $58,924 |
| Mean Household Income | 377 | $76,511 |
| Income Deficit | 209 | $0 |
| Wage / Income Gap (%) | 772 | 0.00% |
| Wage / Income Gap ($) | 772 | 100.00¢ per $1 |
| Gini / Inequality Index | 772 | 0.42 |
Earnings by Sex in San Antonito CDP Bernalillo County
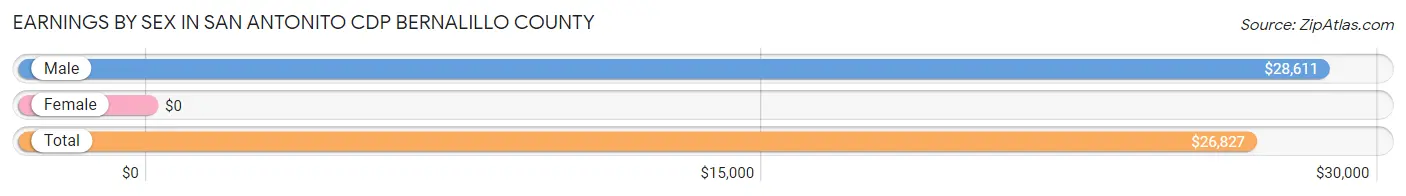
| Sex | Number | Average Earnings |
| Male | 210 (64.0%) | $28,611 |
| Female | 118 (36.0%) | $0 |
| Total | 328 (100.0%) | $26,827 |
Earnings by Sex by Income Bracket in San Antonito CDP Bernalillo County
The most common earnings brackets in San Antonito CDP Bernalillo County are $5,000 to $7,499 for men (51 | 24.3%) and $12,500 to $14,999 for women (37 | 31.4%).
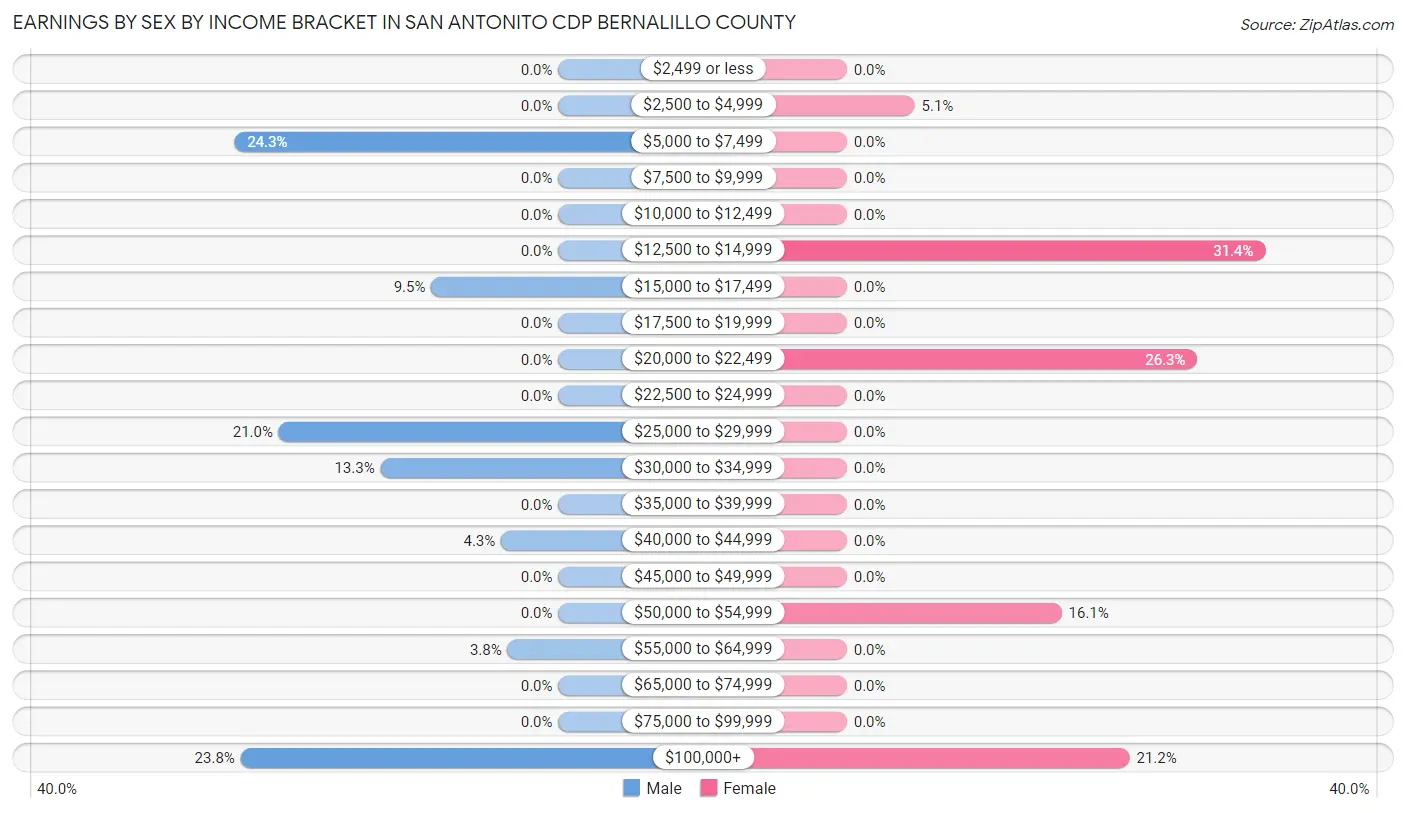
| Income | Male | Female |
| $2,499 or less | 0 (0.0%) | 0 (0.0%) |
| $2,500 to $4,999 | 0 (0.0%) | 6 (5.1%) |
| $5,000 to $7,499 | 51 (24.3%) | 0 (0.0%) |
| $7,500 to $9,999 | 0 (0.0%) | 0 (0.0%) |
| $10,000 to $12,499 | 0 (0.0%) | 0 (0.0%) |
| $12,500 to $14,999 | 0 (0.0%) | 37 (31.4%) |
| $15,000 to $17,499 | 20 (9.5%) | 0 (0.0%) |
| $17,500 to $19,999 | 0 (0.0%) | 0 (0.0%) |
| $20,000 to $22,499 | 0 (0.0%) | 31 (26.3%) |
| $22,500 to $24,999 | 0 (0.0%) | 0 (0.0%) |
| $25,000 to $29,999 | 44 (20.9%) | 0 (0.0%) |
| $30,000 to $34,999 | 28 (13.3%) | 0 (0.0%) |
| $35,000 to $39,999 | 0 (0.0%) | 0 (0.0%) |
| $40,000 to $44,999 | 9 (4.3%) | 0 (0.0%) |
| $45,000 to $49,999 | 0 (0.0%) | 0 (0.0%) |
| $50,000 to $54,999 | 0 (0.0%) | 19 (16.1%) |
| $55,000 to $64,999 | 8 (3.8%) | 0 (0.0%) |
| $65,000 to $74,999 | 0 (0.0%) | 0 (0.0%) |
| $75,000 to $99,999 | 0 (0.0%) | 0 (0.0%) |
| $100,000+ | 50 (23.8%) | 25 (21.2%) |
| Total | 210 (100.0%) | 118 (100.0%) |
Earnings by Sex by Educational Attainment in San Antonito CDP Bernalillo County
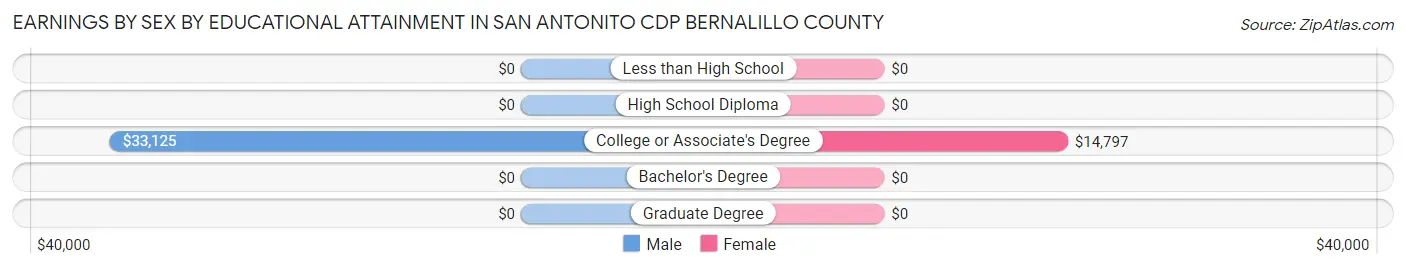
| Educational Attainment | Male Income | Female Income |
| Less than High School | - | - |
| High School Diploma | - | - |
| College or Associate's Degree | $33,125 | $14,797 |
| Bachelor's Degree | - | - |
| Graduate Degree | - | - |
| Total | $28,611 | $0 |
Family Income in San Antonito CDP Bernalillo County
Family Income Brackets in San Antonito CDP Bernalillo County
According to the San Antonito CDP Bernalillo County family income data, there are 64 families falling into the $50,000 to $74,999 income range, which is the most common income bracket and makes up 30.6% of all families.
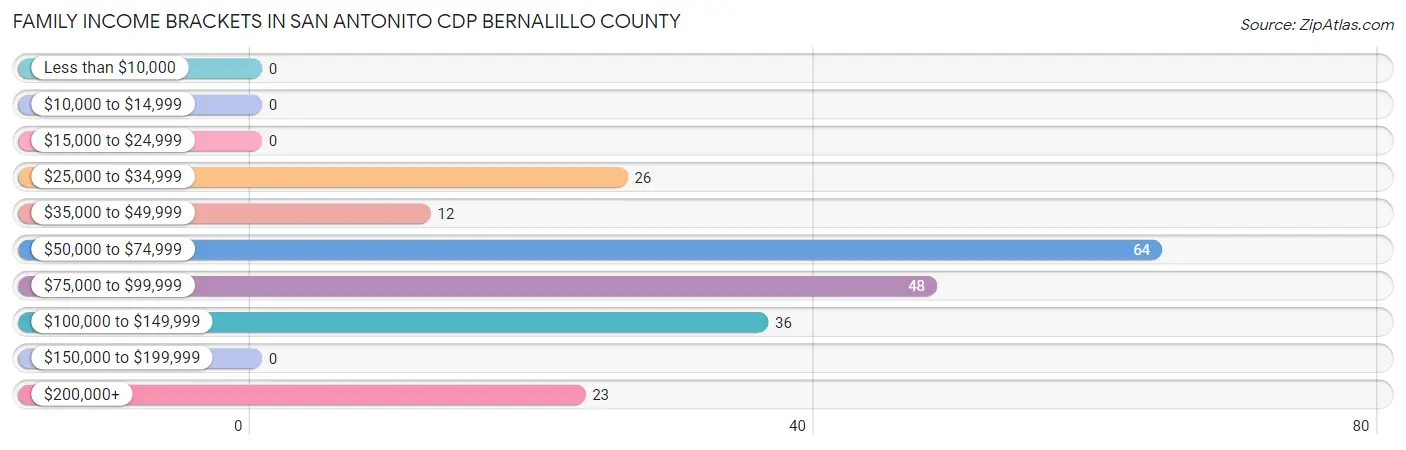
| Income Bracket | # Families | % Families |
| Less than $10,000 | 0 | 0.0% |
| $10,000 to $14,999 | 0 | 0.0% |
| $15,000 to $24,999 | 0 | 0.0% |
| $25,000 to $34,999 | 26 | 12.4% |
| $35,000 to $49,999 | 12 | 5.7% |
| $50,000 to $74,999 | 64 | 30.6% |
| $75,000 to $99,999 | 48 | 23.0% |
| $100,000 to $149,999 | 36 | 17.2% |
| $150,000 to $199,999 | 0 | 0.0% |
| $200,000+ | 23 | 11.0% |
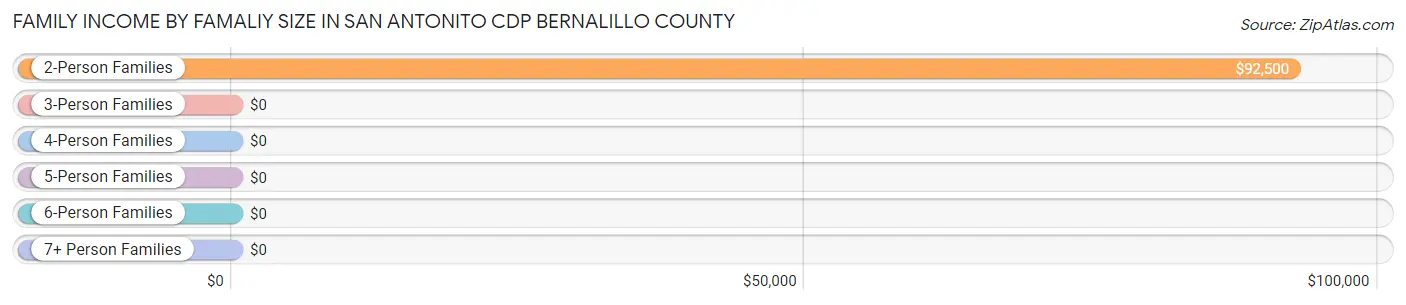
Family Income by Famaliy Size in San Antonito CDP Bernalillo County
2-person families (146 | 69.9%) account for the highest median family income in San Antonito CDP Bernalillo County with $92,500 per family, while 2-person families (146 | 69.9%) have the highest median income of $46,250 per family member.
| Income Bracket | # Families | Median Income |
| 2-Person Families | 146 (69.9%) | $92,500 |
| 3-Person Families | 0 (0.0%) | $0 |
| 4-Person Families | 26 (12.4%) | $0 |
| 5-Person Families | 0 (0.0%) | $0 |
| 6-Person Families | 37 (17.7%) | $0 |
| 7+ Person Families | 0 (0.0%) | $0 |
| Total | 209 (100.0%) | $77,813 |
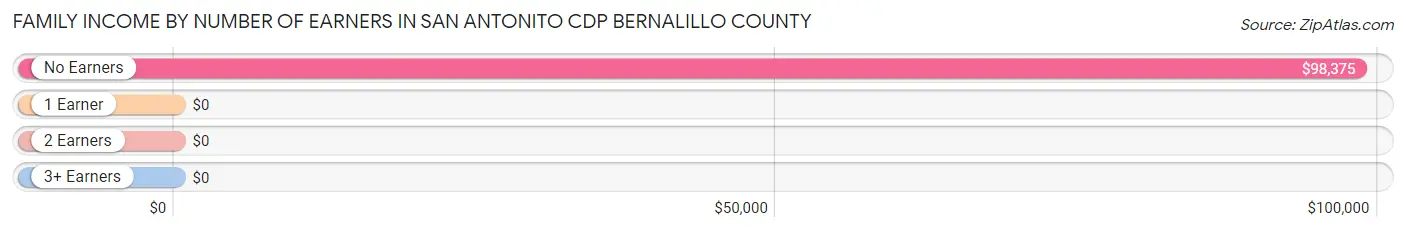
Family Income by Number of Earners in San Antonito CDP Bernalillo County
| Number of Earners | # Families | Median Income |
| No Earners | 86 (41.1%) | $98,375 |
| 1 Earner | 63 (30.1%) | $0 |
| 2 Earners | 60 (28.7%) | $0 |
| 3+ Earners | 0 (0.0%) | $0 |
| Total | 209 (100.0%) | $77,813 |
Household Income in San Antonito CDP Bernalillo County
Household Income Brackets in San Antonito CDP Bernalillo County
With 93 households falling in the category, the $50,000 to $74,999 income range is the most frequent in San Antonito CDP Bernalillo County, accounting for 24.7% of all households.
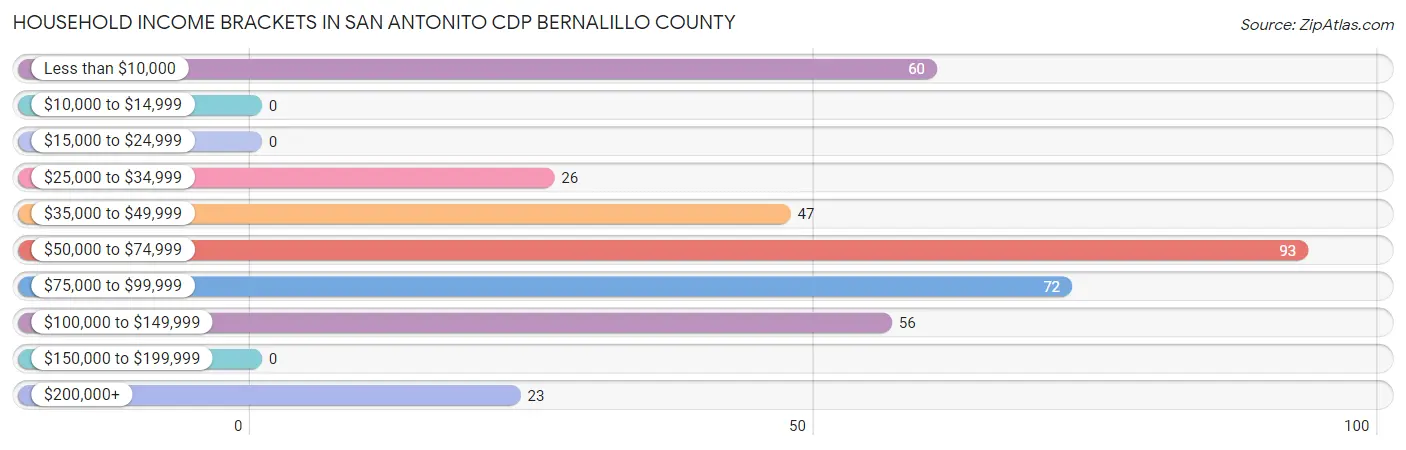
| Income Bracket | # Households | % Households |
| Less than $10,000 | 60 | 15.9% |
| $10,000 to $14,999 | 0 | 0.0% |
| $15,000 to $24,999 | 0 | 0.0% |
| $25,000 to $34,999 | 26 | 6.9% |
| $35,000 to $49,999 | 47 | 12.5% |
| $50,000 to $74,999 | 93 | 24.7% |
| $75,000 to $99,999 | 72 | 19.1% |
| $100,000 to $149,999 | 56 | 14.9% |
| $150,000 to $199,999 | 0 | 0.0% |
| $200,000+ | 23 | 6.1% |
Household Income by Householder Age in San Antonito CDP Bernalillo County
The median household income in San Antonito CDP Bernalillo County is $58,924, with the highest median household income of $79,313 found in the 65+ years age bracket for the primary householder. A total of 185 households (49.1%) fall into this category.
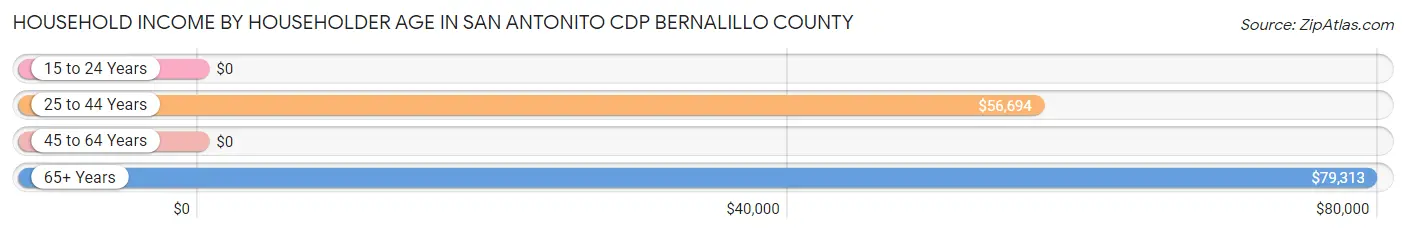
| Income Bracket | # Households | Median Income |
| 15 to 24 Years | 0 (0.0%) | $0 |
| 25 to 44 Years | 112 (29.7%) | $56,694 |
| 45 to 64 Years | 80 (21.2%) | $0 |
| 65+ Years | 185 (49.1%) | $79,313 |
| Total | 377 (100.0%) | $58,924 |
Poverty in San Antonito CDP Bernalillo County
Income Below Poverty by Sex and Age in San Antonito CDP Bernalillo County
With 25.0% poverty level for males and 16.1% for females among the residents of San Antonito CDP Bernalillo County, 55 to 64 year old males and under 5 year old females are the most vulnerable to poverty, with 51 males (86.4%) and 22 females (43.1%) in their respective age groups living below the poverty level.
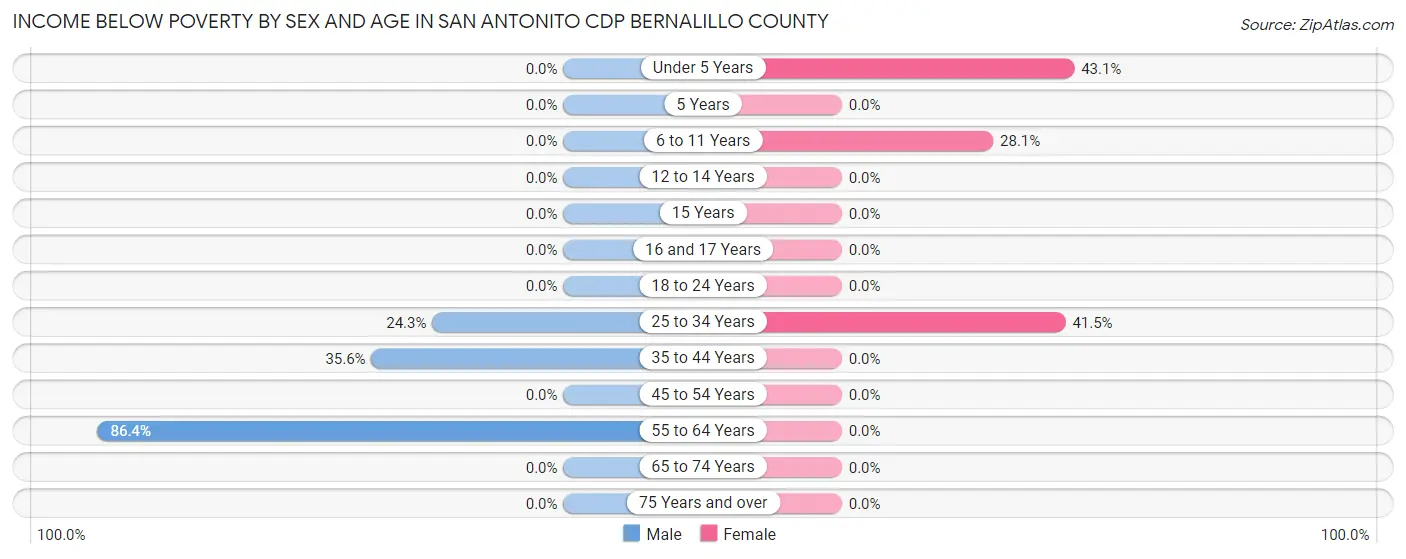
| Age Bracket | Male | Female |
| Under 5 Years | 0 (0.0%) | 22 (43.1%) |
| 5 Years | 0 (0.0%) | 0 (0.0%) |
| 6 to 11 Years | 0 (0.0%) | 25 (28.1%) |
| 12 to 14 Years | 0 (0.0%) | 0 (0.0%) |
| 15 Years | 0 (0.0%) | 0 (0.0%) |
| 16 and 17 Years | 0 (0.0%) | 0 (0.0%) |
| 18 to 24 Years | 0 (0.0%) | 0 (0.0%) |
| 25 to 34 Years | 9 (24.3%) | 22 (41.5%) |
| 35 to 44 Years | 26 (35.6%) | 0 (0.0%) |
| 45 to 54 Years | 0 (0.0%) | 0 (0.0%) |
| 55 to 64 Years | 51 (86.4%) | 0 (0.0%) |
| 65 to 74 Years | 0 (0.0%) | 0 (0.0%) |
| 75 Years and over | 0 (0.0%) | 0 (0.0%) |
| Total | 86 (25.0%) | 69 (16.1%) |
Income Above Poverty by Sex and Age in San Antonito CDP Bernalillo County
According to the poverty statistics in San Antonito CDP Bernalillo County, males aged under 5 years and females aged 35 to 44 years are the age groups that are most secure financially, with 100.0% of males and 100.0% of females in these age groups living above the poverty line.
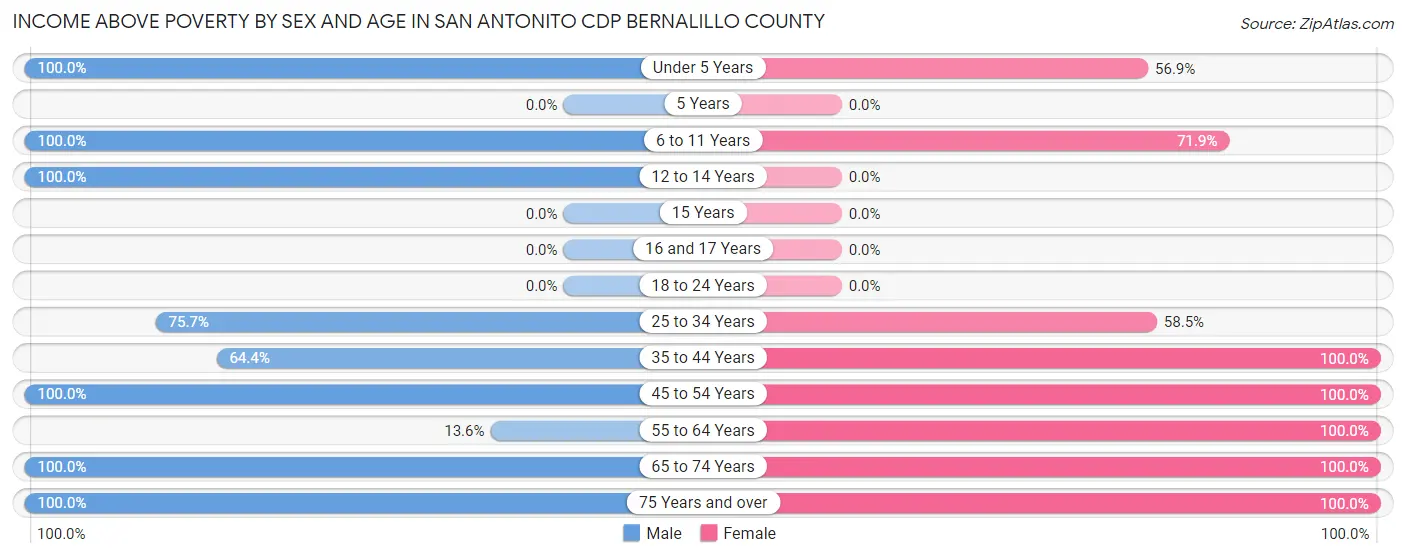
| Age Bracket | Male | Female |
| Under 5 Years | 28 (100.0%) | 29 (56.9%) |
| 5 Years | 0 (0.0%) | 0 (0.0%) |
| 6 to 11 Years | 12 (100.0%) | 64 (71.9%) |
| 12 to 14 Years | 5 (100.0%) | 0 (0.0%) |
| 15 Years | 0 (0.0%) | 0 (0.0%) |
| 16 and 17 Years | 0 (0.0%) | 0 (0.0%) |
| 18 to 24 Years | 0 (0.0%) | 0 (0.0%) |
| 25 to 34 Years | 28 (75.7%) | 31 (58.5%) |
| 35 to 44 Years | 47 (64.4%) | 16 (100.0%) |
| 45 to 54 Years | 9 (100.0%) | 27 (100.0%) |
| 55 to 64 Years | 8 (13.6%) | 37 (100.0%) |
| 65 to 74 Years | 77 (100.0%) | 120 (100.0%) |
| 75 Years and over | 44 (100.0%) | 35 (100.0%) |
| Total | 258 (75.0%) | 359 (83.9%) |
Income Below Poverty Among Married-Couple Families in San Antonito CDP Bernalillo County
The poverty statistics for married-couple families in San Antonito CDP Bernalillo County show that 14.8% or 26 of the total 176 families live below the poverty line. Families with 1 or 2 children have the highest poverty rate of 100.0%, comprising of 26 families. On the other hand, families with no children have the lowest poverty rate of 0.0%, which includes 0 families.
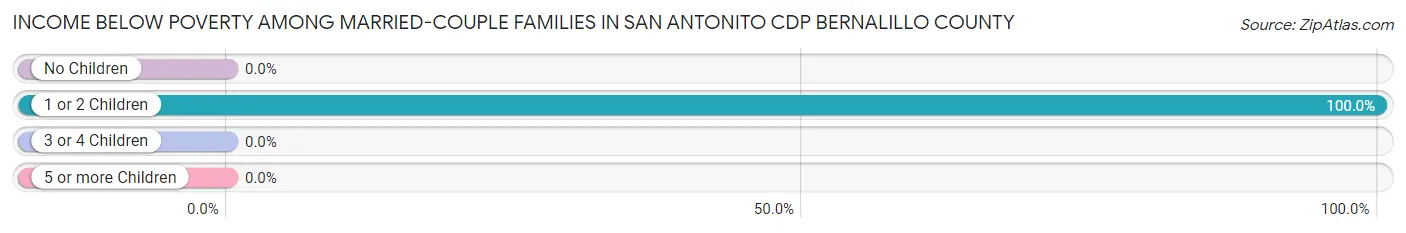
| Children | Above Poverty | Below Poverty |
| No Children | 113 (100.0%) | 0 (0.0%) |
| 1 or 2 Children | 0 (0.0%) | 26 (100.0%) |
| 3 or 4 Children | 37 (100.0%) | 0 (0.0%) |
| 5 or more Children | 0 (0.0%) | 0 (0.0%) |
| Total | 150 (85.2%) | 26 (14.8%) |
Income Below Poverty Among Single-Parent Households in San Antonito CDP Bernalillo County
| Children | Single Father | Single Mother |
| No Children | 0 (0.0%) | 0 (0.0%) |
| 1 or 2 Children | 0 (0.0%) | 0 (0.0%) |
| 3 or 4 Children | 0 (0.0%) | 0 (0.0%) |
| 5 or more Children | 0 (0.0%) | 0 (0.0%) |
| Total | 0 (0.0%) | 0 (0.0%) |
Income Below Poverty Among Married-Couple vs Single-Parent Households in San Antonito CDP Bernalillo County
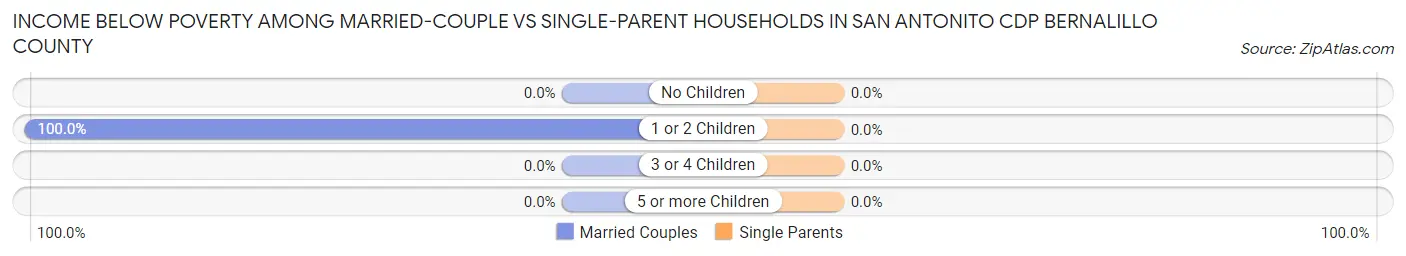
| Children | Married-Couple Families | Single-Parent Households |
| No Children | 0 (0.0%) | 0 (0.0%) |
| 1 or 2 Children | 26 (100.0%) | 0 (0.0%) |
| 3 or 4 Children | 0 (0.0%) | 0 (0.0%) |
| 5 or more Children | 0 (0.0%) | 0 (0.0%) |
| Total | 26 (14.8%) | 0 (0.0%) |
Race in San Antonito CDP Bernalillo County
The most populous races in San Antonito CDP Bernalillo County are White / Caucasian (695 | 90.0%), Hispanic or Latino (213 | 27.6%), and Two or more Races (77 | 10.0%).
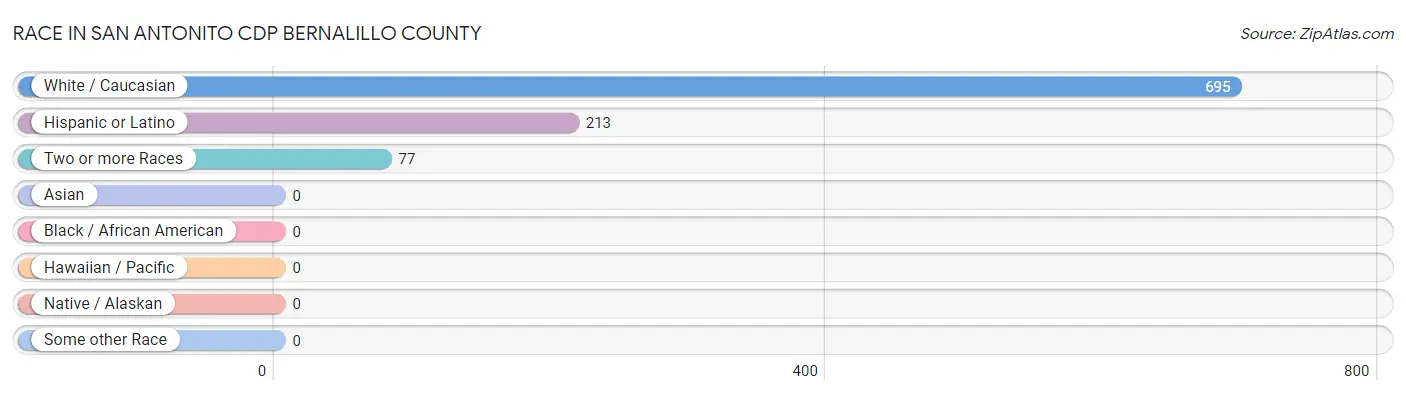
| Race | # Population | % Population |
| Asian | 0 | 0.0% |
| Black / African American | 0 | 0.0% |
| Hawaiian / Pacific | 0 | 0.0% |
| Hispanic or Latino | 213 | 27.6% |
| Native / Alaskan | 0 | 0.0% |
| White / Caucasian | 695 | 90.0% |
| Two or more Races | 77 | 10.0% |
| Some other Race | 0 | 0.0% |
| Total | 772 | 100.0% |
Ancestry in San Antonito CDP Bernalillo County
The most populous ancestries reported in San Antonito CDP Bernalillo County are German (268 | 34.7%), Irish (175 | 22.7%), Spaniard (174 | 22.5%), Scottish (145 | 18.8%), and English (65 | 8.4%), together accounting for 107.1% of all San Antonito CDP Bernalillo County residents.
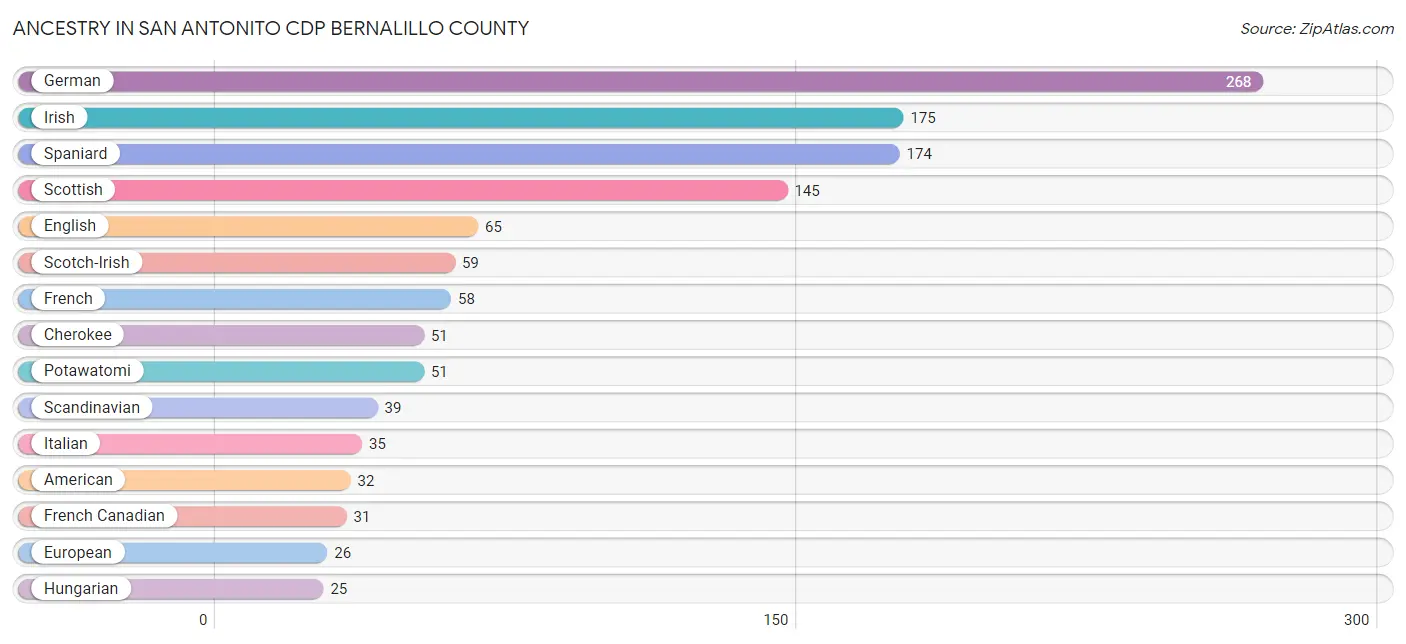
| Ancestry | # Population | % Population |
| American | 32 | 4.2% |
| Cherokee | 51 | 6.6% |
| English | 65 | 8.4% |
| European | 26 | 3.4% |
| French | 58 | 7.5% |
| French Canadian | 31 | 4.0% |
| German | 268 | 34.7% |
| Hungarian | 25 | 3.2% |
| Irish | 175 | 22.7% |
| Italian | 35 | 4.5% |
| Mexican | 21 | 2.7% |
| Polish | 5 | 0.6% |
| Potawatomi | 51 | 6.6% |
| Scandinavian | 39 | 5.1% |
| Scotch-Irish | 59 | 7.6% |
| Scottish | 145 | 18.8% |
| Spaniard | 174 | 22.5% | View All 17 Rows |
Immigrants in San Antonito CDP Bernalillo County
The most numerous immigrant groups reported in San Antonito CDP Bernalillo County came from England (8 | 1.0%), Europe (8 | 1.0%), and Northern Europe (8 | 1.0%), together accounting for 3.1% of all San Antonito CDP Bernalillo County residents.
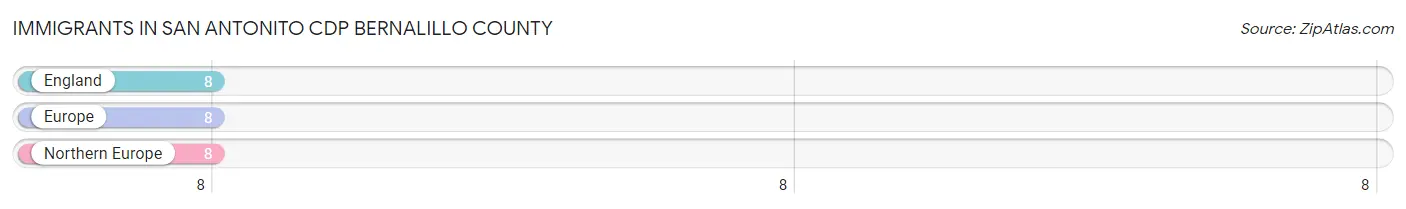
| Immigration Origin | # Population | % Population |
| England | 8 | 1.0% |
| Europe | 8 | 1.0% |
| Northern Europe | 8 | 1.0% | View All 3 Rows |
Sex and Age in San Antonito CDP Bernalillo County
Sex and Age in San Antonito CDP Bernalillo County
The most populous age groups in San Antonito CDP Bernalillo County are 55 to 59 Years (51 | 14.8%) for men and 5 to 9 Years (89 | 20.8%) for women.
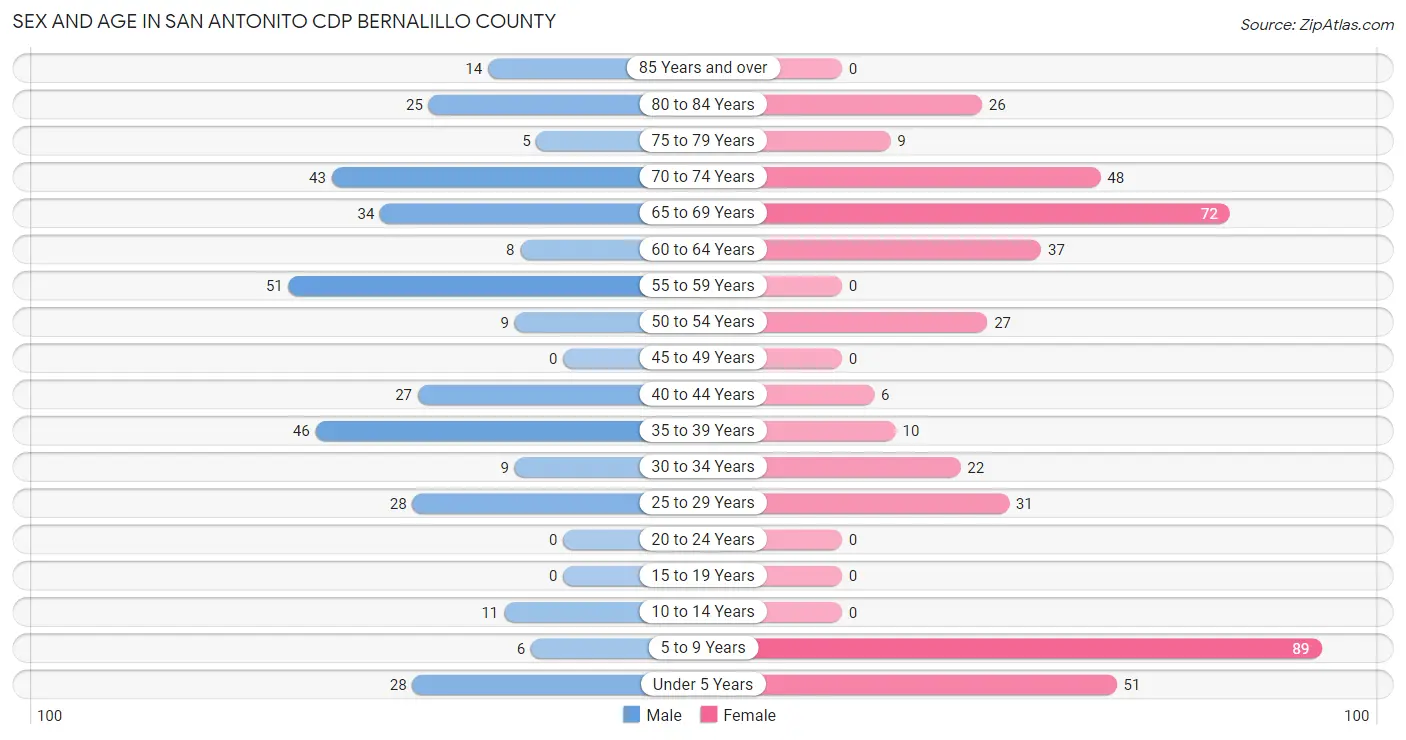
| Age Bracket | Male | Female |
| Under 5 Years | 28 (8.1%) | 51 (11.9%) |
| 5 to 9 Years | 6 (1.7%) | 89 (20.8%) |
| 10 to 14 Years | 11 (3.2%) | 0 (0.0%) |
| 15 to 19 Years | 0 (0.0%) | 0 (0.0%) |
| 20 to 24 Years | 0 (0.0%) | 0 (0.0%) |
| 25 to 29 Years | 28 (8.1%) | 31 (7.2%) |
| 30 to 34 Years | 9 (2.6%) | 22 (5.1%) |
| 35 to 39 Years | 46 (13.4%) | 10 (2.3%) |
| 40 to 44 Years | 27 (7.9%) | 6 (1.4%) |
| 45 to 49 Years | 0 (0.0%) | 0 (0.0%) |
| 50 to 54 Years | 9 (2.6%) | 27 (6.3%) |
| 55 to 59 Years | 51 (14.8%) | 0 (0.0%) |
| 60 to 64 Years | 8 (2.3%) | 37 (8.6%) |
| 65 to 69 Years | 34 (9.9%) | 72 (16.8%) |
| 70 to 74 Years | 43 (12.5%) | 48 (11.2%) |
| 75 to 79 Years | 5 (1.5%) | 9 (2.1%) |
| 80 to 84 Years | 25 (7.3%) | 26 (6.1%) |
| 85 Years and over | 14 (4.1%) | 0 (0.0%) |
| Total | 344 (100.0%) | 428 (100.0%) |
Families and Households in San Antonito CDP Bernalillo County
Median Family Size in San Antonito CDP Bernalillo County
The median family size in San Antonito CDP Bernalillo County is 2.84 persons per family, with married-couple families (176 | 84.2%) accounting for the largest median family size of 2.98 persons per family. On the other hand, single male/father families (9 | 4.3%) represent the smallest median family size with 2.00 persons per family.
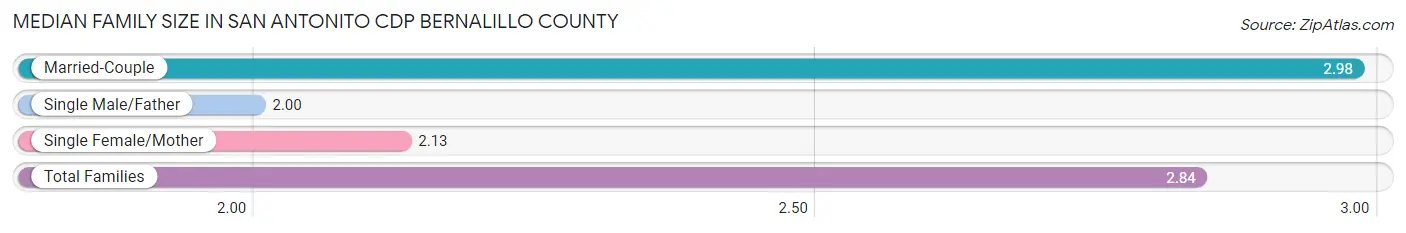
| Family Type | # Families | Family Size |
| Married-Couple | 176 (84.2%) | 2.98 |
| Single Male/Father | 9 (4.3%) | 2.00 |
| Single Female/Mother | 24 (11.5%) | 2.13 |
| Total Families | 209 (100.0%) | 2.84 |
Median Household Size in San Antonito CDP Bernalillo County
The median household size in San Antonito CDP Bernalillo County is 2.05 persons per household, with married-couple households (176 | 46.7%) accounting for the largest median household size of 2.98 persons per household. non-family households (168 | 44.6%) represent the smallest median household size with 1.06 persons per household.
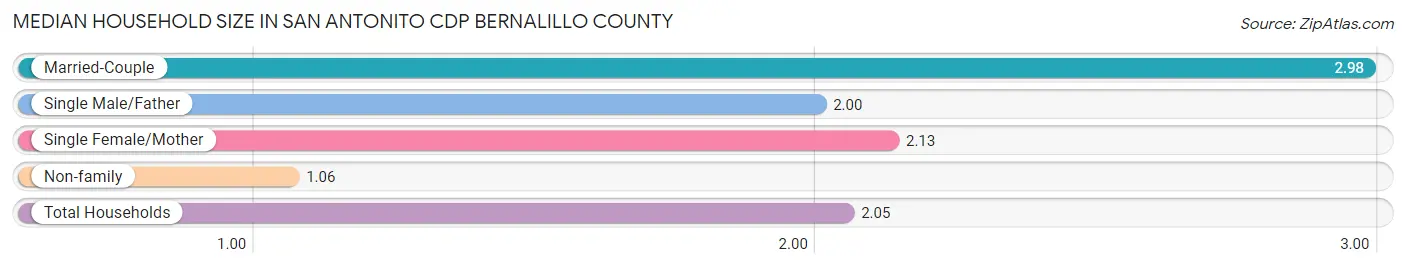
| Household Type | # Households | Household Size |
| Married-Couple | 176 (46.7%) | 2.98 |
| Single Male/Father | 9 (2.4%) | 2.00 |
| Single Female/Mother | 24 (6.4%) | 2.13 |
| Non-family | 168 (44.6%) | 1.06 |
| Total Households | 377 (100.0%) | 2.05 |
Household Size by Marriage Status in San Antonito CDP Bernalillo County
Out of a total of 377 households in San Antonito CDP Bernalillo County, 209 (55.4%) are family households, while 168 (44.6%) are nonfamily households. The most numerous type of family households are 2-person households, comprising 146, and the most common type of nonfamily households are 1-person households, comprising 158.
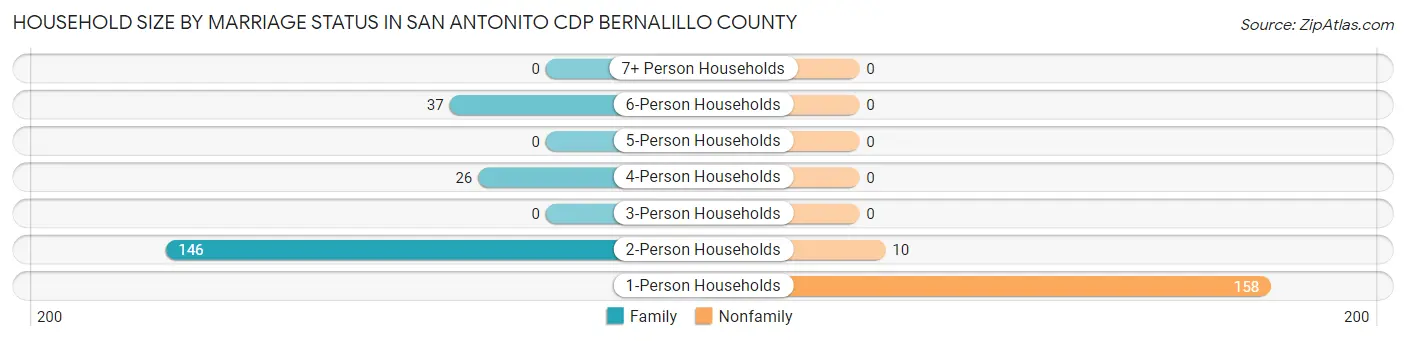
| Household Size | Family Households | Nonfamily Households |
| 1-Person Households | - | 158 (41.9%) |
| 2-Person Households | 146 (38.7%) | 10 (2.6%) |
| 3-Person Households | 0 (0.0%) | 0 (0.0%) |
| 4-Person Households | 26 (6.9%) | 0 (0.0%) |
| 5-Person Households | 0 (0.0%) | 0 (0.0%) |
| 6-Person Households | 37 (9.8%) | 0 (0.0%) |
| 7+ Person Households | 0 (0.0%) | 0 (0.0%) |
| Total | 209 (55.4%) | 168 (44.6%) |
Female Fertility in San Antonito CDP Bernalillo County
Fertility by Age in San Antonito CDP Bernalillo County
| Age Bracket | Women with Births | Births / 1,000 Women |
| 15 to 19 years | 0 (0.0%) | 0.0 |
| 20 to 34 years | 0 (0.0%) | 0.0 |
| 35 to 50 years | 0 (0.0%) | 0.0 |
| Total | 0 (0.0%) | 0.0 |
Fertility by Age by Marriage Status in San Antonito CDP Bernalillo County
| Age Bracket | Married | Unmarried |
| 15 to 19 years | 0 (0.0%) | 0 (0.0%) |
| 20 to 34 years | 0 (0.0%) | 0 (0.0%) |
| 35 to 50 years | 0 (0.0%) | 0 (0.0%) |
| Total | 0 (0.0%) | 0 (0.0%) |
Fertility by Education in San Antonito CDP Bernalillo County
| Educational Attainment | Women with Births | Births / 1,000 Women |
| Less than High School | 0 (0.0%) | 0.0 |
| High School Diploma | 0 (0.0%) | 0.0 |
| College or Associate's Degree | 0 (0.0%) | 0.0 |
| Bachelor's Degree | 0 (0.0%) | 0.0 |
| Graduate Degree | 0 (0.0%) | 0.0 |
| Total | 0 (0.0%) | 0.0 |
Fertility by Education by Marriage Status in San Antonito CDP Bernalillo County
| Educational Attainment | Married | Unmarried |
| Less than High School | 0 (0.0%) | 0 (0.0%) |
| High School Diploma | 0 (0.0%) | 0 (0.0%) |
| College or Associate's Degree | 0 (0.0%) | 0 (0.0%) |
| Bachelor's Degree | 0 (0.0%) | 0 (0.0%) |
| Graduate Degree | 0 (0.0%) | 0 (0.0%) |
| Total | 0 (0.0%) | 0 (0.0%) |
Employment Characteristics in San Antonito CDP Bernalillo County
Employment by Class of Employer in San Antonito CDP Bernalillo County
Among the 308 employed individuals in San Antonito CDP Bernalillo County, private company employees (227 | 73.7%), federal government employees (48 | 15.6%), and self-employed (not incorporated) (33 | 10.7%) make up the most common classes of employment.
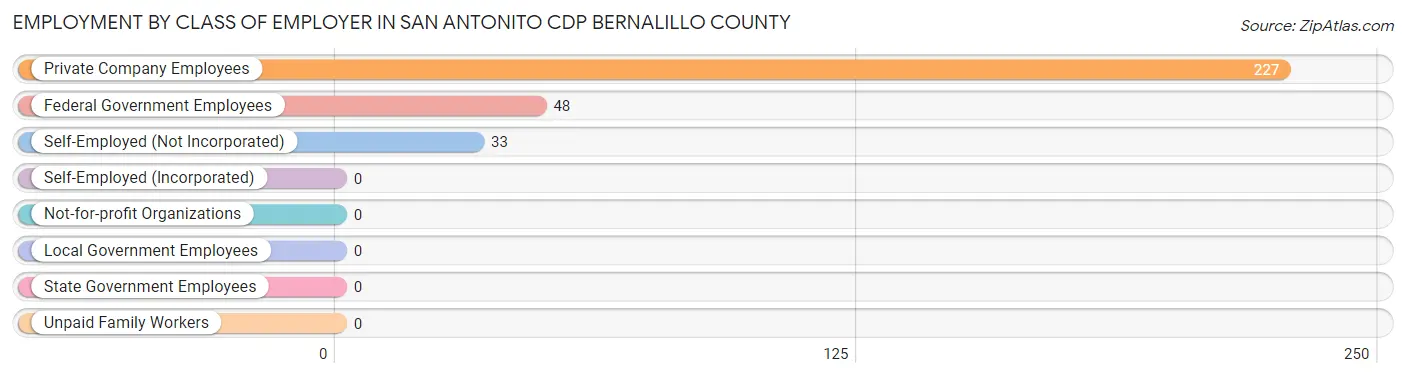
| Employer Class | # Employees | % Employees |
| Private Company Employees | 227 | 73.7% |
| Self-Employed (Incorporated) | 0 | 0.0% |
| Self-Employed (Not Incorporated) | 33 | 10.7% |
| Not-for-profit Organizations | 0 | 0.0% |
| Local Government Employees | 0 | 0.0% |
| State Government Employees | 0 | 0.0% |
| Federal Government Employees | 48 | 15.6% |
| Unpaid Family Workers | 0 | 0.0% |
| Total | 308 | 100.0% |
Employment Status by Age in San Antonito CDP Bernalillo County
According to the labor force statistics for San Antonito CDP Bernalillo County, out of the total population over 16 years of age (587), 55.9% or 328 individuals are in the labor force, with 6.1% or 20 of them unemployed. The age group with the highest labor force participation rate is 25 to 29 years, with 100.0% or 59 individuals in the labor force. Within the labor force, the 35 to 44 years age range has the highest percentage of unemployed individuals, with 25.3% or 20 of them being unemployed.
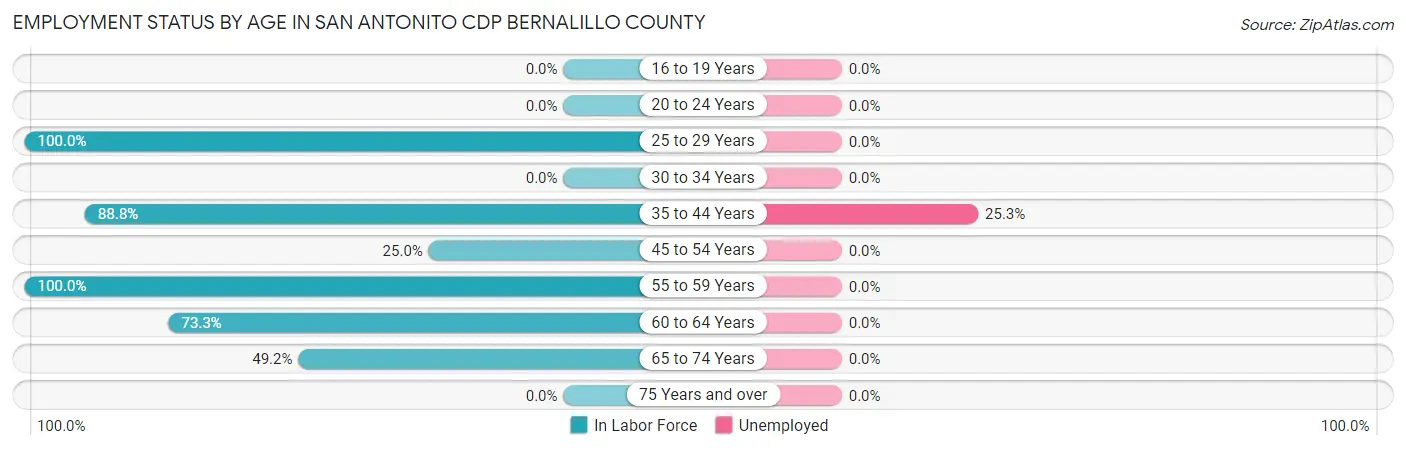
| Age Bracket | In Labor Force | Unemployed |
| 16 to 19 Years | 0 (0.0%) | 0 (0.0%) |
| 20 to 24 Years | 0 (0.0%) | 0 (0.0%) |
| 25 to 29 Years | 59 (100.0%) | 0 (0.0%) |
| 30 to 34 Years | 0 (0.0%) | 0 (0.0%) |
| 35 to 44 Years | 79 (88.8%) | 20 (25.3%) |
| 45 to 54 Years | 9 (25.0%) | 0 (0.0%) |
| 55 to 59 Years | 51 (100.0%) | 0 (0.0%) |
| 60 to 64 Years | 33 (73.3%) | 0 (0.0%) |
| 65 to 74 Years | 97 (49.2%) | 0 (0.0%) |
| 75 Years and over | 0 (0.0%) | 0 (0.0%) |
| Total | 328 (55.9%) | 20 (6.1%) |
Employment Status by Educational Attainment in San Antonito CDP Bernalillo County
According to labor force statistics for San Antonito CDP Bernalillo County, 74.3% of individuals (231) out of the total population between 25 and 64 years of age (311) are in the labor force, with 8.7% or 20 of them being unemployed. The group with the highest labor force participation rate are those with the educational attainment of high school diploma, with 100.0% or 9 individuals in the labor force. Within the labor force, individuals with bachelor's degree or higher education have the highest percentage of unemployment, with 9.3% or 10 of them being unemployed.
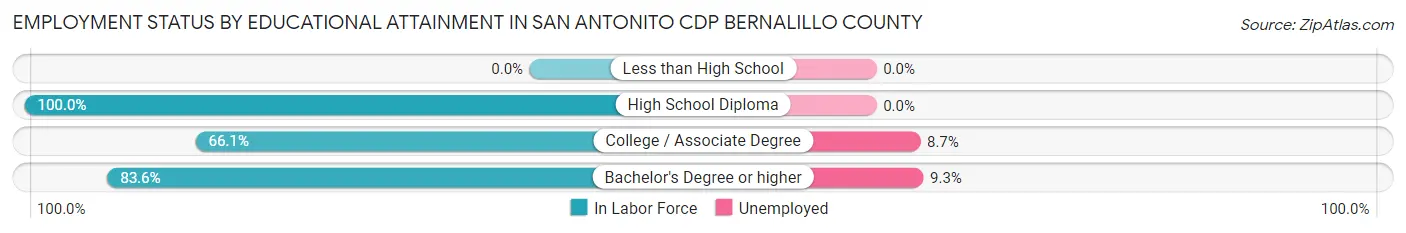
| Educational Attainment | In Labor Force | Unemployed |
| Less than High School | 0 (0.0%) | 0 (0.0%) |
| High School Diploma | 9 (100.0%) | 0 (0.0%) |
| College / Associate Degree | 115 (66.1%) | 15 (8.7%) |
| Bachelor's Degree or higher | 107 (83.6%) | 12 (9.3%) |
| Total | 231 (74.3%) | 27 (8.7%) |
Employment Occupations by Sex in San Antonito CDP Bernalillo County
Management, Business, Science and Arts Occupations
The most common Management, Business, Science and Arts occupations in San Antonito CDP Bernalillo County are Computers, Engineering & Science (75 | 24.3%), Business & Financial (51 | 16.6%), Architecture & Engineering (32 | 10.4%), Computers & Mathematics (23 | 7.5%), and Life, Physical & Social Science (20 | 6.5%).
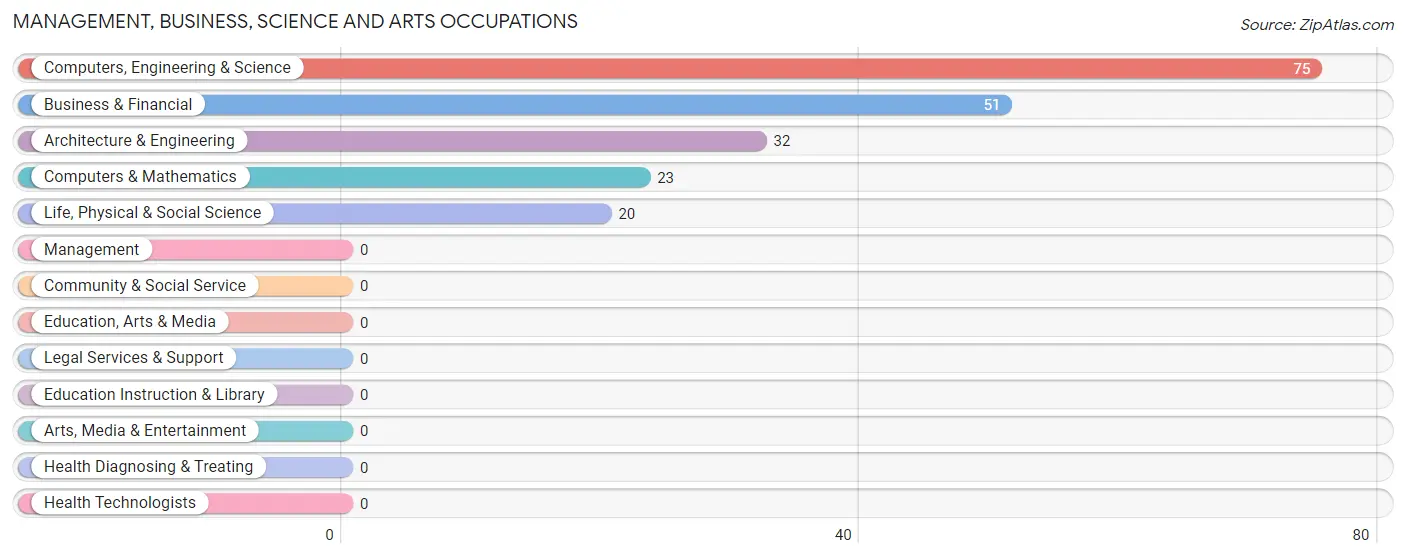
Management, Business, Science and Arts Occupations by Sex
Within the Management, Business, Science and Arts occupations in San Antonito CDP Bernalillo County, the most male-oriented occupations are Business & Financial (100.0%), Computers & Mathematics (100.0%), and Life, Physical & Social Science (100.0%), while the most female-oriented occupations are Architecture & Engineering (78.1%), and Computers, Engineering & Science (33.3%).
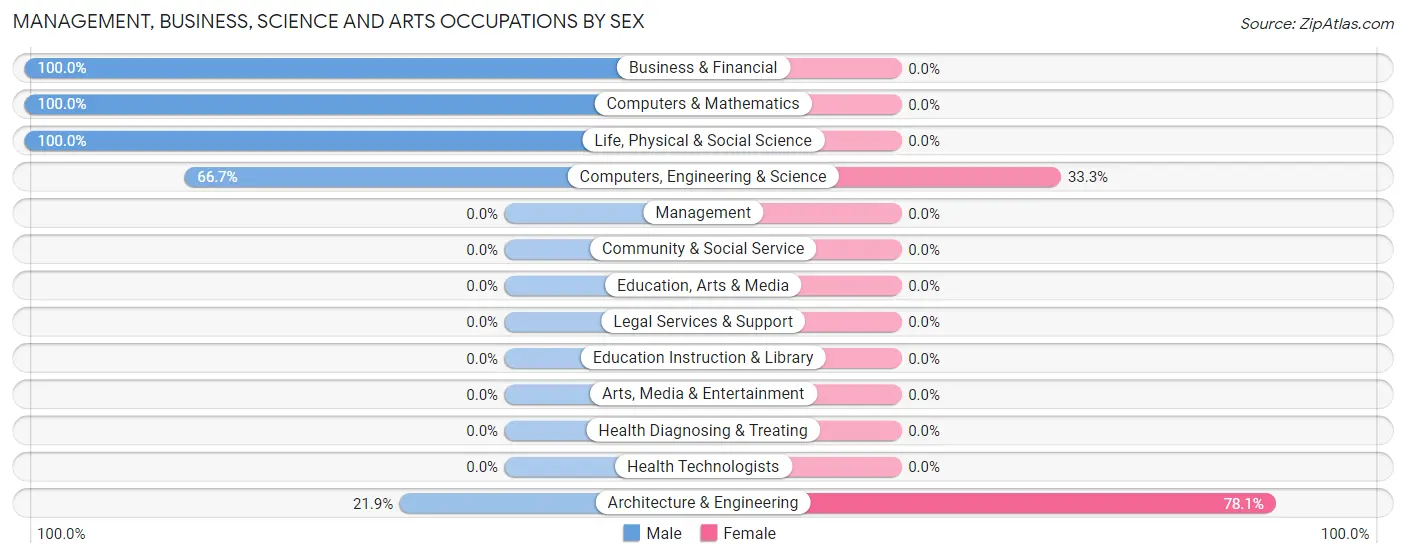
| Occupation | Male | Female |
| Management | 0 (0.0%) | 0 (0.0%) |
| Business & Financial | 51 (100.0%) | 0 (0.0%) |
| Computers, Engineering & Science | 50 (66.7%) | 25 (33.3%) |
| Computers & Mathematics | 23 (100.0%) | 0 (0.0%) |
| Architecture & Engineering | 7 (21.9%) | 25 (78.1%) |
| Life, Physical & Social Science | 20 (100.0%) | 0 (0.0%) |
| Community & Social Service | 0 (0.0%) | 0 (0.0%) |
| Education, Arts & Media | 0 (0.0%) | 0 (0.0%) |
| Legal Services & Support | 0 (0.0%) | 0 (0.0%) |
| Education Instruction & Library | 0 (0.0%) | 0 (0.0%) |
| Arts, Media & Entertainment | 0 (0.0%) | 0 (0.0%) |
| Health Diagnosing & Treating | 0 (0.0%) | 0 (0.0%) |
| Health Technologists | 0 (0.0%) | 0 (0.0%) |
| Total (Category) | 101 (80.2%) | 25 (19.8%) |
| Total (Overall) | 200 (64.9%) | 108 (35.1%) |
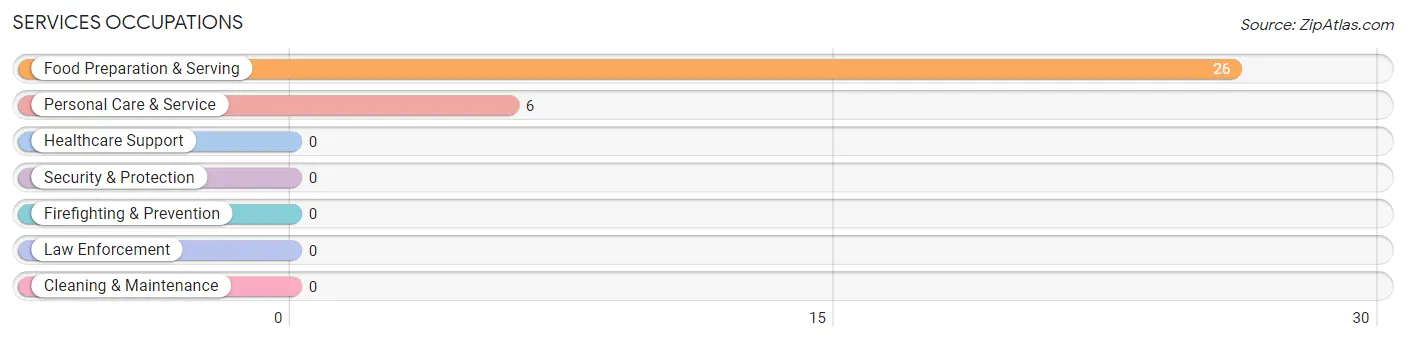
Services Occupations
The most common Services occupations in San Antonito CDP Bernalillo County are Food Preparation & Serving (26 | 8.4%), and Personal Care & Service (6 | 1.9%).
Services Occupations by Sex
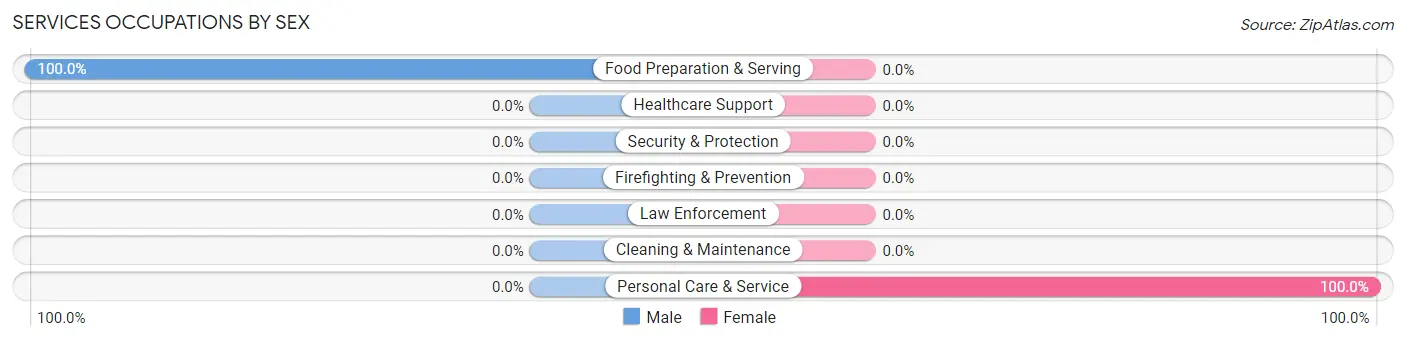
| Occupation | Male | Female |
| Healthcare Support | 0 (0.0%) | 0 (0.0%) |
| Security & Protection | 0 (0.0%) | 0 (0.0%) |
| Firefighting & Prevention | 0 (0.0%) | 0 (0.0%) |
| Law Enforcement | 0 (0.0%) | 0 (0.0%) |
| Food Preparation & Serving | 26 (100.0%) | 0 (0.0%) |
| Cleaning & Maintenance | 0 (0.0%) | 0 (0.0%) |
| Personal Care & Service | 0 (0.0%) | 6 (100.0%) |
| Total (Category) | 26 (81.2%) | 6 (18.8%) |
| Total (Overall) | 200 (64.9%) | 108 (35.1%) |
Sales and Office Occupations
The most common Sales and Office occupations in San Antonito CDP Bernalillo County are Office & Administration (50 | 16.2%), and Sales & Related (8 | 2.6%).
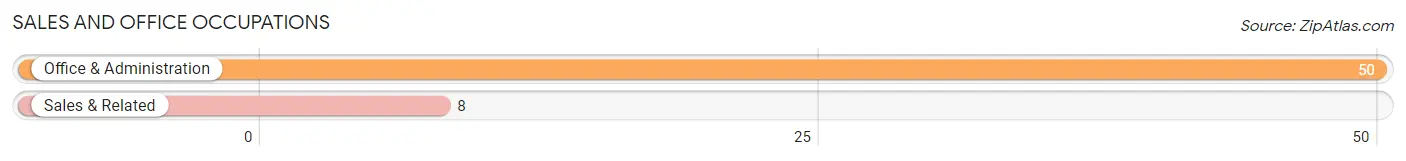
Sales and Office Occupations by Sex

| Occupation | Male | Female |
| Sales & Related | 8 (100.0%) | 0 (0.0%) |
| Office & Administration | 0 (0.0%) | 50 (100.0%) |
| Total (Category) | 8 (13.8%) | 50 (86.2%) |
| Total (Overall) | 200 (64.9%) | 108 (35.1%) |
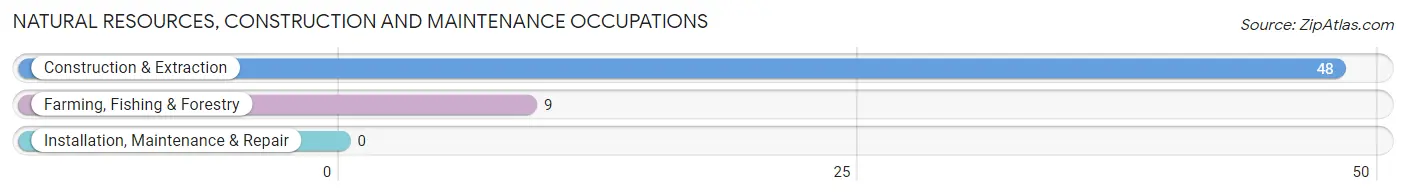
Natural Resources, Construction and Maintenance Occupations
The most common Natural Resources, Construction and Maintenance occupations in San Antonito CDP Bernalillo County are Construction & Extraction (48 | 15.6%), and Farming, Fishing & Forestry (9 | 2.9%).
Natural Resources, Construction and Maintenance Occupations by Sex
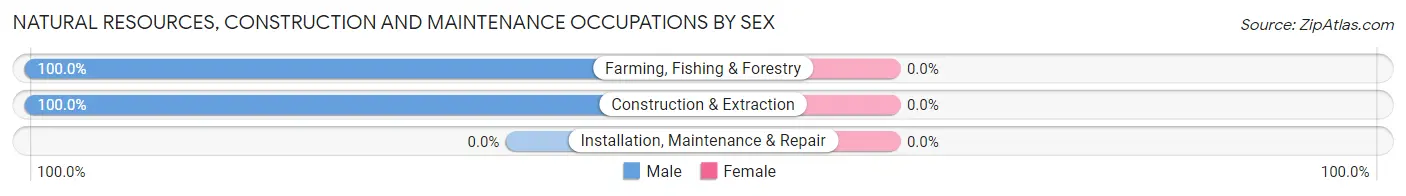
| Occupation | Male | Female |
| Farming, Fishing & Forestry | 9 (100.0%) | 0 (0.0%) |
| Construction & Extraction | 48 (100.0%) | 0 (0.0%) |
| Installation, Maintenance & Repair | 0 (0.0%) | 0 (0.0%) |
| Total (Category) | 57 (100.0%) | 0 (0.0%) |
| Total (Overall) | 200 (64.9%) | 108 (35.1%) |
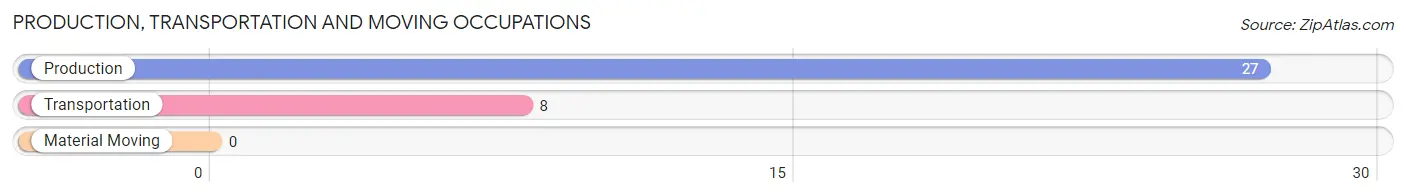
Production, Transportation and Moving Occupations
The most common Production, Transportation and Moving occupations in San Antonito CDP Bernalillo County are Production (27 | 8.8%), and Transportation (8 | 2.6%).
Production, Transportation and Moving Occupations by Sex
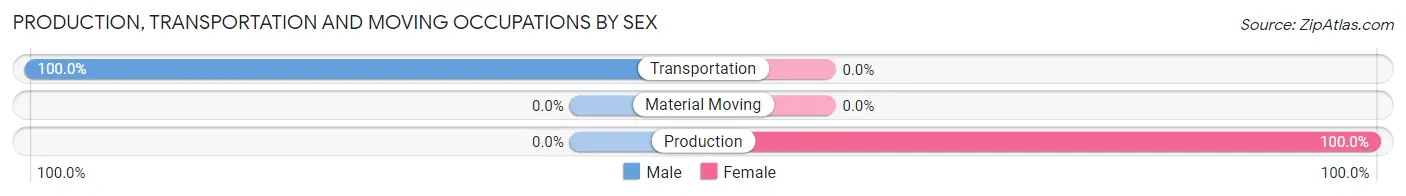
| Occupation | Male | Female |
| Production | 0 (0.0%) | 27 (100.0%) |
| Transportation | 8 (100.0%) | 0 (0.0%) |
| Material Moving | 0 (0.0%) | 0 (0.0%) |
| Total (Category) | 8 (22.9%) | 27 (77.1%) |
| Total (Overall) | 200 (64.9%) | 108 (35.1%) |
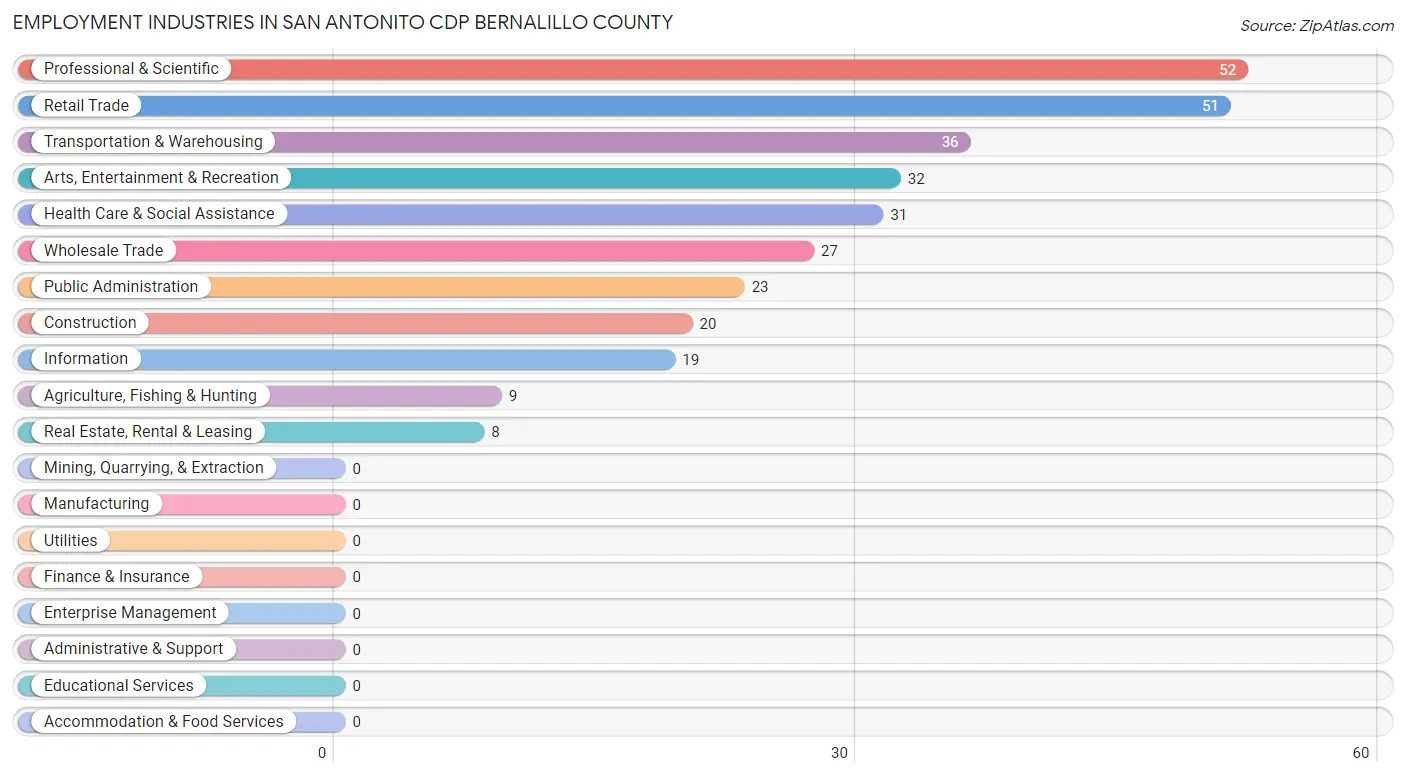
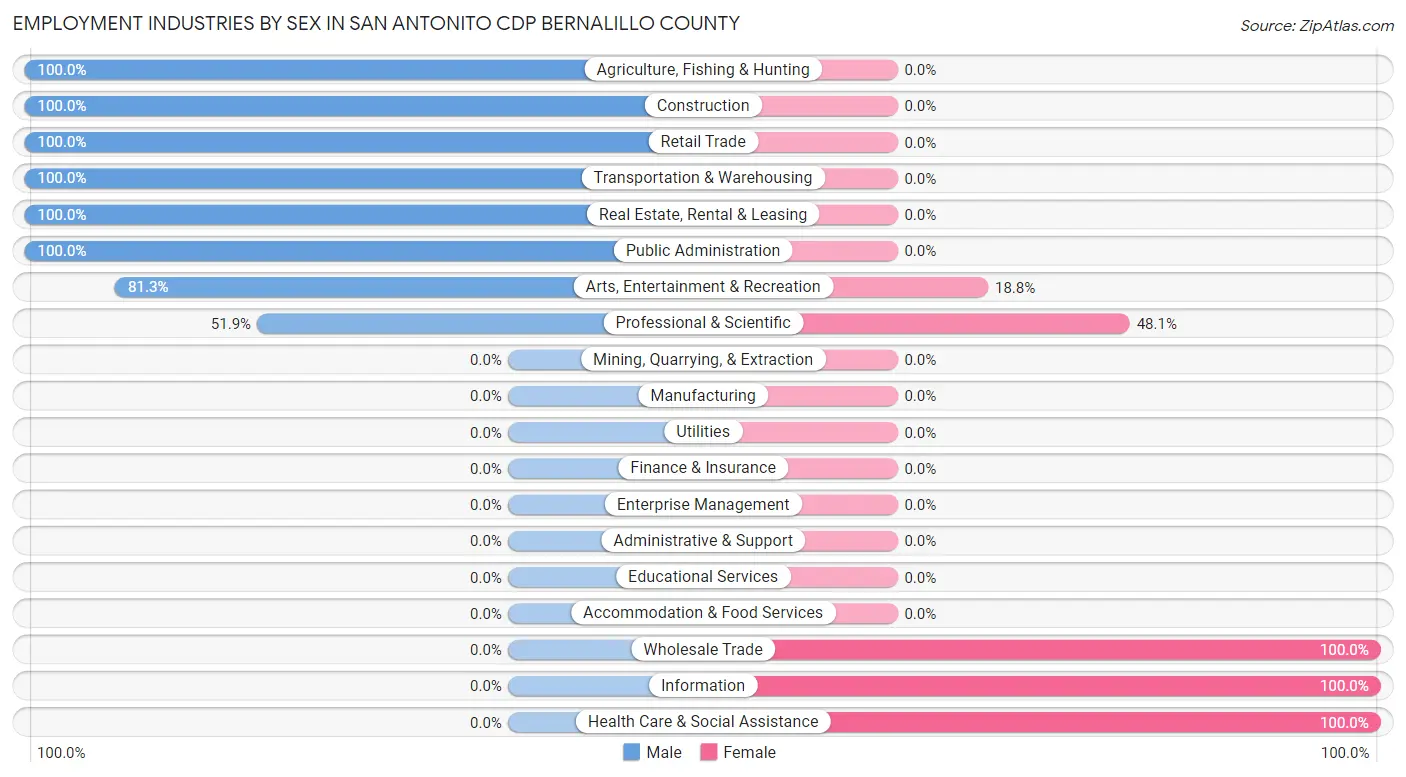
Employment Industries by Sex in San Antonito CDP Bernalillo County
Employment Industries in San Antonito CDP Bernalillo County
The major employment industries in San Antonito CDP Bernalillo County include Professional & Scientific (52 | 16.9%), Retail Trade (51 | 16.6%), Transportation & Warehousing (36 | 11.7%), Arts, Entertainment & Recreation (32 | 10.4%), and Health Care & Social Assistance (31 | 10.1%).
Employment Industries by Sex in San Antonito CDP Bernalillo County
The San Antonito CDP Bernalillo County industries that see more men than women are Agriculture, Fishing & Hunting (100.0%), Construction (100.0%), and Retail Trade (100.0%), whereas the industries that tend to have a higher number of women are Wholesale Trade (100.0%), Information (100.0%), and Health Care & Social Assistance (100.0%).
| Industry | Male | Female |
| Agriculture, Fishing & Hunting | 9 (100.0%) | 0 (0.0%) |
| Mining, Quarrying, & Extraction | 0 (0.0%) | 0 (0.0%) |
| Construction | 20 (100.0%) | 0 (0.0%) |
| Manufacturing | 0 (0.0%) | 0 (0.0%) |
| Wholesale Trade | 0 (0.0%) | 27 (100.0%) |
| Retail Trade | 51 (100.0%) | 0 (0.0%) |
| Transportation & Warehousing | 36 (100.0%) | 0 (0.0%) |
| Utilities | 0 (0.0%) | 0 (0.0%) |
| Information | 0 (0.0%) | 19 (100.0%) |
| Finance & Insurance | 0 (0.0%) | 0 (0.0%) |
| Real Estate, Rental & Leasing | 8 (100.0%) | 0 (0.0%) |
| Professional & Scientific | 27 (51.9%) | 25 (48.1%) |
| Enterprise Management | 0 (0.0%) | 0 (0.0%) |
| Administrative & Support | 0 (0.0%) | 0 (0.0%) |
| Educational Services | 0 (0.0%) | 0 (0.0%) |
| Health Care & Social Assistance | 0 (0.0%) | 31 (100.0%) |
| Arts, Entertainment & Recreation | 26 (81.2%) | 6 (18.8%) |
| Accommodation & Food Services | 0 (0.0%) | 0 (0.0%) |
| Public Administration | 23 (100.0%) | 0 (0.0%) |
| Total | 200 (64.9%) | 108 (35.1%) |
Education in San Antonito CDP Bernalillo County
School Enrollment in San Antonito CDP Bernalillo County
The most common levels of schooling among the 165 students in San Antonito CDP Bernalillo County are elementary school (70 | 42.4%), college / undergraduate (59 | 35.8%), and kindergarten (25 | 15.1%).
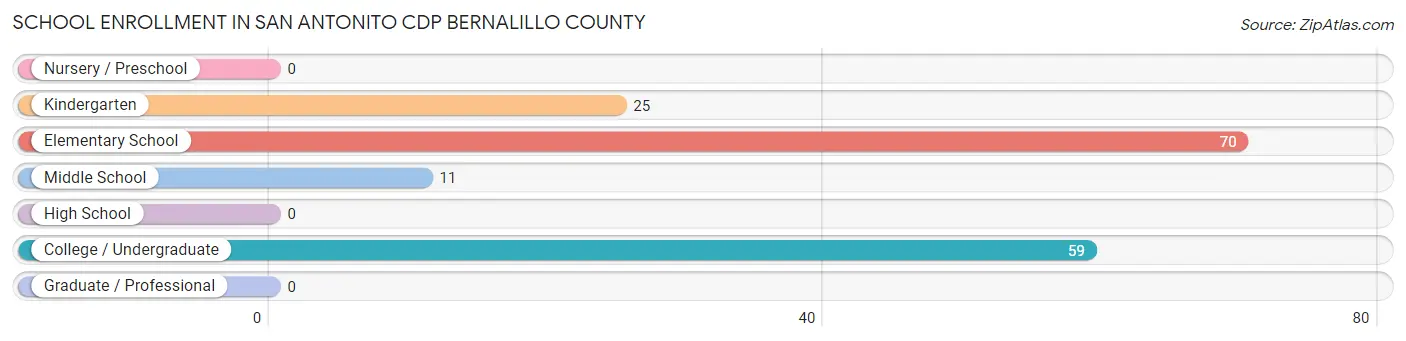
| School Level | # Students | % Students |
| Nursery / Preschool | 0 | 0.0% |
| Kindergarten | 25 | 15.1% |
| Elementary School | 70 | 42.4% |
| Middle School | 11 | 6.7% |
| High School | 0 | 0.0% |
| College / Undergraduate | 59 | 35.8% |
| Graduate / Professional | 0 | 0.0% |
| Total | 165 | 100.0% |
School Enrollment by Age by Funding Source in San Antonito CDP Bernalillo County
Out of a total of 165 students who are enrolled in schools in San Antonito CDP Bernalillo County, 25 (15.2%) attend a private institution, while the remaining 140 (84.8%) are enrolled in public schools. The age group of 5 to 9 year old has the highest likelihood of being enrolled in private schools, with 25 (26.3% in the age bracket) enrolled. Conversely, the age group of 10 to 14 year olds has the lowest likelihood of being enrolled in a private school, with 11 (100.0% in the age bracket) attending a public institution.
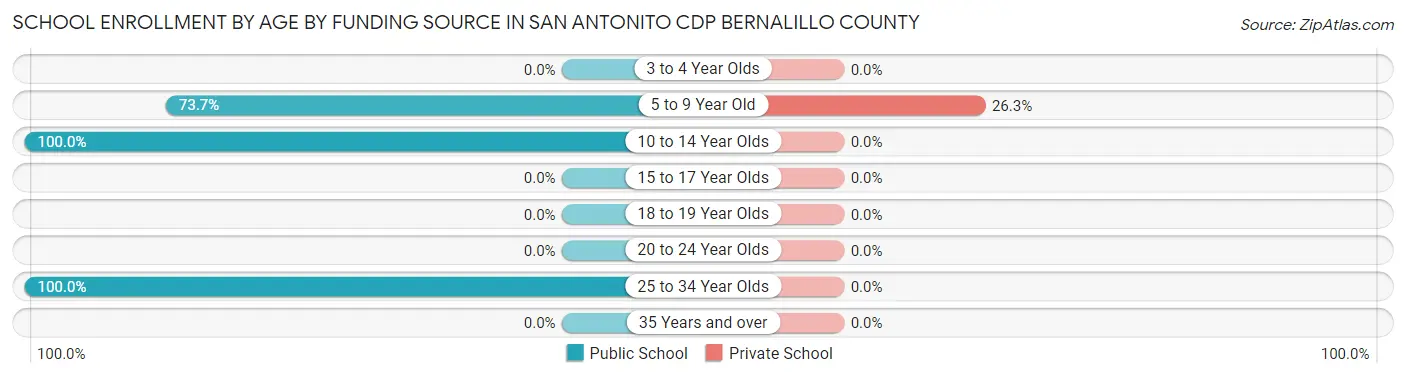
| Age Bracket | Public School | Private School |
| 3 to 4 Year Olds | 0 (0.0%) | 0 (0.0%) |
| 5 to 9 Year Old | 70 (73.7%) | 25 (26.3%) |
| 10 to 14 Year Olds | 11 (100.0%) | 0 (0.0%) |
| 15 to 17 Year Olds | 0 (0.0%) | 0 (0.0%) |
| 18 to 19 Year Olds | 0 (0.0%) | 0 (0.0%) |
| 20 to 24 Year Olds | 0 (0.0%) | 0 (0.0%) |
| 25 to 34 Year Olds | 59 (100.0%) | 0 (0.0%) |
| 35 Years and over | 0 (0.0%) | 0 (0.0%) |
| Total | 140 (84.8%) | 25 (15.2%) |
Educational Attainment by Field of Study in San Antonito CDP Bernalillo County
Bio, nature & agricultural (51 | 14.3%), science & technology (51 | 14.3%), engineering (44 | 12.3%), arts & humanities (37 | 10.4%), and literature & languages (34 | 9.5%) are the most common fields of study among 357 individuals in San Antonito CDP Bernalillo County who have obtained a bachelor's degree or higher.
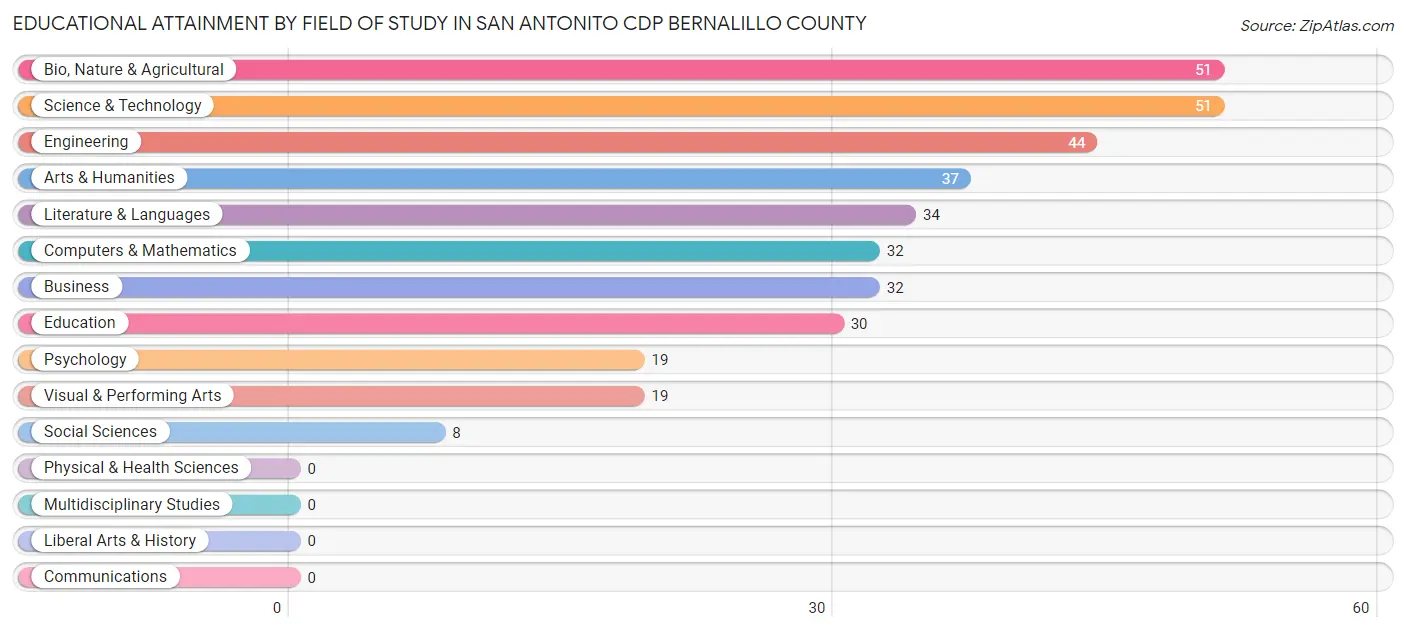
| Field of Study | # Graduates | % Graduates |
| Computers & Mathematics | 32 | 9.0% |
| Bio, Nature & Agricultural | 51 | 14.3% |
| Physical & Health Sciences | 0 | 0.0% |
| Psychology | 19 | 5.3% |
| Social Sciences | 8 | 2.2% |
| Engineering | 44 | 12.3% |
| Multidisciplinary Studies | 0 | 0.0% |
| Science & Technology | 51 | 14.3% |
| Business | 32 | 9.0% |
| Education | 30 | 8.4% |
| Literature & Languages | 34 | 9.5% |
| Liberal Arts & History | 0 | 0.0% |
| Visual & Performing Arts | 19 | 5.3% |
| Communications | 0 | 0.0% |
| Arts & Humanities | 37 | 10.4% |
| Total | 357 | 100.0% |
Transportation & Commute in San Antonito CDP Bernalillo County
Vehicle Availability by Sex in San Antonito CDP Bernalillo County
The most prevalent vehicle ownership categories in San Antonito CDP Bernalillo County are males with 1 vehicle (79, accounting for 39.5%) and females with 1 vehicle (19, making up 73.2%).
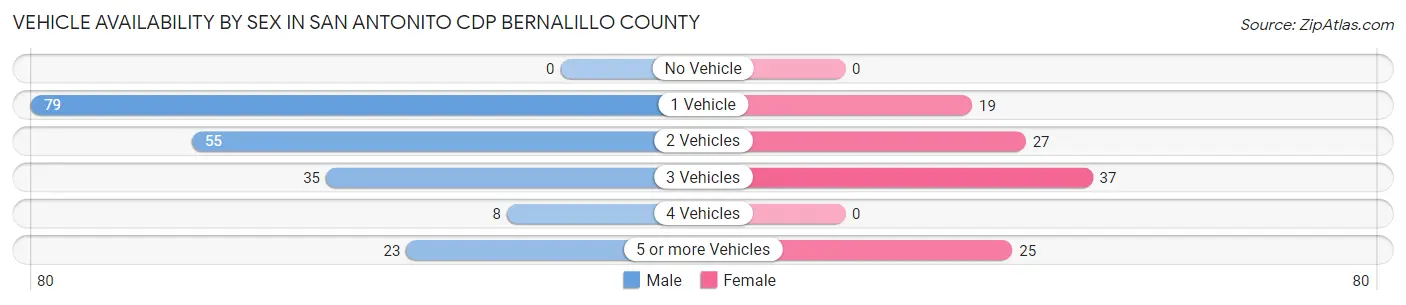
| Vehicles Available | Male | Female |
| No Vehicle | 0 (0.0%) | 0 (0.0%) |
| 1 Vehicle | 79 (39.5%) | 19 (17.6%) |
| 2 Vehicles | 55 (27.5%) | 27 (25.0%) |
| 3 Vehicles | 35 (17.5%) | 37 (34.3%) |
| 4 Vehicles | 8 (4.0%) | 0 (0.0%) |
| 5 or more Vehicles | 23 (11.5%) | 25 (23.2%) |
| Total | 200 (100.0%) | 108 (100.0%) |
Commute Time in San Antonito CDP Bernalillo County
The most frequently occuring commute durations in San Antonito CDP Bernalillo County are less than 5 minutes (78 commuters, 25.3%), 25 to 29 minutes (65 commuters, 21.1%), and 30 to 34 minutes (56 commuters, 18.2%).
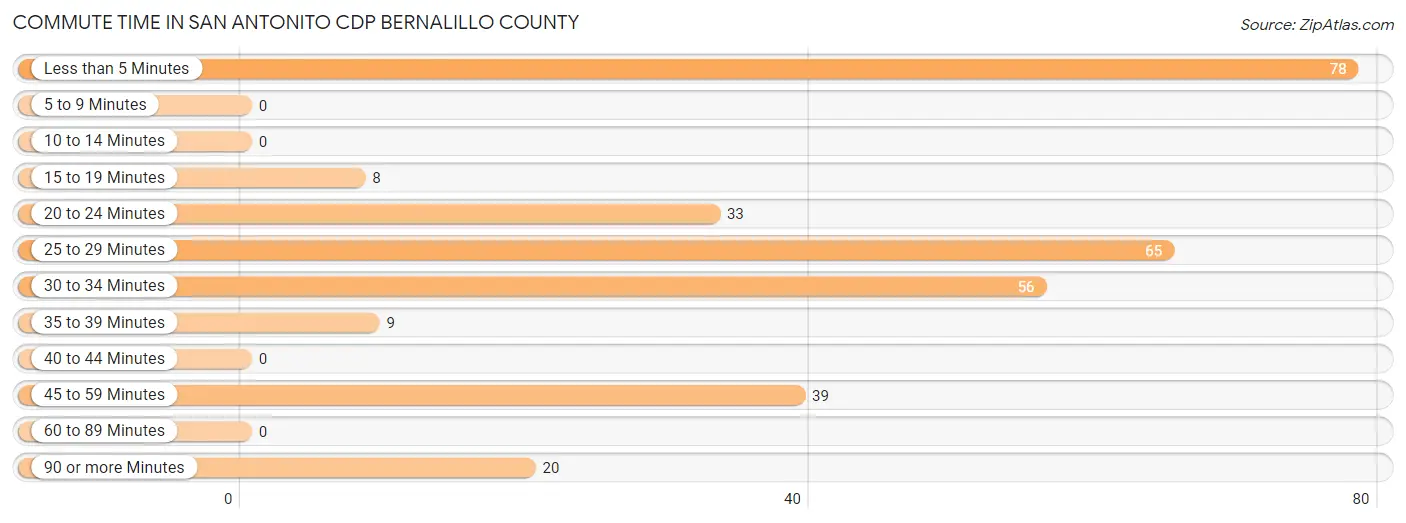
| Commute Time | # Commuters | % Commuters |
| Less than 5 Minutes | 78 | 25.3% |
| 5 to 9 Minutes | 0 | 0.0% |
| 10 to 14 Minutes | 0 | 0.0% |
| 15 to 19 Minutes | 8 | 2.6% |
| 20 to 24 Minutes | 33 | 10.7% |
| 25 to 29 Minutes | 65 | 21.1% |
| 30 to 34 Minutes | 56 | 18.2% |
| 35 to 39 Minutes | 9 | 2.9% |
| 40 to 44 Minutes | 0 | 0.0% |
| 45 to 59 Minutes | 39 | 12.7% |
| 60 to 89 Minutes | 0 | 0.0% |
| 90 or more Minutes | 20 | 6.5% |
Commute Time by Sex in San Antonito CDP Bernalillo County
The most common commute times in San Antonito CDP Bernalillo County are less than 5 minutes (51 commuters, 25.5%) for males and 25 to 29 minutes (37 commuters, 34.3%) for females.
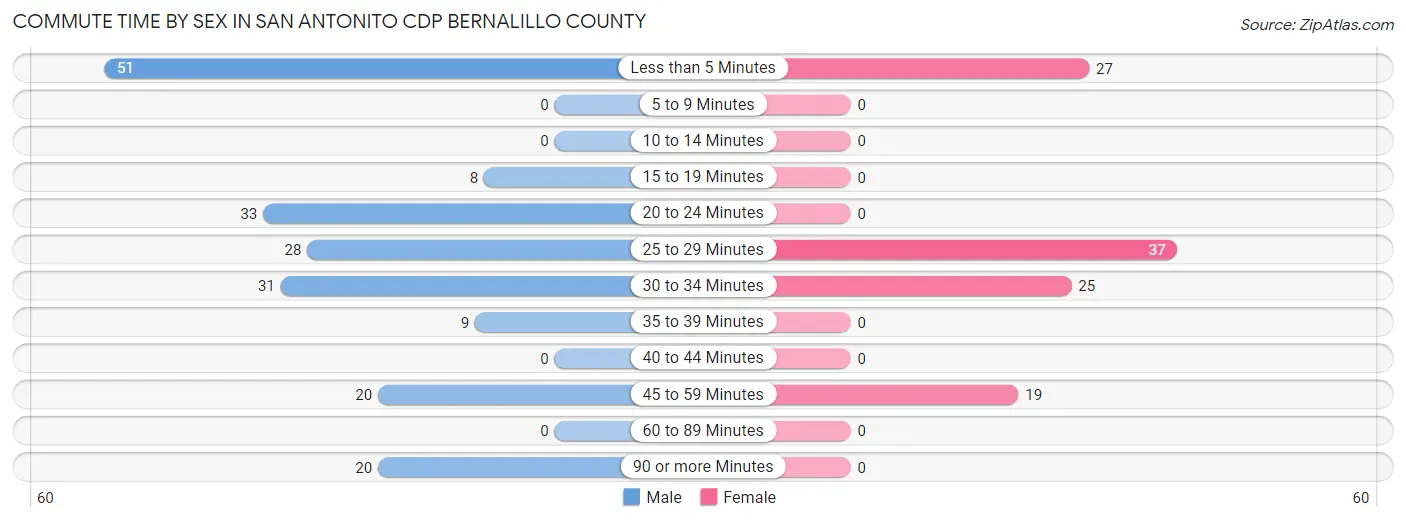
| Commute Time | Male | Female |
| Less than 5 Minutes | 51 (25.5%) | 27 (25.0%) |
| 5 to 9 Minutes | 0 (0.0%) | 0 (0.0%) |
| 10 to 14 Minutes | 0 (0.0%) | 0 (0.0%) |
| 15 to 19 Minutes | 8 (4.0%) | 0 (0.0%) |
| 20 to 24 Minutes | 33 (16.5%) | 0 (0.0%) |
| 25 to 29 Minutes | 28 (14.0%) | 37 (34.3%) |
| 30 to 34 Minutes | 31 (15.5%) | 25 (23.2%) |
| 35 to 39 Minutes | 9 (4.5%) | 0 (0.0%) |
| 40 to 44 Minutes | 0 (0.0%) | 0 (0.0%) |
| 45 to 59 Minutes | 20 (10.0%) | 19 (17.6%) |
| 60 to 89 Minutes | 0 (0.0%) | 0 (0.0%) |
| 90 or more Minutes | 20 (10.0%) | 0 (0.0%) |
Time of Departure to Work by Sex in San Antonito CDP Bernalillo County
The most frequent times of departure to work in San Antonito CDP Bernalillo County are 6:00 AM to 6:29 AM (71, 35.5%) for males and 7:00 AM to 7:29 AM (56, 51.8%) for females.
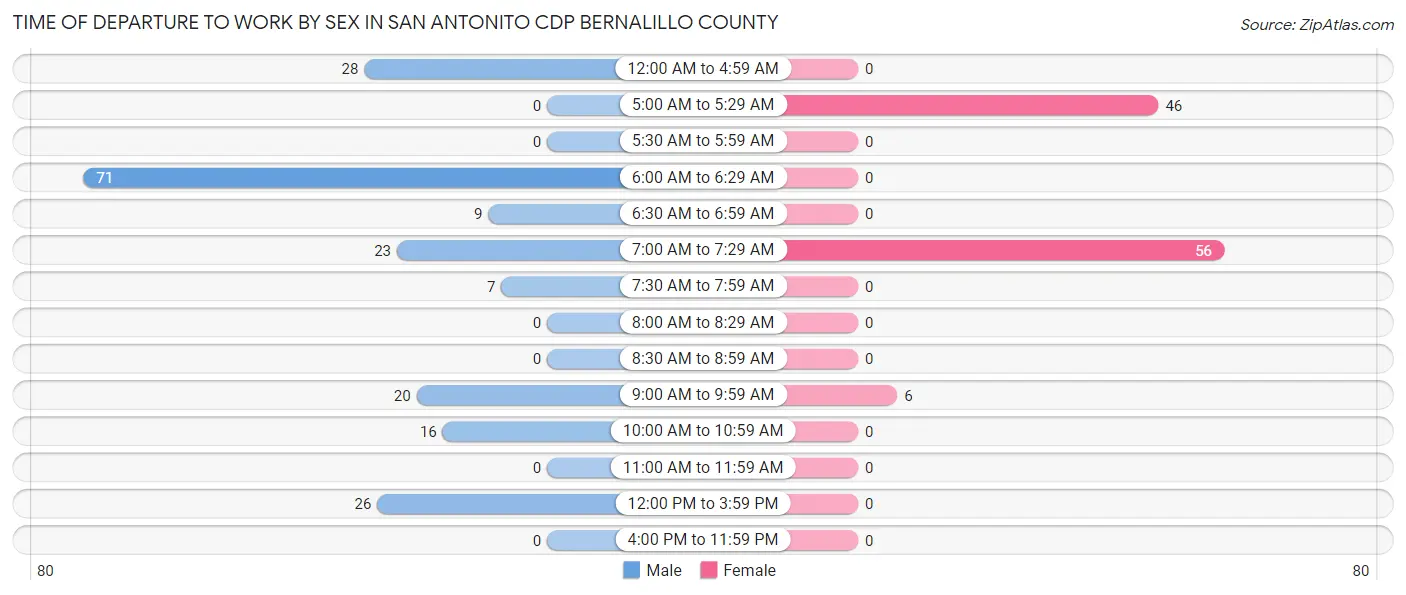
| Time of Departure | Male | Female |
| 12:00 AM to 4:59 AM | 28 (14.0%) | 0 (0.0%) |
| 5:00 AM to 5:29 AM | 0 (0.0%) | 46 (42.6%) |
| 5:30 AM to 5:59 AM | 0 (0.0%) | 0 (0.0%) |
| 6:00 AM to 6:29 AM | 71 (35.5%) | 0 (0.0%) |
| 6:30 AM to 6:59 AM | 9 (4.5%) | 0 (0.0%) |
| 7:00 AM to 7:29 AM | 23 (11.5%) | 56 (51.8%) |
| 7:30 AM to 7:59 AM | 7 (3.5%) | 0 (0.0%) |
| 8:00 AM to 8:29 AM | 0 (0.0%) | 0 (0.0%) |
| 8:30 AM to 8:59 AM | 0 (0.0%) | 0 (0.0%) |
| 9:00 AM to 9:59 AM | 20 (10.0%) | 6 (5.6%) |
| 10:00 AM to 10:59 AM | 16 (8.0%) | 0 (0.0%) |
| 11:00 AM to 11:59 AM | 0 (0.0%) | 0 (0.0%) |
| 12:00 PM to 3:59 PM | 26 (13.0%) | 0 (0.0%) |
| 4:00 PM to 11:59 PM | 0 (0.0%) | 0 (0.0%) |
| Total | 200 (100.0%) | 108 (100.0%) |
Housing Occupancy in San Antonito CDP Bernalillo County
Occupancy by Ownership in San Antonito CDP Bernalillo County
Of the total 377 dwellings in San Antonito CDP Bernalillo County, owner-occupied units account for 342 (90.7%), while renter-occupied units make up 35 (9.3%).
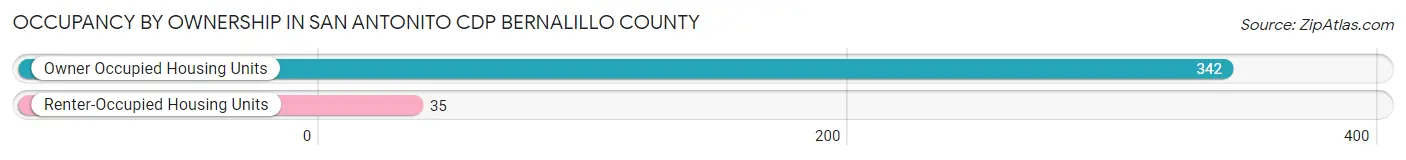
| Occupancy | # Housing Units | % Housing Units |
| Owner Occupied Housing Units | 342 | 90.7% |
| Renter-Occupied Housing Units | 35 | 9.3% |
| Total Occupied Housing Units | 377 | 100.0% |
Occupancy by Household Size in San Antonito CDP Bernalillo County
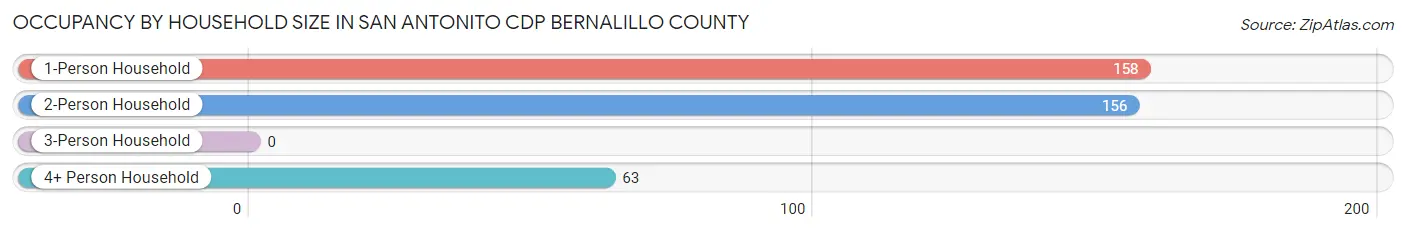
| Household Size | # Housing Units | % Housing Units |
| 1-Person Household | 158 | 41.9% |
| 2-Person Household | 156 | 41.4% |
| 3-Person Household | 0 | 0.0% |
| 4+ Person Household | 63 | 16.7% |
| Total Housing Units | 377 | 100.0% |
Occupancy by Ownership by Household Size in San Antonito CDP Bernalillo County
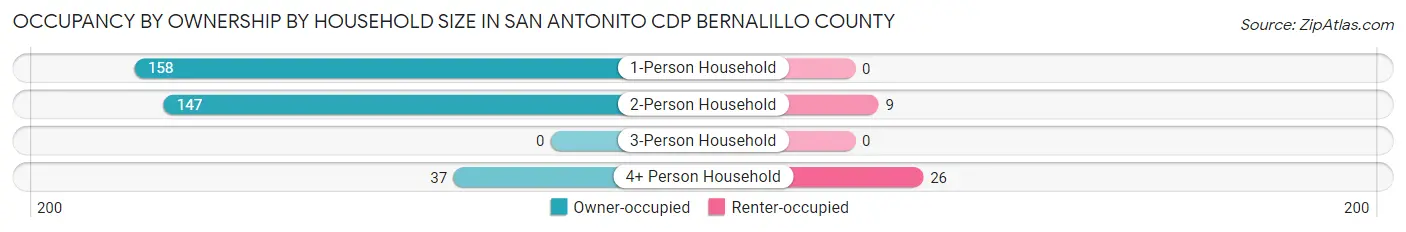
| Household Size | Owner-occupied | Renter-occupied |
| 1-Person Household | 158 (100.0%) | 0 (0.0%) |
| 2-Person Household | 147 (94.2%) | 9 (5.8%) |
| 3-Person Household | 0 (0.0%) | 0 (0.0%) |
| 4+ Person Household | 37 (58.7%) | 26 (41.3%) |
| Total Housing Units | 342 (90.7%) | 35 (9.3%) |
Occupancy by Educational Attainment in San Antonito CDP Bernalillo County
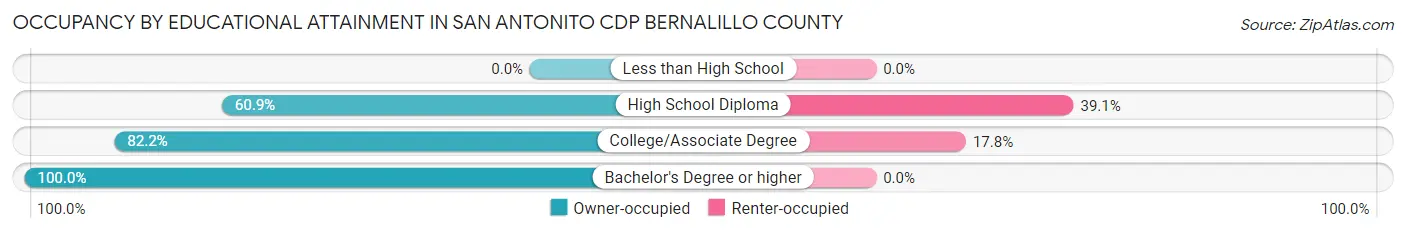
| Household Size | Owner-occupied | Renter-occupied |
| Less than High School | 0 (0.0%) | 0 (0.0%) |
| High School Diploma | 14 (60.9%) | 9 (39.1%) |
| College/Associate Degree | 120 (82.2%) | 26 (17.8%) |
| Bachelor's Degree or higher | 208 (100.0%) | 0 (0.0%) |
Occupancy by Age of Householder in San Antonito CDP Bernalillo County
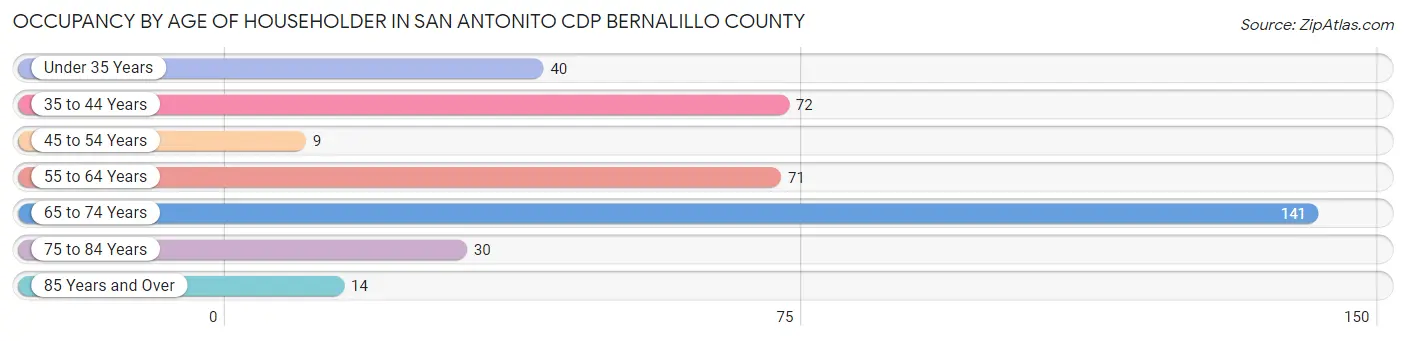
| Age Bracket | # Households | % Households |
| Under 35 Years | 40 | 10.6% |
| 35 to 44 Years | 72 | 19.1% |
| 45 to 54 Years | 9 | 2.4% |
| 55 to 64 Years | 71 | 18.8% |
| 65 to 74 Years | 141 | 37.4% |
| 75 to 84 Years | 30 | 8.0% |
| 85 Years and Over | 14 | 3.7% |
| Total | 377 | 100.0% |
Housing Finances in San Antonito CDP Bernalillo County
Median Income by Occupancy in San Antonito CDP Bernalillo County
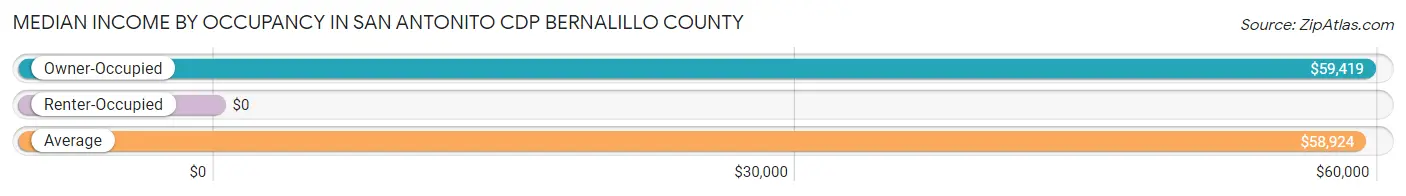
| Occupancy Type | # Households | Median Income |
| Owner-Occupied | 342 (90.7%) | $59,419 |
| Renter-Occupied | 35 (9.3%) | $0 |
| Average | 377 (100.0%) | $58,924 |
Occupancy by Householder Income Bracket in San Antonito CDP Bernalillo County
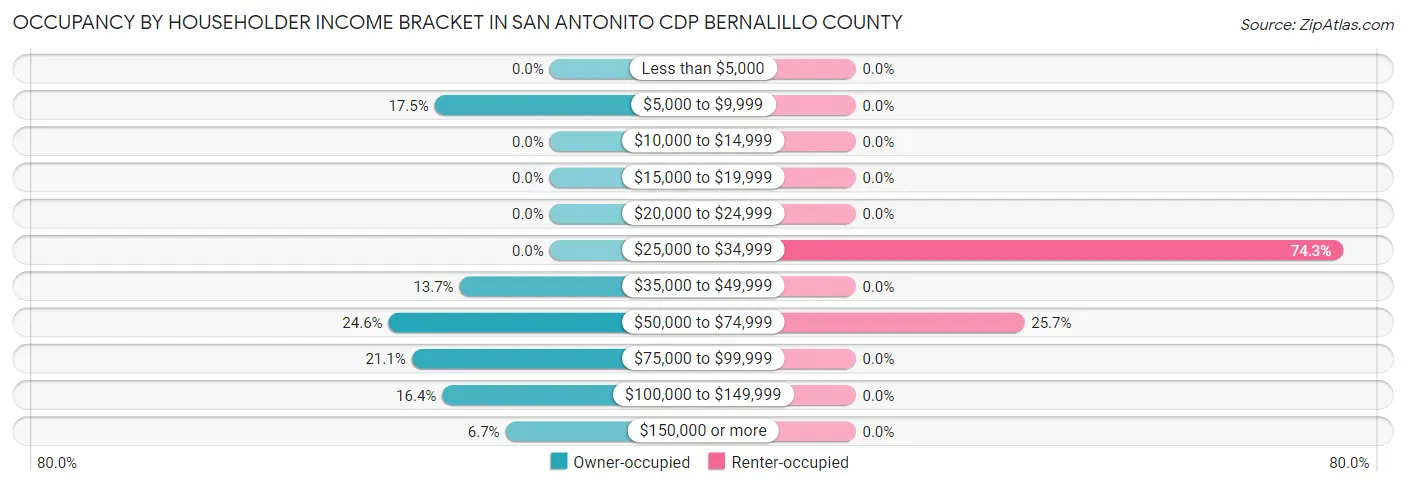
| Income Bracket | Owner-occupied | Renter-occupied |
| Less than $5,000 | 0 (0.0%) | 0 (0.0%) |
| $5,000 to $9,999 | 60 (17.5%) | 0 (0.0%) |
| $10,000 to $14,999 | 0 (0.0%) | 0 (0.0%) |
| $15,000 to $19,999 | 0 (0.0%) | 0 (0.0%) |
| $20,000 to $24,999 | 0 (0.0%) | 0 (0.0%) |
| $25,000 to $34,999 | 0 (0.0%) | 26 (74.3%) |
| $35,000 to $49,999 | 47 (13.7%) | 0 (0.0%) |
| $50,000 to $74,999 | 84 (24.6%) | 9 (25.7%) |
| $75,000 to $99,999 | 72 (21.0%) | 0 (0.0%) |
| $100,000 to $149,999 | 56 (16.4%) | 0 (0.0%) |
| $150,000 or more | 23 (6.7%) | 0 (0.0%) |
| Total | 342 (100.0%) | 35 (100.0%) |
Monthly Housing Cost Tiers in San Antonito CDP Bernalillo County
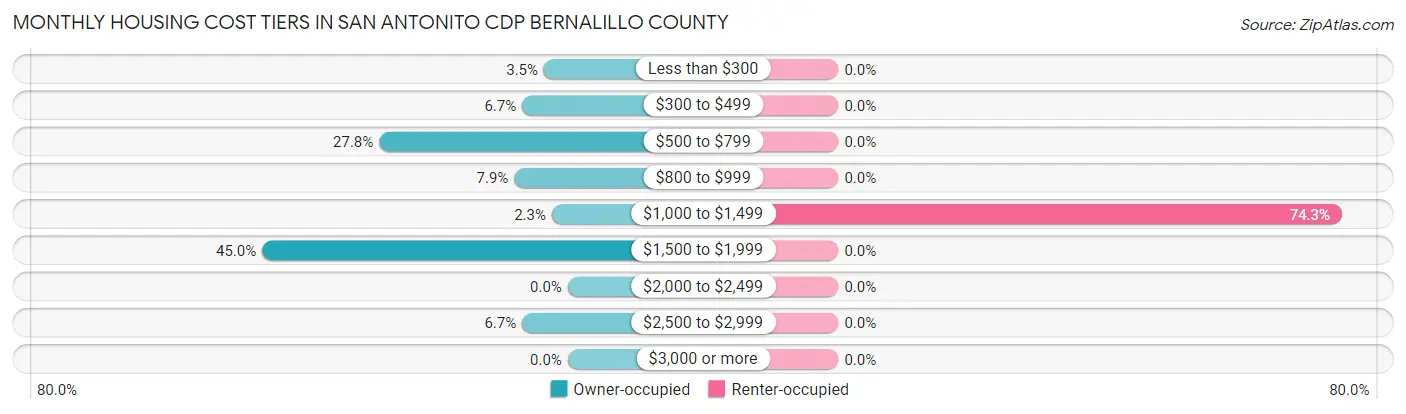
| Monthly Cost | Owner-occupied | Renter-occupied |
| Less than $300 | 12 (3.5%) | 0 (0.0%) |
| $300 to $499 | 23 (6.7%) | 0 (0.0%) |
| $500 to $799 | 95 (27.8%) | 0 (0.0%) |
| $800 to $999 | 27 (7.9%) | 0 (0.0%) |
| $1,000 to $1,499 | 8 (2.3%) | 26 (74.3%) |
| $1,500 to $1,999 | 154 (45.0%) | 0 (0.0%) |
| $2,000 to $2,499 | 0 (0.0%) | 0 (0.0%) |
| $2,500 to $2,999 | 23 (6.7%) | 0 (0.0%) |
| $3,000 or more | 0 (0.0%) | 0 (0.0%) |
| Total | 342 (100.0%) | 35 (100.0%) |
Physical Housing Characteristics in San Antonito CDP Bernalillo County
Housing Structures in San Antonito CDP Bernalillo County
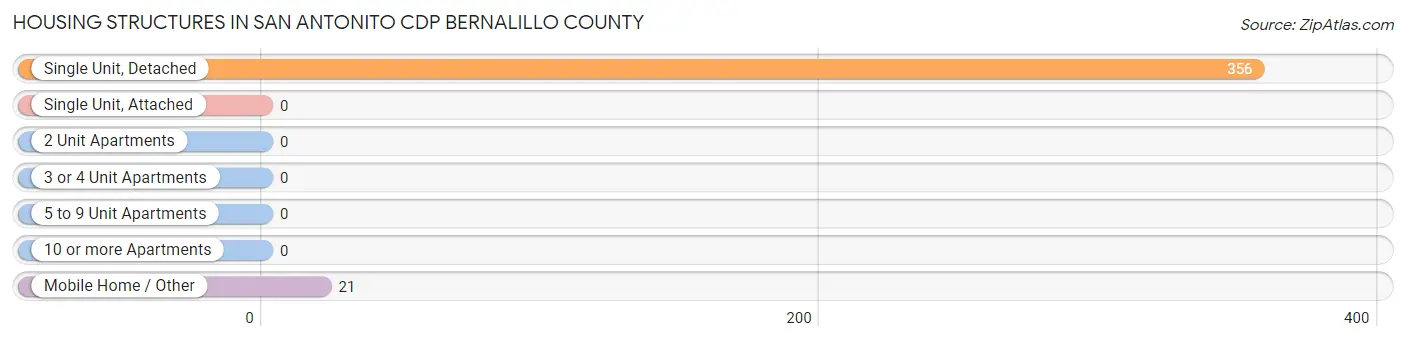
| Structure Type | # Housing Units | % Housing Units |
| Single Unit, Detached | 356 | 94.4% |
| Single Unit, Attached | 0 | 0.0% |
| 2 Unit Apartments | 0 | 0.0% |
| 3 or 4 Unit Apartments | 0 | 0.0% |
| 5 to 9 Unit Apartments | 0 | 0.0% |
| 10 or more Apartments | 0 | 0.0% |
| Mobile Home / Other | 21 | 5.6% |
| Total | 377 | 100.0% |
Housing Structures by Occupancy in San Antonito CDP Bernalillo County
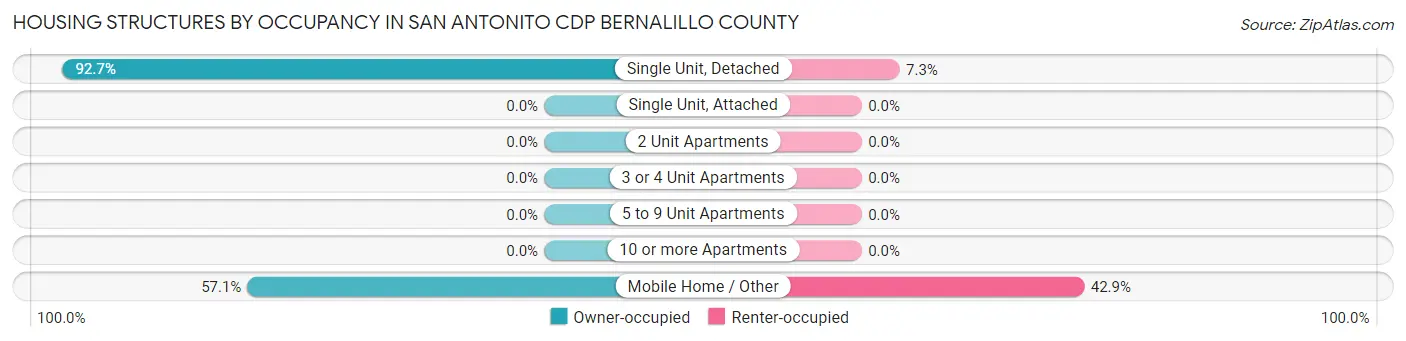
| Structure Type | Owner-occupied | Renter-occupied |
| Single Unit, Detached | 330 (92.7%) | 26 (7.3%) |
| Single Unit, Attached | 0 (0.0%) | 0 (0.0%) |
| 2 Unit Apartments | 0 (0.0%) | 0 (0.0%) |
| 3 or 4 Unit Apartments | 0 (0.0%) | 0 (0.0%) |
| 5 to 9 Unit Apartments | 0 (0.0%) | 0 (0.0%) |
| 10 or more Apartments | 0 (0.0%) | 0 (0.0%) |
| Mobile Home / Other | 12 (57.1%) | 9 (42.9%) |
| Total | 342 (90.7%) | 35 (9.3%) |
Housing Structures by Number of Rooms in San Antonito CDP Bernalillo County
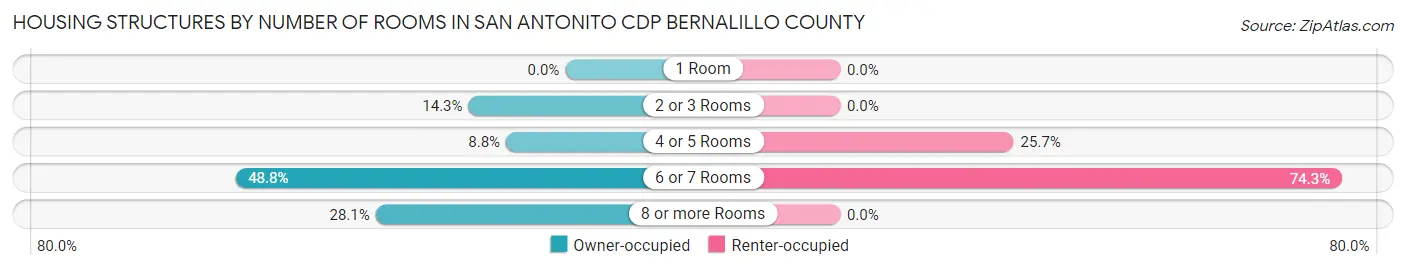
| Number of Rooms | Owner-occupied | Renter-occupied |
| 1 Room | 0 (0.0%) | 0 (0.0%) |
| 2 or 3 Rooms | 49 (14.3%) | 0 (0.0%) |
| 4 or 5 Rooms | 30 (8.8%) | 9 (25.7%) |
| 6 or 7 Rooms | 167 (48.8%) | 26 (74.3%) |
| 8 or more Rooms | 96 (28.1%) | 0 (0.0%) |
| Total | 342 (100.0%) | 35 (100.0%) |
Housing Structure by Heating Type in San Antonito CDP Bernalillo County
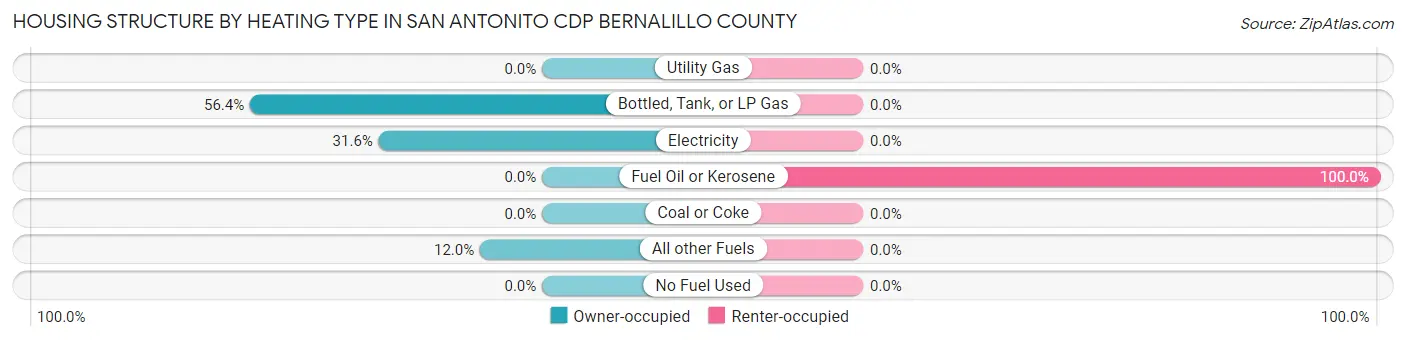
| Heating Type | Owner-occupied | Renter-occupied |
| Utility Gas | 0 (0.0%) | 0 (0.0%) |
| Bottled, Tank, or LP Gas | 193 (56.4%) | 0 (0.0%) |
| Electricity | 108 (31.6%) | 0 (0.0%) |
| Fuel Oil or Kerosene | 0 (0.0%) | 35 (100.0%) |
| Coal or Coke | 0 (0.0%) | 0 (0.0%) |
| All other Fuels | 41 (12.0%) | 0 (0.0%) |
| No Fuel Used | 0 (0.0%) | 0 (0.0%) |
| Total | 342 (100.0%) | 35 (100.0%) |
Household Vehicle Usage in San Antonito CDP Bernalillo County
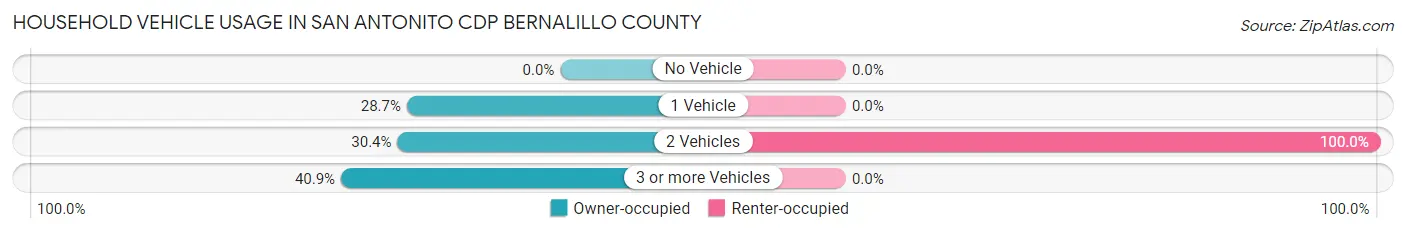
| Vehicles per Household | Owner-occupied | Renter-occupied |
| No Vehicle | 0 (0.0%) | 0 (0.0%) |
| 1 Vehicle | 98 (28.6%) | 0 (0.0%) |
| 2 Vehicles | 104 (30.4%) | 35 (100.0%) |
| 3 or more Vehicles | 140 (40.9%) | 0 (0.0%) |
| Total | 342 (100.0%) | 35 (100.0%) |
Real Estate & Mortgages in San Antonito CDP Bernalillo County
Real Estate and Mortgage Overview in San Antonito CDP Bernalillo County
| Characteristic | Without Mortgage | With Mortgage |
| Housing Units | 157 | 185 |
| Median Property Value | $350,000 | $298,000 |
| Median Household Income | $57,460 | $23 |
| Monthly Housing Costs | $674 | $0 |
| Real Estate Taxes | $1,950 | $0 |
Property Value by Mortgage Status in San Antonito CDP Bernalillo County
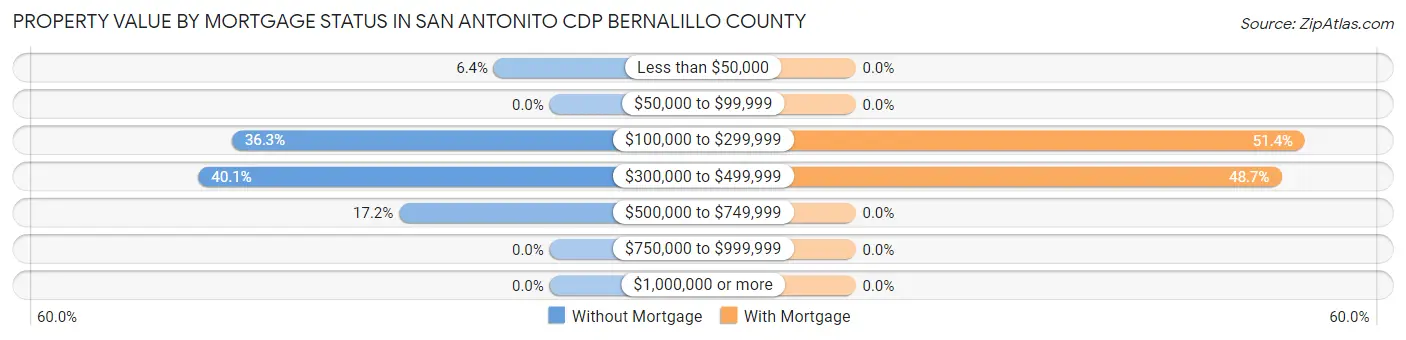
| Property Value | Without Mortgage | With Mortgage |
| Less than $50,000 | 10 (6.4%) | 0 (0.0%) |
| $50,000 to $99,999 | 0 (0.0%) | 0 (0.0%) |
| $100,000 to $299,999 | 57 (36.3%) | 95 (51.3%) |
| $300,000 to $499,999 | 63 (40.1%) | 90 (48.6%) |
| $500,000 to $749,999 | 27 (17.2%) | 0 (0.0%) |
| $750,000 to $999,999 | 0 (0.0%) | 0 (0.0%) |
| $1,000,000 or more | 0 (0.0%) | 0 (0.0%) |
| Total | 157 (100.0%) | 185 (100.0%) |
Household Income by Mortgage Status in San Antonito CDP Bernalillo County
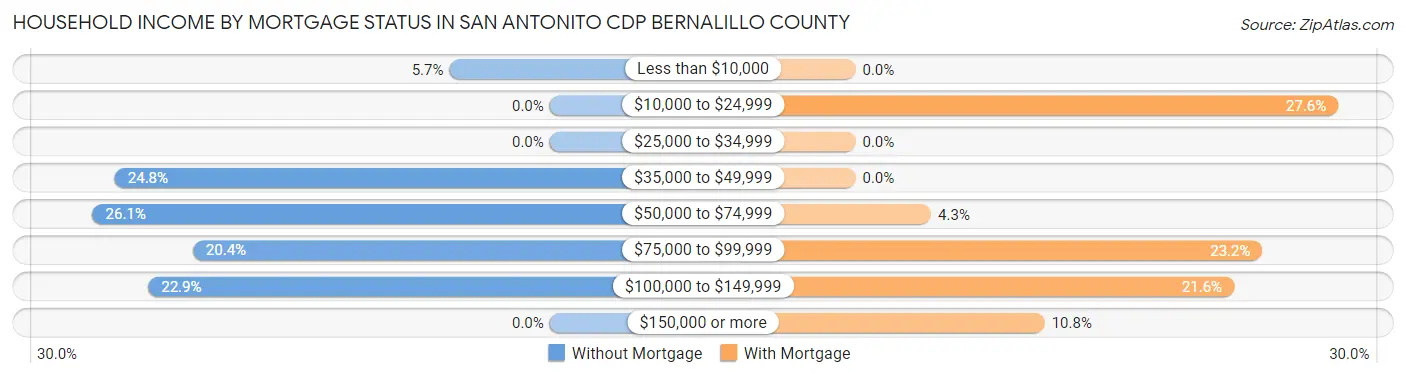
| Household Income | Without Mortgage | With Mortgage |
| Less than $10,000 | 9 (5.7%) | 0 (0.0%) |
| $10,000 to $24,999 | 0 (0.0%) | 51 (27.6%) |
| $25,000 to $34,999 | 0 (0.0%) | 0 (0.0%) |
| $35,000 to $49,999 | 39 (24.8%) | 0 (0.0%) |
| $50,000 to $74,999 | 41 (26.1%) | 8 (4.3%) |
| $75,000 to $99,999 | 32 (20.4%) | 43 (23.2%) |
| $100,000 to $149,999 | 36 (22.9%) | 40 (21.6%) |
| $150,000 or more | 0 (0.0%) | 20 (10.8%) |
| Total | 157 (100.0%) | 185 (100.0%) |
Property Value to Household Income Ratio in San Antonito CDP Bernalillo County
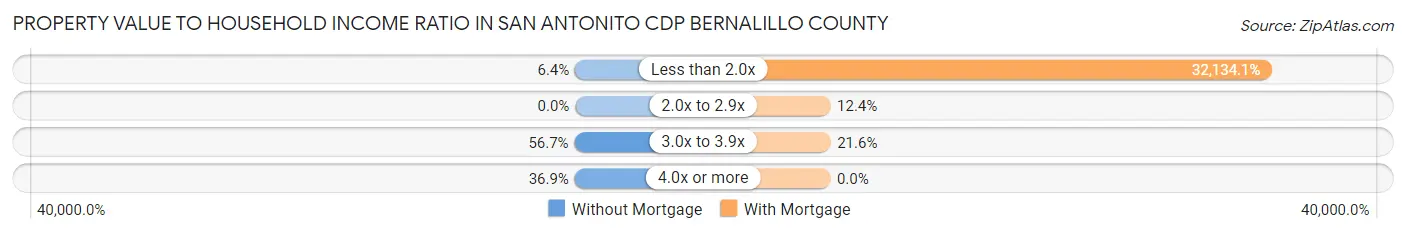
| Value-to-Income Ratio | Without Mortgage | With Mortgage |
| Less than 2.0x | 10 (6.4%) | 59,448 (32,134.1%) |
| 2.0x to 2.9x | 0 (0.0%) | 23 (12.4%) |
| 3.0x to 3.9x | 89 (56.7%) | 40 (21.6%) |
| 4.0x or more | 58 (36.9%) | 0 (0.0%) |
| Total | 157 (100.0%) | 185 (100.0%) |
Real Estate Taxes by Mortgage Status in San Antonito CDP Bernalillo County
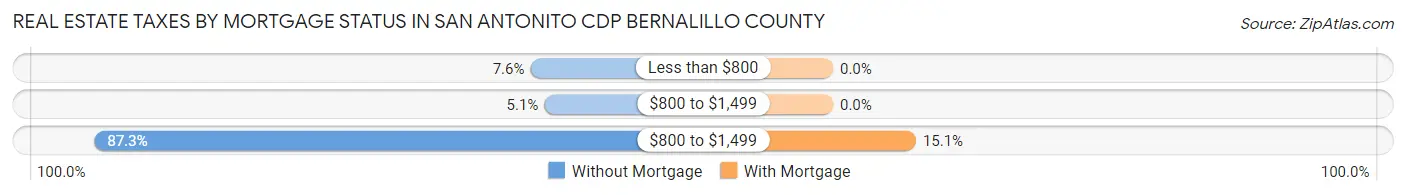
| Property Taxes | Without Mortgage | With Mortgage |
| Less than $800 | 12 (7.6%) | 0 (0.0%) |
| $800 to $1,499 | 8 (5.1%) | 0 (0.0%) |
| $800 to $1,499 | 137 (87.3%) | 28 (15.1%) |
| Total | 157 (100.0%) | 185 (100.0%) |
Health & Disability in San Antonito CDP Bernalillo County
Health Insurance Coverage by Age in San Antonito CDP Bernalillo County
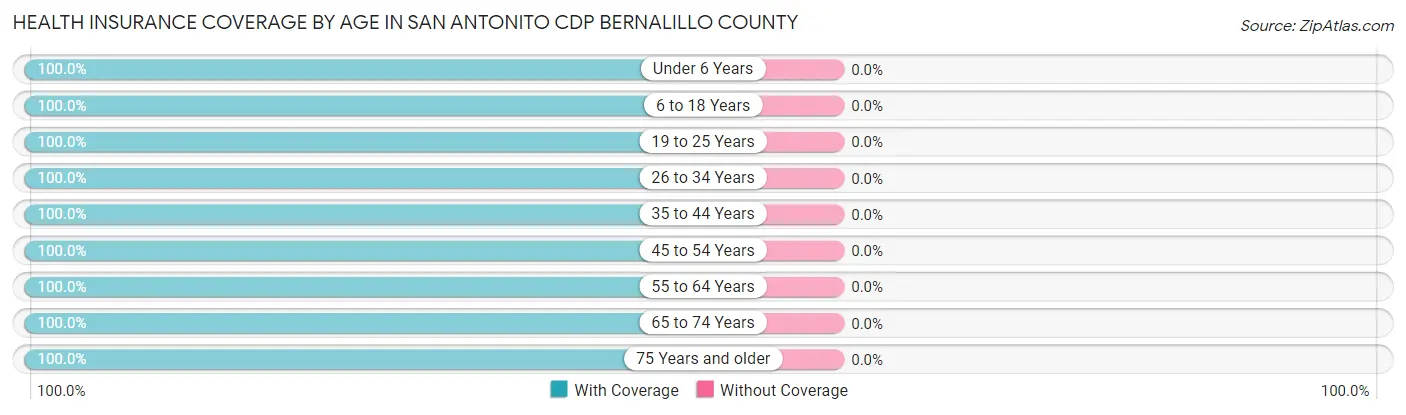
| Age Bracket | With Coverage | Without Coverage |
| Under 6 Years | 79 (100.0%) | 0 (0.0%) |
| 6 to 18 Years | 106 (100.0%) | 0 (0.0%) |
| 19 to 25 Years | 59 (100.0%) | 0 (0.0%) |
| 26 to 34 Years | 31 (100.0%) | 0 (0.0%) |
| 35 to 44 Years | 89 (100.0%) | 0 (0.0%) |
| 45 to 54 Years | 36 (100.0%) | 0 (0.0%) |
| 55 to 64 Years | 96 (100.0%) | 0 (0.0%) |
| 65 to 74 Years | 197 (100.0%) | 0 (0.0%) |
| 75 Years and older | 79 (100.0%) | 0 (0.0%) |
| Total | 772 (100.0%) | 0 (0.0%) |
Health Insurance Coverage by Citizenship Status in San Antonito CDP Bernalillo County
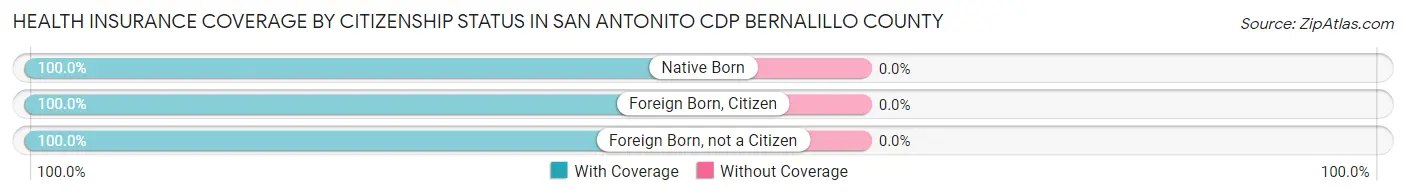
| Citizenship Status | With Coverage | Without Coverage |
| Native Born | 79 (100.0%) | 0 (0.0%) |
| Foreign Born, Citizen | 106 (100.0%) | 0 (0.0%) |
| Foreign Born, not a Citizen | 59 (100.0%) | 0 (0.0%) |
Health Insurance Coverage by Household Income in San Antonito CDP Bernalillo County
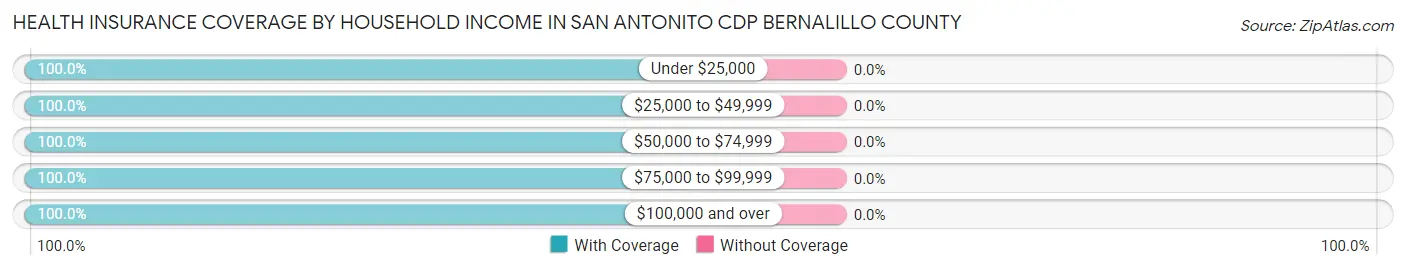
| Household Income | With Coverage | Without Coverage |
| Under $25,000 | 60 (100.0%) | 0 (0.0%) |
| $25,000 to $49,999 | 148 (100.0%) | 0 (0.0%) |
| $50,000 to $74,999 | 272 (100.0%) | 0 (0.0%) |
| $75,000 to $99,999 | 127 (100.0%) | 0 (0.0%) |
| $100,000 and over | 165 (100.0%) | 0 (0.0%) |
Public vs Private Health Insurance Coverage by Age in San Antonito CDP Bernalillo County
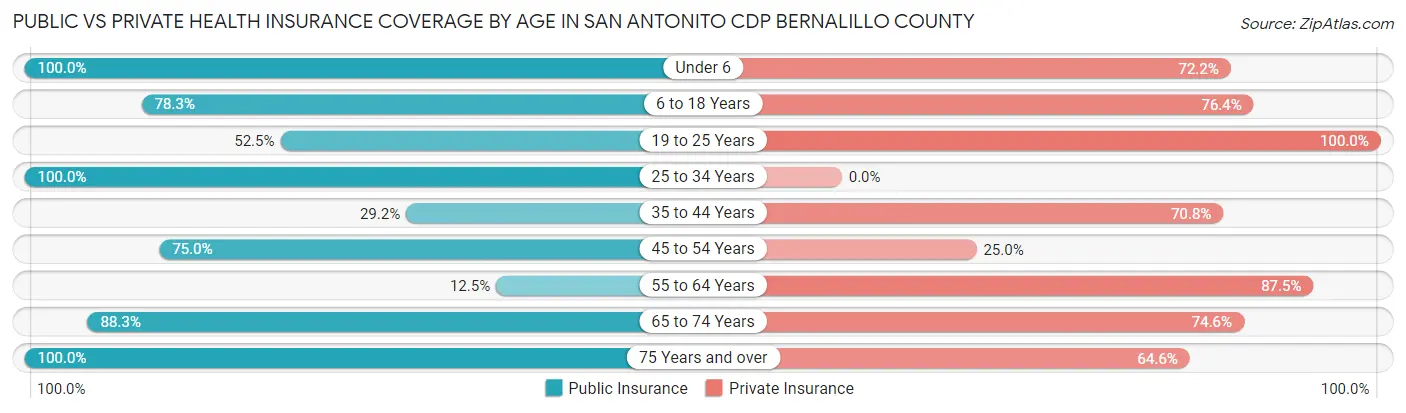
| Age Bracket | Public Insurance | Private Insurance |
| Under 6 | 79 (100.0%) | 57 (72.2%) |
| 6 to 18 Years | 83 (78.3%) | 81 (76.4%) |
| 19 to 25 Years | 31 (52.5%) | 59 (100.0%) |
| 25 to 34 Years | 31 (100.0%) | 0 (0.0%) |
| 35 to 44 Years | 26 (29.2%) | 63 (70.8%) |
| 45 to 54 Years | 27 (75.0%) | 9 (25.0%) |
| 55 to 64 Years | 12 (12.5%) | 84 (87.5%) |
| 65 to 74 Years | 174 (88.3%) | 147 (74.6%) |
| 75 Years and over | 79 (100.0%) | 51 (64.6%) |
| Total | 542 (70.2%) | 551 (71.4%) |
Disability Status by Sex by Age in San Antonito CDP Bernalillo County
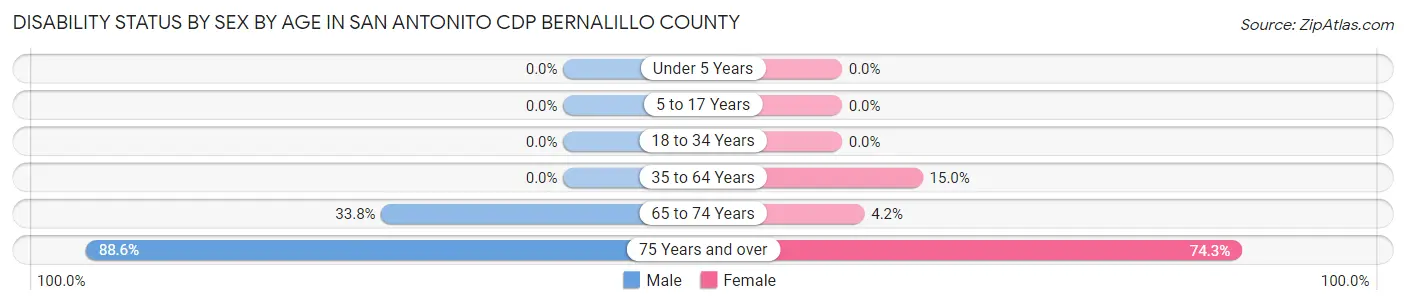
| Age Bracket | Male | Female |
| Under 5 Years | 0 (0.0%) | 0 (0.0%) |
| 5 to 17 Years | 0 (0.0%) | 0 (0.0%) |
| 18 to 34 Years | 0 (0.0%) | 0 (0.0%) |
| 35 to 64 Years | 0 (0.0%) | 12 (15.0%) |
| 65 to 74 Years | 26 (33.8%) | 5 (4.2%) |
| 75 Years and over | 39 (88.6%) | 26 (74.3%) |
Disability Class by Sex by Age in San Antonito CDP Bernalillo County
Disability Class: Hearing Difficulty
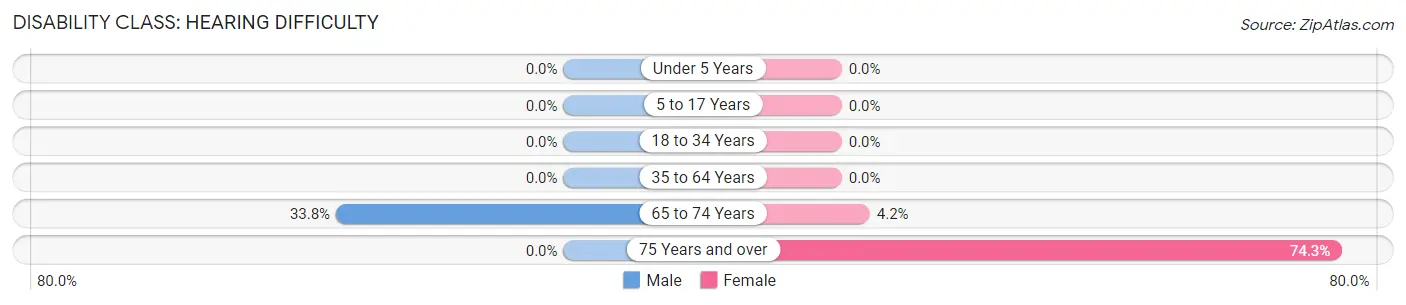
| Age Bracket | Male | Female |
| Under 5 Years | 0 (0.0%) | 0 (0.0%) |
| 5 to 17 Years | 0 (0.0%) | 0 (0.0%) |
| 18 to 34 Years | 0 (0.0%) | 0 (0.0%) |
| 35 to 64 Years | 0 (0.0%) | 0 (0.0%) |
| 65 to 74 Years | 26 (33.8%) | 5 (4.2%) |
| 75 Years and over | 0 (0.0%) | 26 (74.3%) |
Disability Class: Vision Difficulty
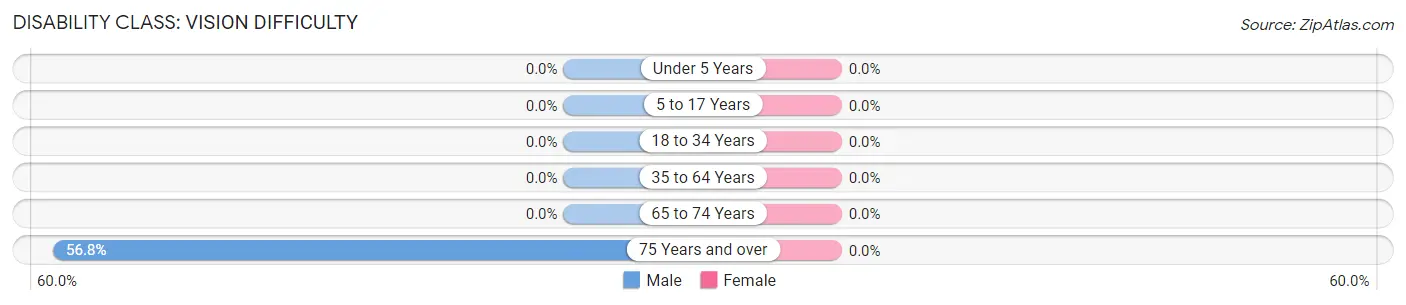
| Age Bracket | Male | Female |
| Under 5 Years | 0 (0.0%) | 0 (0.0%) |
| 5 to 17 Years | 0 (0.0%) | 0 (0.0%) |
| 18 to 34 Years | 0 (0.0%) | 0 (0.0%) |
| 35 to 64 Years | 0 (0.0%) | 0 (0.0%) |
| 65 to 74 Years | 0 (0.0%) | 0 (0.0%) |
| 75 Years and over | 25 (56.8%) | 0 (0.0%) |
Disability Class: Cognitive Difficulty
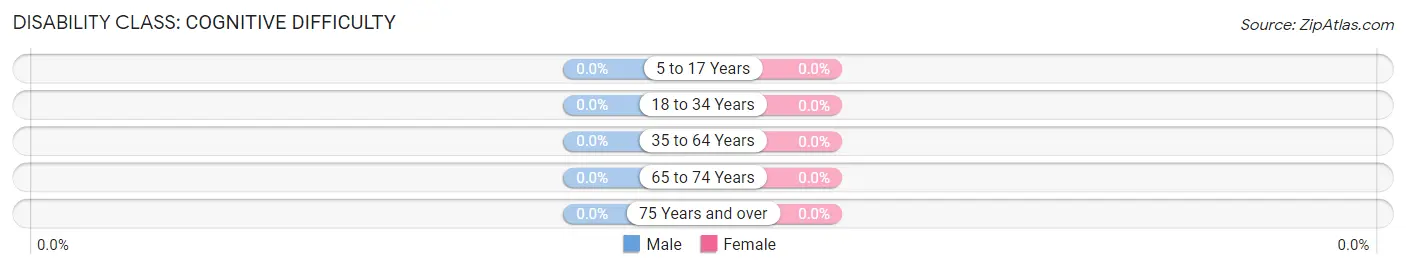
| Age Bracket | Male | Female |
| 5 to 17 Years | 0 (0.0%) | 0 (0.0%) |
| 18 to 34 Years | 0 (0.0%) | 0 (0.0%) |
| 35 to 64 Years | 0 (0.0%) | 0 (0.0%) |
| 65 to 74 Years | 0 (0.0%) | 0 (0.0%) |
| 75 Years and over | 0 (0.0%) | 0 (0.0%) |
Disability Class: Ambulatory Difficulty
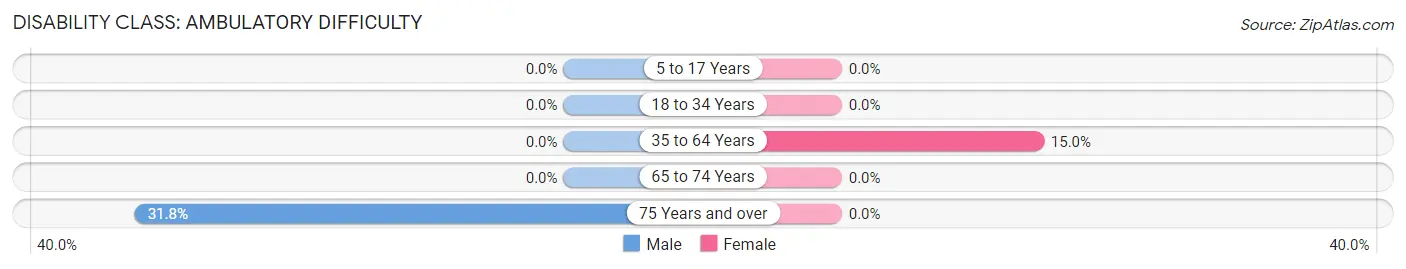
| Age Bracket | Male | Female |
| 5 to 17 Years | 0 (0.0%) | 0 (0.0%) |
| 18 to 34 Years | 0 (0.0%) | 0 (0.0%) |
| 35 to 64 Years | 0 (0.0%) | 12 (15.0%) |
| 65 to 74 Years | 0 (0.0%) | 0 (0.0%) |
| 75 Years and over | 14 (31.8%) | 0 (0.0%) |
Disability Class: Self-Care Difficulty
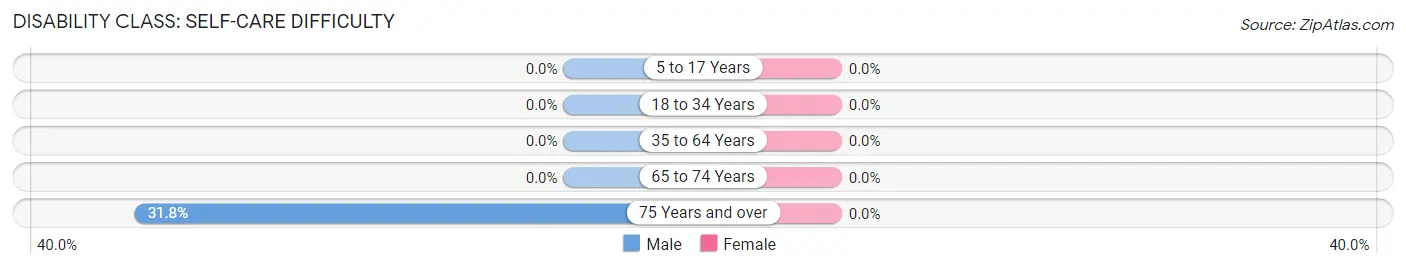
| Age Bracket | Male | Female |
| 5 to 17 Years | 0 (0.0%) | 0 (0.0%) |
| 18 to 34 Years | 0 (0.0%) | 0 (0.0%) |
| 35 to 64 Years | 0 (0.0%) | 0 (0.0%) |
| 65 to 74 Years | 0 (0.0%) | 0 (0.0%) |
| 75 Years and over | 14 (31.8%) | 0 (0.0%) |
Technology Access in San Antonito CDP Bernalillo County
Computing Device Access in San Antonito CDP Bernalillo County
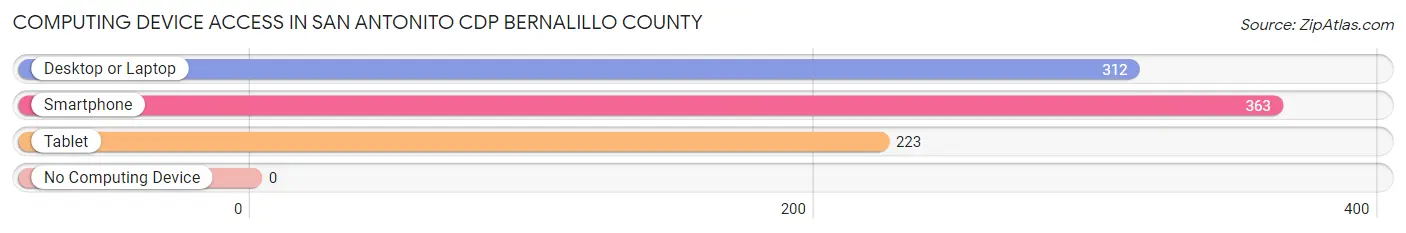
| Device Type | # Households | % Households |
| Desktop or Laptop | 312 | 82.8% |
| Smartphone | 363 | 96.3% |
| Tablet | 223 | 59.2% |
| No Computing Device | 0 | 0.0% |
| Total | 377 | 100.0% |
Internet Access in San Antonito CDP Bernalillo County
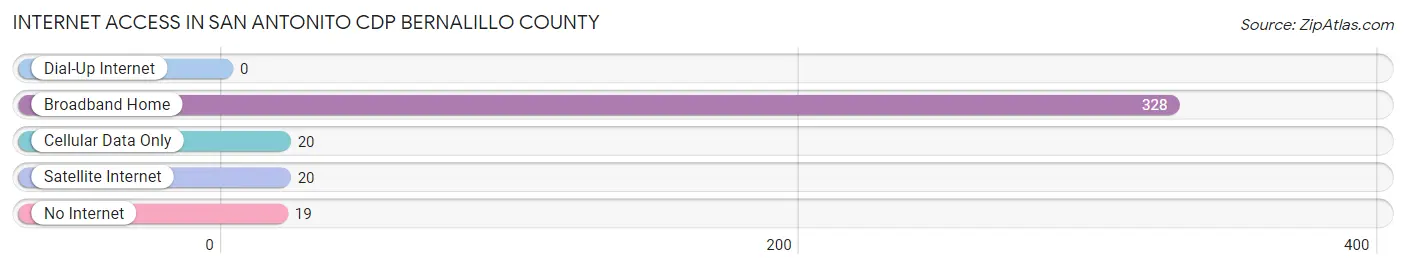
| Internet Type | # Households | % Households |
| Dial-Up Internet | 0 | 0.0% |
| Broadband Home | 328 | 87.0% |
| Cellular Data Only | 20 | 5.3% |
| Satellite Internet | 20 | 5.3% |
| No Internet | 19 | 5.0% |
| Total | 377 | 100.0% |
San Antonito CDP Bernalillo County Summary
San Antonito CDP is a census-designated place (CDP) located in Bernalillo County, New Mexico. It is situated in the northern part of the county, about 10 miles north of Albuquerque. As of the 2010 census, the population of San Antonito was 1,845.
History
San Antonito was originally inhabited by the Pueblo Indians, who lived in the area for centuries before the arrival of the Spanish in the 16th century. The Spanish established a mission in the area in 1706, and the area was later settled by Mexican and American settlers. The area was known as San Antonio de los Padillas until the early 20th century, when it was renamed San Antonito.
Geography
San Antonito is located at 35°14'25"N 106°37'17"W (35.240278, -106.621389). It is situated in the northern part of Bernalillo County, about 10 miles north of Albuquerque. The CDP has a total area of 2.2 square miles, all of which is land.
Demographics
As of the 2010 census, there were 1,845 people, 645 households, and 486 families residing in the CDP. The population density was 837.5 people per square mile. There were 690 housing units, of which 63.2% were owner-occupied and 36.8% were renter-occupied. The racial makeup of the CDP was 73.2% White, 0.9% African American, 1.2% Native American, 0.7% Asian, 0.1% Pacific Islander, 20.2% from other races, and 3.7% from two or more races. Hispanic or Latino of any race were 63.2% of the population.
Economy
The economy of San Antonito is largely based on agriculture and tourism. The area is home to several farms and ranches, as well as several tourist attractions, including the San Antonio de los Padillas Mission and the San Antonio de los Padillas Cemetery. The area is also home to several small businesses, including restaurants, convenience stores, and gas stations.
Conclusion
San Antonito CDP is a census-designated place located in Bernalillo County, New Mexico. It is situated in the northern part of the county, about 10 miles north of Albuquerque. As of the 2010 census, the population of San Antonito was 1,845. The area was originally inhabited by the Pueblo Indians, and was later settled by Mexican and American settlers. The economy of San Antonito is largely based on agriculture and tourism. The area is home to several farms and ranches, as well as several tourist attractions.
Common Questions
What is Per Capita Income in San Antonito CDP Bernalillo County?
Per Capita income in San Antonito CDP Bernalillo County is $37,614.
What is the Median Family Income in San Antonito CDP Bernalillo County?
Median Family Income in San Antonito CDP Bernalillo County is $77,813.
What is the Median Household income in San Antonito CDP Bernalillo County?
Median Household Income in San Antonito CDP Bernalillo County is $58,924.
What is Inequality or Gini Index in San Antonito CDP Bernalillo County?
Inequality or Gini Index in San Antonito CDP Bernalillo County is 0.42.
What is the Total Population of San Antonito CDP Bernalillo County?
Total Population of San Antonito CDP Bernalillo County is 772.
What is the Total Male Population of San Antonito CDP Bernalillo County?
Total Male Population of San Antonito CDP Bernalillo County is 344.
What is the Total Female Population of San Antonito CDP Bernalillo County?
Total Female Population of San Antonito CDP Bernalillo County is 428.
What is the Ratio of Males per 100 Females in San Antonito CDP Bernalillo County?
There are 80.37 Males per 100 Females in San Antonito CDP Bernalillo County.
What is the Ratio of Females per 100 Males in San Antonito CDP Bernalillo County?
There are 124.42 Females per 100 Males in San Antonito CDP Bernalillo County.
What is the Median Population Age in San Antonito CDP Bernalillo County?
Median Population Age in San Antonito CDP Bernalillo County is 52.6 Years.
What is the Average Family Size in San Antonito CDP Bernalillo County
Average Family Size in San Antonito CDP Bernalillo County is 2.8 People.
What is the Average Household Size in San Antonito CDP Bernalillo County
Average Household Size in San Antonito CDP Bernalillo County is 2.0 People.
How Large is the Labor Force in San Antonito CDP Bernalillo County?
There are 328 People in the Labor Forcein in San Antonito CDP Bernalillo County.
What is the Percentage of People in the Labor Force in San Antonito CDP Bernalillo County?
55.9% of People are in the Labor Force in San Antonito CDP Bernalillo County.
What is the Unemployment Rate in San Antonito CDP Bernalillo County?
Unemployment Rate in San Antonito CDP Bernalillo County is 6.1%.