West Hammond, NM Map & Demographics
West Hammond Map
West Hammond Overview
$26,305
PER CAPITA INCOME
$59,881
AVG FAMILY INCOME
$61,250
AVG HOUSEHOLD INCOME
7.0%
WAGE / INCOME GAP [ % ]
93.0¢/ $1
WAGE / INCOME GAP [ $ ]
0.41
INEQUALITY / GINI INDEX
2,410
TOTAL POPULATION
1,287
MALE POPULATION
1,123
FEMALE POPULATION
114.60
MALES / 100 FEMALES
87.26
FEMALES / 100 MALES
39.6
MEDIAN AGE
3.3
AVG FAMILY SIZE
3.0
AVG HOUSEHOLD SIZE
981
LABOR FORCE [ PEOPLE ]
51.8%
PERCENT IN LABOR FORCE
8.6%
UNEMPLOYMENT RATE
Income in West Hammond
Income Overview in West Hammond
Per Capita Income in West Hammond is $26,305, while median incomes of families and households are $59,881 and $61,250 respectively.
| Characteristic | Number | Measure |
| Per Capita Income | 2,410 | $26,305 |
| Median Family Income | 612 | $59,881 |
| Mean Family Income | 612 | $79,897 |
| Median Household Income | 793 | $61,250 |
| Mean Household Income | 793 | $76,556 |
| Income Deficit | 612 | $0 |
| Wage / Income Gap (%) | 2,410 | 7.02% |
| Wage / Income Gap ($) | 2,410 | 92.98¢ per $1 |
| Gini / Inequality Index | 2,410 | 0.41 |
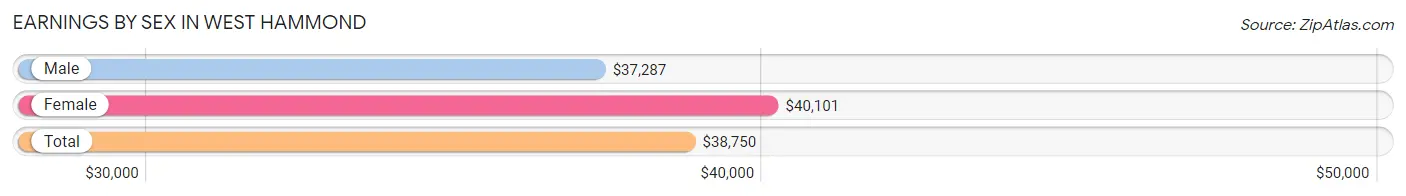
Earnings by Sex in West Hammond
Average Earnings in West Hammond are $38,750, $37,287 for men and $40,101 for women, a difference of 7.0%.
| Sex | Number | Average Earnings |
| Male | 585 (57.0%) | $37,287 |
| Female | 441 (43.0%) | $40,101 |
| Total | 1,026 (100.0%) | $38,750 |
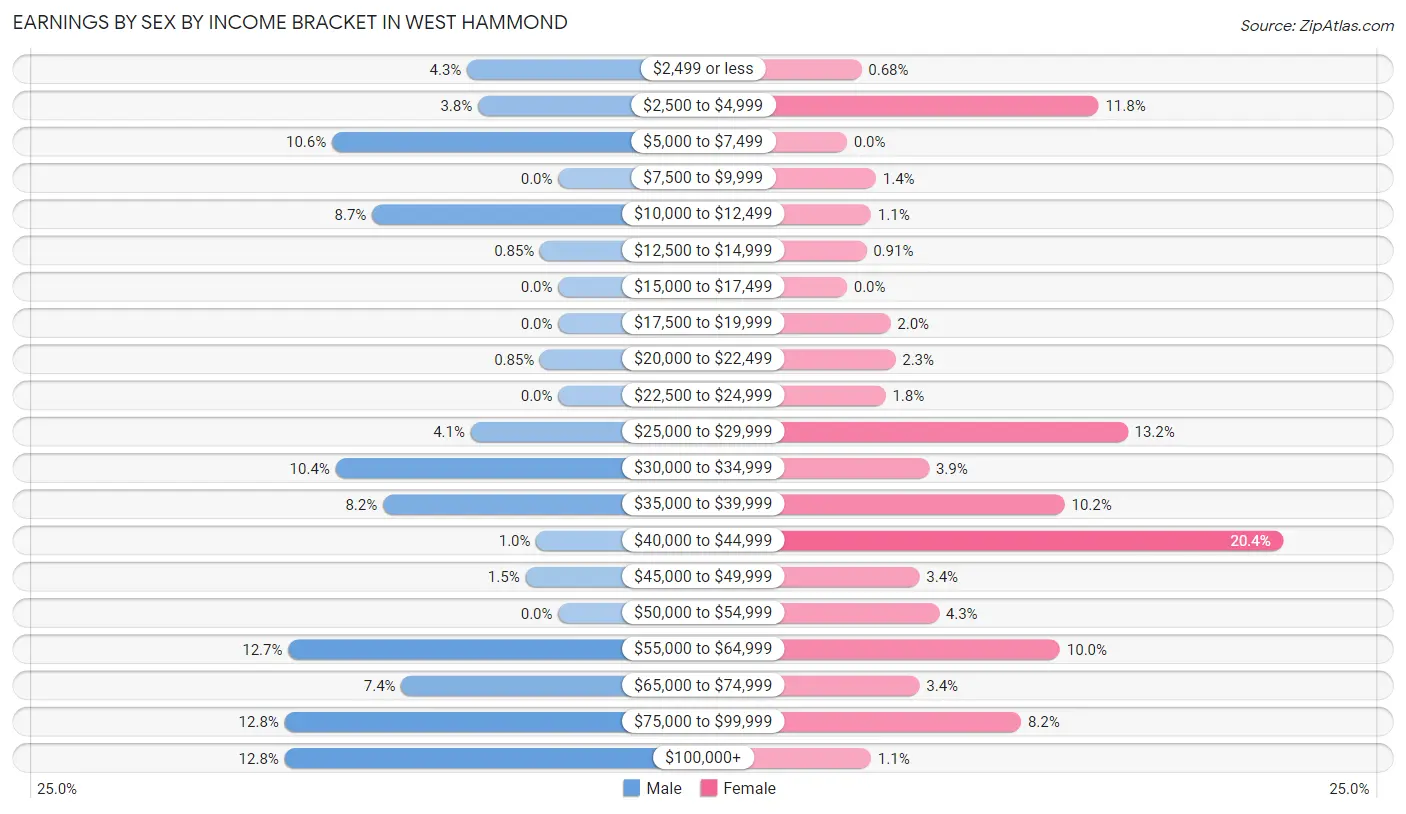
Earnings by Sex by Income Bracket in West Hammond
The most common earnings brackets in West Hammond are $75,000 to $99,999 for men (75 | 12.8%) and $40,000 to $44,999 for women (90 | 20.4%).
| Income | Male | Female |
| $2,499 or less | 25 (4.3%) | 3 (0.7%) |
| $2,500 to $4,999 | 22 (3.8%) | 52 (11.8%) |
| $5,000 to $7,499 | 62 (10.6%) | 0 (0.0%) |
| $7,500 to $9,999 | 0 (0.0%) | 6 (1.4%) |
| $10,000 to $12,499 | 51 (8.7%) | 5 (1.1%) |
| $12,500 to $14,999 | 5 (0.9%) | 4 (0.9%) |
| $15,000 to $17,499 | 0 (0.0%) | 0 (0.0%) |
| $17,500 to $19,999 | 0 (0.0%) | 9 (2.0%) |
| $20,000 to $22,499 | 5 (0.9%) | 10 (2.3%) |
| $22,500 to $24,999 | 0 (0.0%) | 8 (1.8%) |
| $25,000 to $29,999 | 24 (4.1%) | 58 (13.2%) |
| $30,000 to $34,999 | 61 (10.4%) | 17 (3.8%) |
| $35,000 to $39,999 | 48 (8.2%) | 45 (10.2%) |
| $40,000 to $44,999 | 6 (1.0%) | 90 (20.4%) |
| $45,000 to $49,999 | 9 (1.5%) | 15 (3.4%) |
| $50,000 to $54,999 | 0 (0.0%) | 19 (4.3%) |
| $55,000 to $64,999 | 74 (12.7%) | 44 (10.0%) |
| $65,000 to $74,999 | 43 (7.3%) | 15 (3.4%) |
| $75,000 to $99,999 | 75 (12.8%) | 36 (8.2%) |
| $100,000+ | 75 (12.8%) | 5 (1.1%) |
| Total | 585 (100.0%) | 441 (100.0%) |
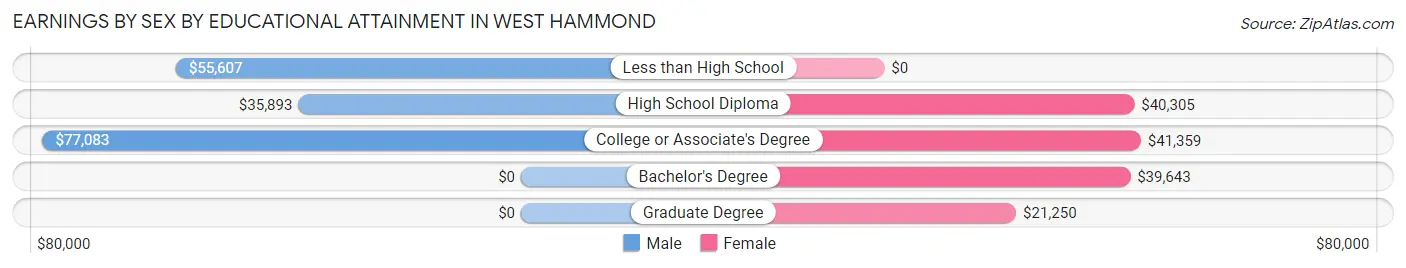
Earnings by Sex by Educational Attainment in West Hammond
Average earnings in West Hammond are $55,929 for men and $40,618 for women, a difference of 27.4%. Men with an educational attainment of college or associate's degree enjoy the highest average annual earnings of $77,083, while those with high school diploma education earn the least with $35,893. Women with an educational attainment of college or associate's degree earn the most with the average annual earnings of $41,359, while those with graduate degree education have the smallest earnings of $21,250.
| Educational Attainment | Male Income | Female Income |
| Less than High School | $55,607 | $0 |
| High School Diploma | $35,893 | $40,305 |
| College or Associate's Degree | $77,083 | $41,359 |
| Bachelor's Degree | - | - |
| Graduate Degree | - | - |
| Total | $55,929 | $40,618 |
Family Income in West Hammond
Family Income Brackets in West Hammond
According to the West Hammond family income data, there are 138 families falling into the $35,000 to $49,999 income range, which is the most common income bracket and makes up 22.6% of all families. Conversely, the $15,000 to $24,999 income bracket is the least frequent group with only 12 families (2.0%) belonging to this category.
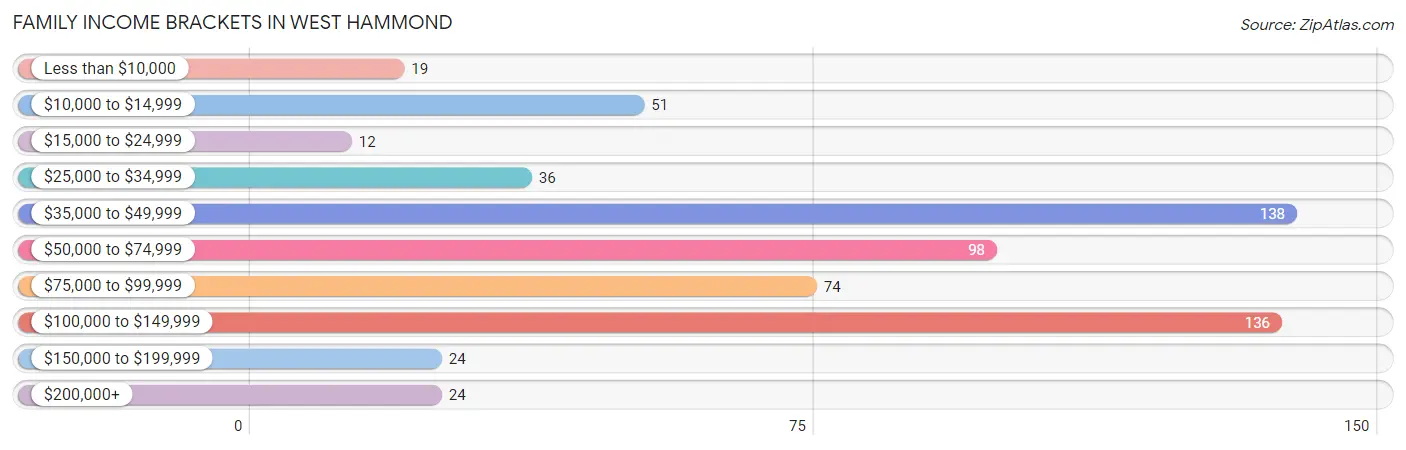
| Income Bracket | # Families | % Families |
| Less than $10,000 | 19 | 3.1% |
| $10,000 to $14,999 | 51 | 8.3% |
| $15,000 to $24,999 | 12 | 2.0% |
| $25,000 to $34,999 | 36 | 5.9% |
| $35,000 to $49,999 | 138 | 22.5% |
| $50,000 to $74,999 | 98 | 16.0% |
| $75,000 to $99,999 | 74 | 12.1% |
| $100,000 to $149,999 | 136 | 22.2% |
| $150,000 to $199,999 | 24 | 3.9% |
| $200,000+ | 24 | 3.9% |
Family Income by Famaliy Size in West Hammond
3-person families (204 | 33.3%) account for the highest median family income in West Hammond with $98,017 per family, while 3-person families (204 | 33.3%) have the highest median income of $32,672 per family member.
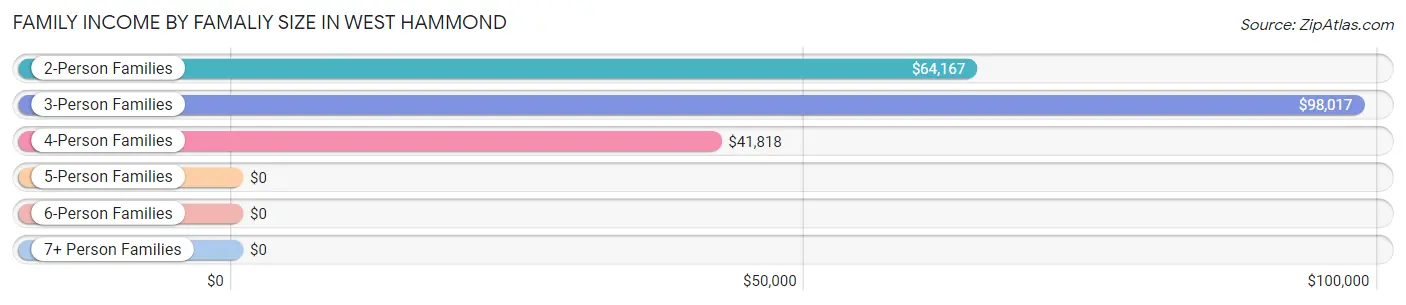
| Income Bracket | # Families | Median Income |
| 2-Person Families | 242 (39.5%) | $64,167 |
| 3-Person Families | 204 (33.3%) | $98,017 |
| 4-Person Families | 124 (20.3%) | $41,818 |
| 5-Person Families | 29 (4.7%) | $0 |
| 6-Person Families | 6 (1.0%) | $0 |
| 7+ Person Families | 7 (1.1%) | $0 |
| Total | 612 (100.0%) | $59,881 |
Family Income by Number of Earners in West Hammond
The median family income in West Hammond is $59,881, with families comprising 3+ earners (28) having the highest median family income of $250,001, while families with 1 earner (308) have the lowest median family income of $40,227, accounting for 4.6% and 50.3% of families, respectively.
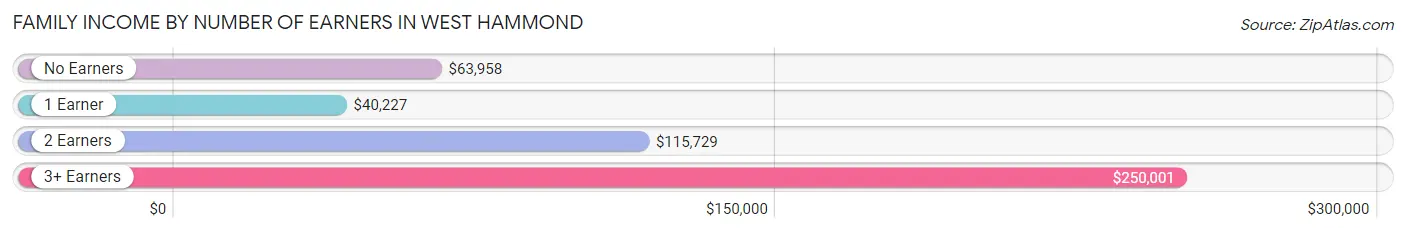
| Number of Earners | # Families | Median Income |
| No Earners | 87 (14.2%) | $63,958 |
| 1 Earner | 308 (50.3%) | $40,227 |
| 2 Earners | 189 (30.9%) | $115,729 |
| 3+ Earners | 28 (4.6%) | $250,001 |
| Total | 612 (100.0%) | $59,881 |
Household Income in West Hammond
Household Income Brackets in West Hammond
With 172 households falling in the category, the $100,000 to $149,999 income range is the most frequent in West Hammond, accounting for 21.7% of all households. In contrast, only 19 households (2.4%) fall into the $150,000 to $199,999 income bracket, making it the least populous group.
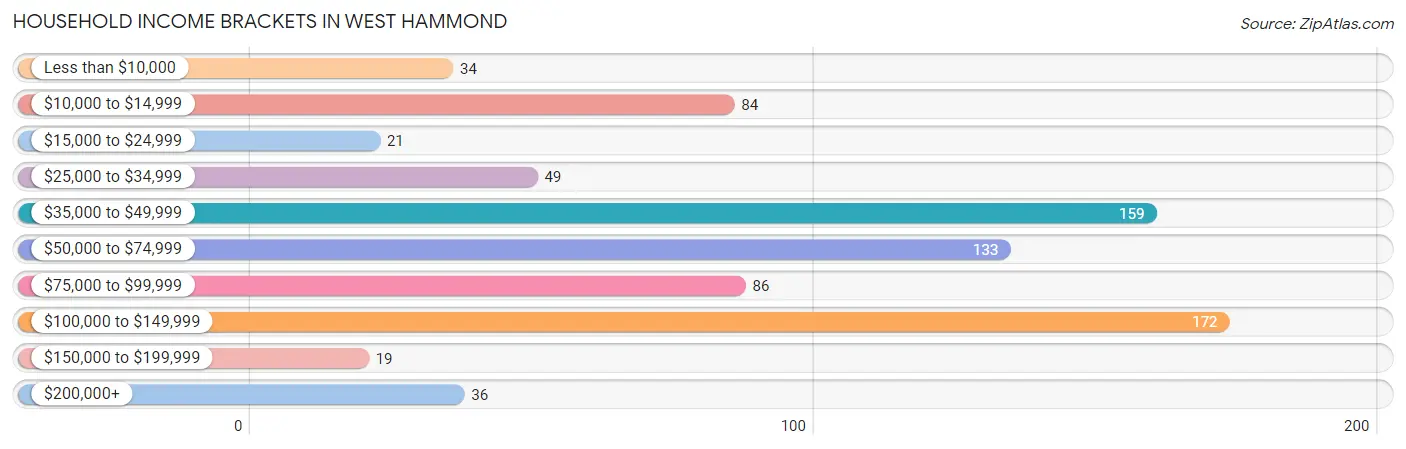
| Income Bracket | # Households | % Households |
| Less than $10,000 | 34 | 4.3% |
| $10,000 to $14,999 | 84 | 10.6% |
| $15,000 to $24,999 | 21 | 2.6% |
| $25,000 to $34,999 | 49 | 6.2% |
| $35,000 to $49,999 | 159 | 20.1% |
| $50,000 to $74,999 | 133 | 16.8% |
| $75,000 to $99,999 | 86 | 10.8% |
| $100,000 to $149,999 | 172 | 21.7% |
| $150,000 to $199,999 | 19 | 2.4% |
| $200,000+ | 36 | 4.5% |
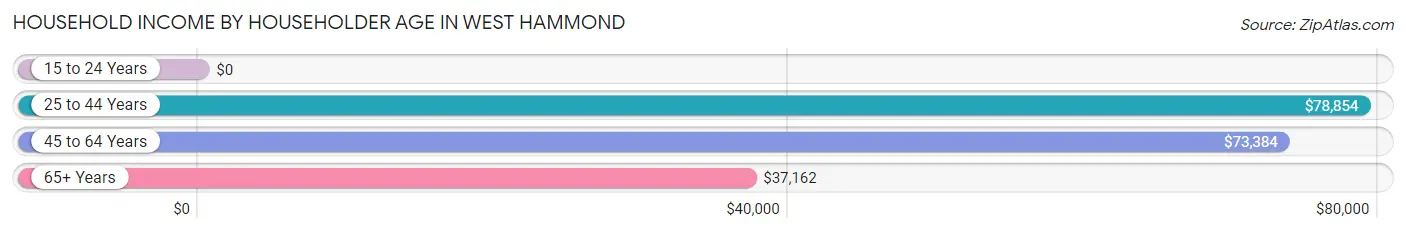
Household Income by Householder Age in West Hammond
The median household income in West Hammond is $61,250, with the highest median household income of $78,854 found in the 25 to 44 years age bracket for the primary householder. A total of 260 households (32.8%) fall into this category. Meanwhile, the 15 to 24 years age bracket for the primary householder has the lowest median household income of $0, with 6 households (0.8%) in this group.
| Income Bracket | # Households | Median Income |
| 15 to 24 Years | 6 (0.8%) | $0 |
| 25 to 44 Years | 260 (32.8%) | $78,854 |
| 45 to 64 Years | 305 (38.5%) | $73,384 |
| 65+ Years | 222 (28.0%) | $37,162 |
| Total | 793 (100.0%) | $61,250 |
Poverty in West Hammond
Income Below Poverty by Sex and Age in West Hammond
With 14.1% poverty level for males and 6.7% for females among the residents of West Hammond, 18 to 24 year old males and 16 and 17 year old females are the most vulnerable to poverty, with 51 males (60.7%) and 16 females (34.0%) in their respective age groups living below the poverty level.
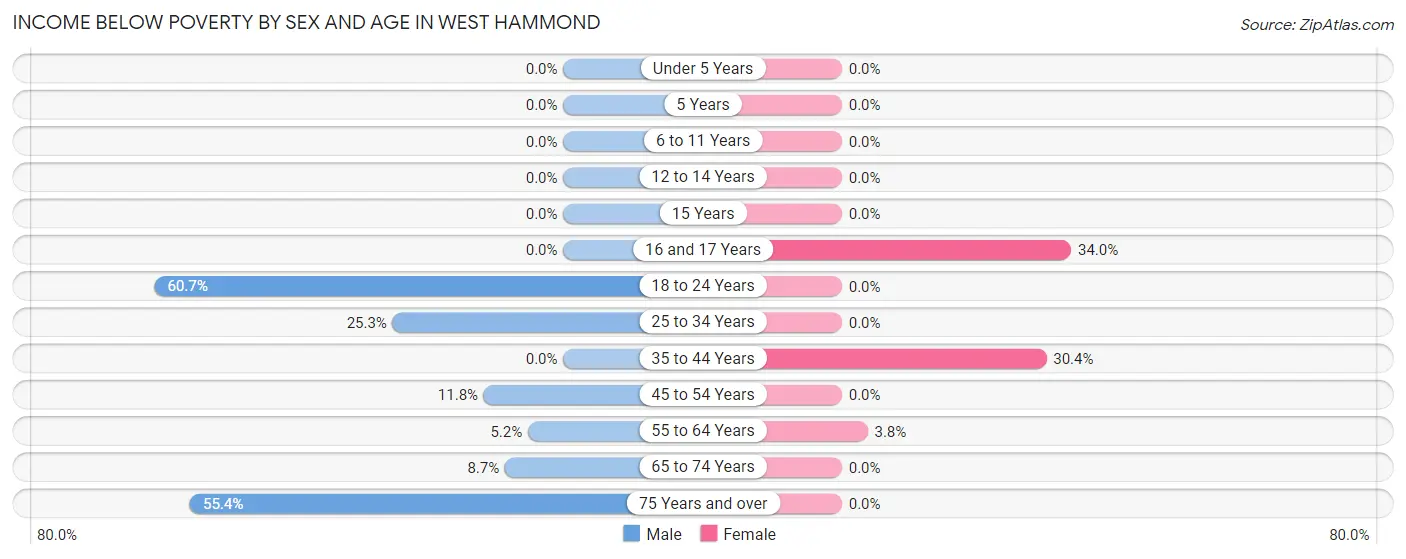
| Age Bracket | Male | Female |
| Under 5 Years | 0 (0.0%) | 0 (0.0%) |
| 5 Years | 0 (0.0%) | 0 (0.0%) |
| 6 to 11 Years | 0 (0.0%) | 0 (0.0%) |
| 12 to 14 Years | 0 (0.0%) | 0 (0.0%) |
| 15 Years | 0 (0.0%) | 0 (0.0%) |
| 16 and 17 Years | 0 (0.0%) | 16 (34.0%) |
| 18 to 24 Years | 51 (60.7%) | 0 (0.0%) |
| 25 to 34 Years | 37 (25.3%) | 0 (0.0%) |
| 35 to 44 Years | 0 (0.0%) | 51 (30.4%) |
| 45 to 54 Years | 19 (11.8%) | 0 (0.0%) |
| 55 to 64 Years | 10 (5.2%) | 5 (3.8%) |
| 65 to 74 Years | 11 (8.7%) | 0 (0.0%) |
| 75 Years and over | 51 (55.4%) | 0 (0.0%) |
| Total | 179 (14.1%) | 72 (6.7%) |
Income Above Poverty by Sex and Age in West Hammond
According to the poverty statistics in West Hammond, males aged under 5 years and females aged under 5 years are the age groups that are most secure financially, with 100.0% of males and 100.0% of females in these age groups living above the poverty line.
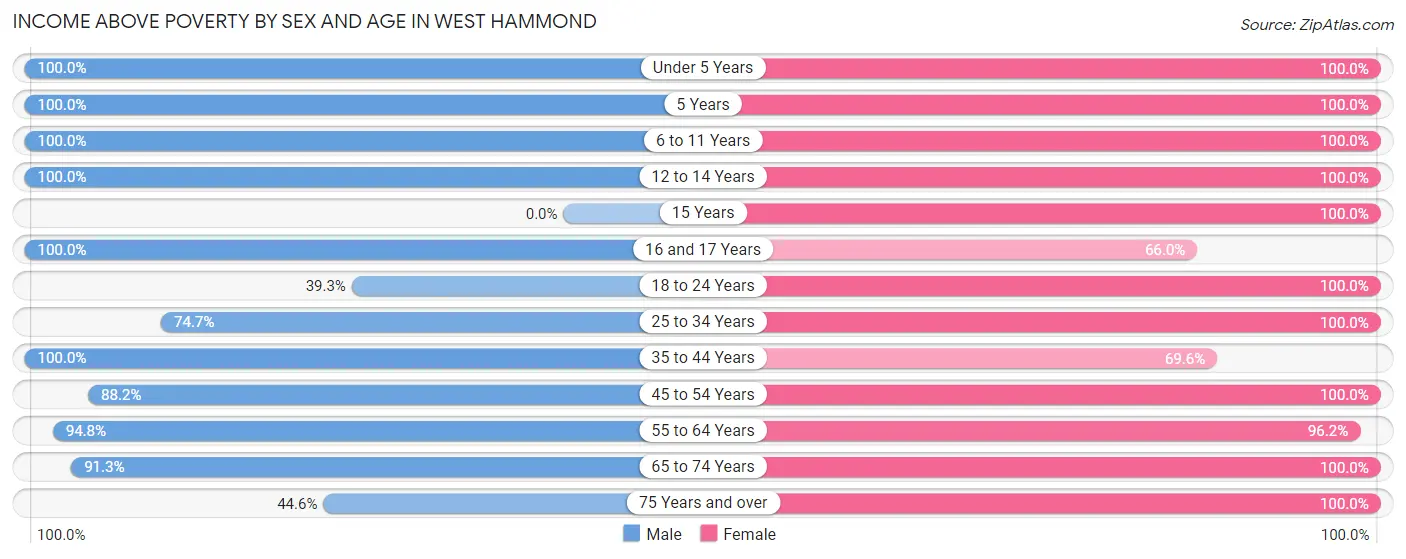
| Age Bracket | Male | Female |
| Under 5 Years | 108 (100.0%) | 15 (100.0%) |
| 5 Years | 23 (100.0%) | 16 (100.0%) |
| 6 to 11 Years | 53 (100.0%) | 29 (100.0%) |
| 12 to 14 Years | 86 (100.0%) | 68 (100.0%) |
| 15 Years | 0 (0.0%) | 59 (100.0%) |
| 16 and 17 Years | 60 (100.0%) | 31 (66.0%) |
| 18 to 24 Years | 33 (39.3%) | 125 (100.0%) |
| 25 to 34 Years | 109 (74.7%) | 124 (100.0%) |
| 35 to 44 Years | 136 (100.0%) | 117 (69.6%) |
| 45 to 54 Years | 142 (88.2%) | 73 (100.0%) |
| 55 to 64 Years | 181 (94.8%) | 126 (96.2%) |
| 65 to 74 Years | 116 (91.3%) | 144 (100.0%) |
| 75 Years and over | 41 (44.6%) | 84 (100.0%) |
| Total | 1,088 (85.9%) | 1,011 (93.3%) |
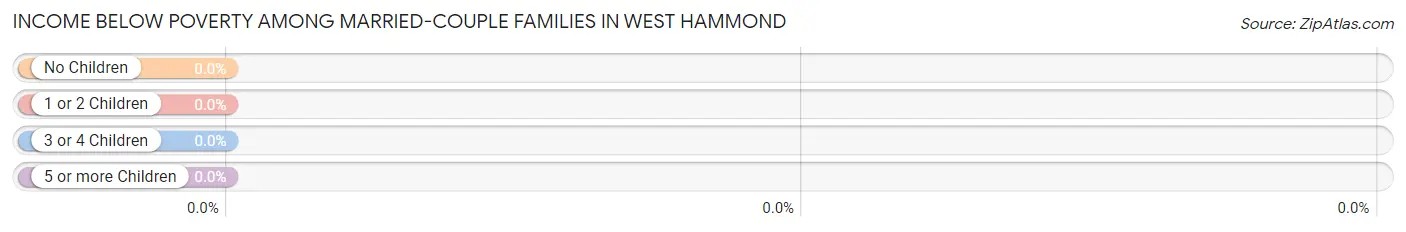
Income Below Poverty Among Married-Couple Families in West Hammond
| Children | Above Poverty | Below Poverty |
| No Children | 233 (100.0%) | 0 (0.0%) |
| 1 or 2 Children | 187 (100.0%) | 0 (0.0%) |
| 3 or 4 Children | 30 (100.0%) | 0 (0.0%) |
| 5 or more Children | 7 (100.0%) | 0 (0.0%) |
| Total | 457 (100.0%) | 0 (0.0%) |
Income Below Poverty Among Single-Parent Households in West Hammond
According to the poverty data in West Hammond, 36.5% or 19 single-father households and 49.5% or 51 single-mother households are living below the poverty line. Among single-father households, those with no children have the highest poverty rate, with 19 households (42.2%) experiencing poverty. Likewise, among single-mother households, those with 1 or 2 children have the highest poverty rate, with 51 households (56.0%) falling below the poverty line.
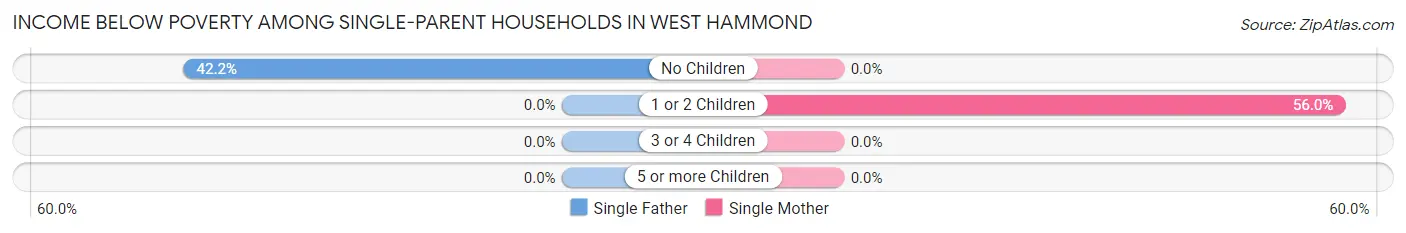
| Children | Single Father | Single Mother |
| No Children | 19 (42.2%) | 0 (0.0%) |
| 1 or 2 Children | 0 (0.0%) | 51 (56.0%) |
| 3 or 4 Children | 0 (0.0%) | 0 (0.0%) |
| 5 or more Children | 0 (0.0%) | 0 (0.0%) |
| Total | 19 (36.5%) | 51 (49.5%) |
Income Below Poverty Among Married-Couple vs Single-Parent Households in West Hammond
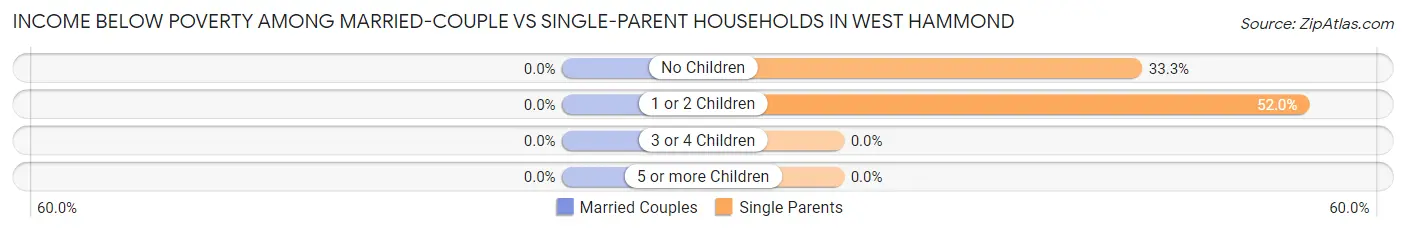
| Children | Married-Couple Families | Single-Parent Households |
| No Children | 0 (0.0%) | 19 (33.3%) |
| 1 or 2 Children | 0 (0.0%) | 51 (52.0%) |
| 3 or 4 Children | 0 (0.0%) | 0 (0.0%) |
| 5 or more Children | 0 (0.0%) | 0 (0.0%) |
| Total | 0 (0.0%) | 70 (45.2%) |
Race in West Hammond
The most populous races in West Hammond are White / Caucasian (1,724 | 71.5%), Hispanic or Latino (1,051 | 43.6%), and Some other Race (305 | 12.7%).
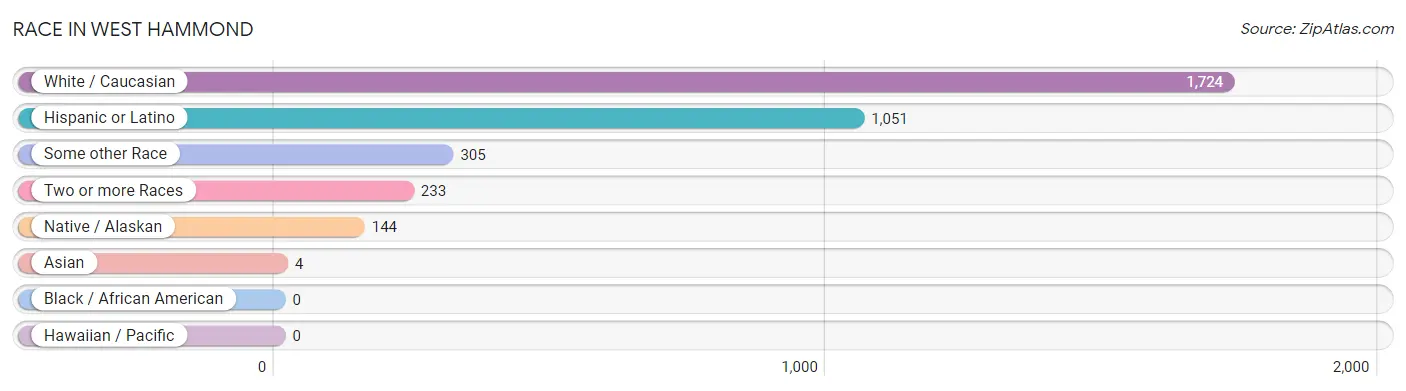
| Race | # Population | % Population |
| Asian | 4 | 0.2% |
| Black / African American | 0 | 0.0% |
| Hawaiian / Pacific | 0 | 0.0% |
| Hispanic or Latino | 1,051 | 43.6% |
| Native / Alaskan | 144 | 6.0% |
| White / Caucasian | 1,724 | 71.5% |
| Two or more Races | 233 | 9.7% |
| Some other Race | 305 | 12.7% |
| Total | 2,410 | 100.0% |
Ancestry in West Hammond
The most populous ancestries reported in West Hammond are Mexican (675 | 28.0%), German (321 | 13.3%), Irish (204 | 8.5%), Spaniard (161 | 6.7%), and English (155 | 6.4%), together accounting for 62.9% of all West Hammond residents.
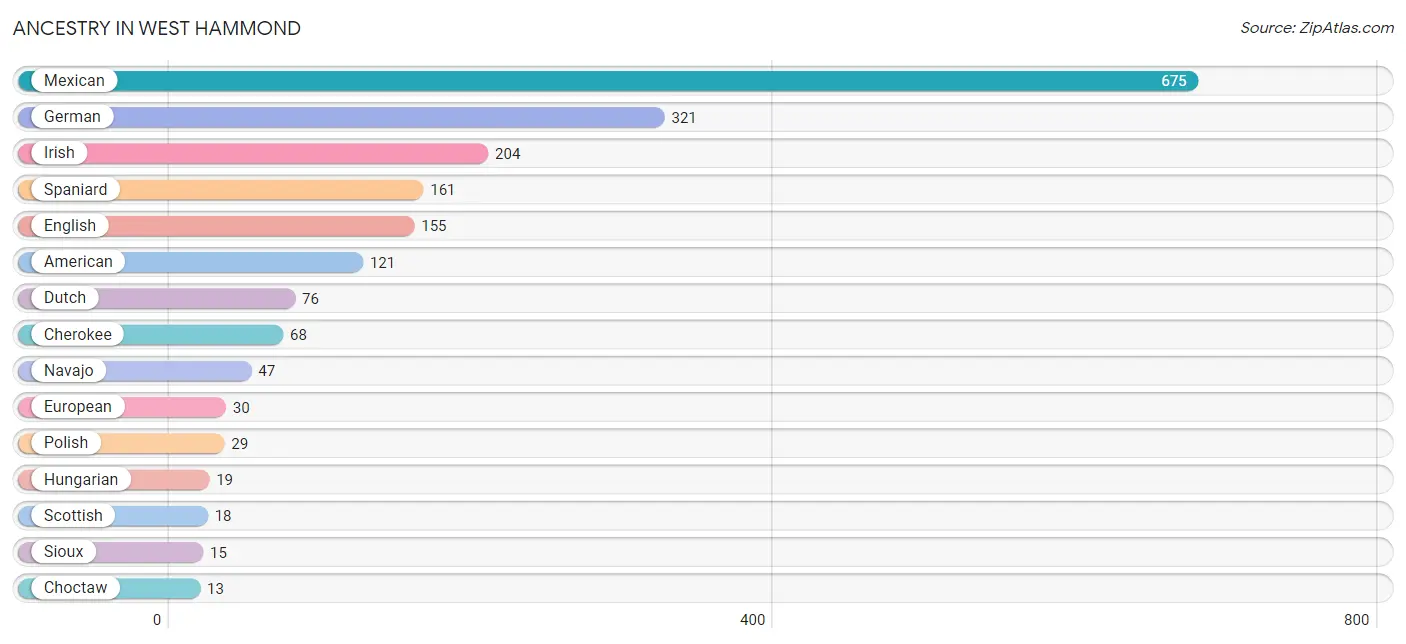
| Ancestry | # Population | % Population |
| American | 121 | 5.0% |
| Apache | 7 | 0.3% |
| British | 10 | 0.4% |
| Cherokee | 68 | 2.8% |
| Choctaw | 13 | 0.5% |
| Czech | 3 | 0.1% |
| Danish | 12 | 0.5% |
| Dutch | 76 | 3.2% |
| Eastern European | 4 | 0.2% |
| English | 155 | 6.4% |
| European | 30 | 1.2% |
| French | 12 | 0.5% |
| French Canadian | 11 | 0.5% |
| German | 321 | 13.3% |
| Greek | 3 | 0.1% |
| Hungarian | 19 | 0.8% |
| Irish | 204 | 8.5% |
| Italian | 6 | 0.3% |
| Korean | 4 | 0.2% |
| Mexican | 675 | 28.0% |
| Navajo | 47 | 1.9% |
| New Zealander | 5 | 0.2% |
| Norwegian | 7 | 0.3% |
| Pakistani | 9 | 0.4% |
| Polish | 29 | 1.2% |
| Portuguese | 4 | 0.2% |
| Pueblo | 5 | 0.2% |
| Puerto Rican | 5 | 0.2% |
| Scottish | 18 | 0.7% |
| Sioux | 15 | 0.6% |
| Spaniard | 161 | 6.7% | View All 31 Rows |
Immigrants in West Hammond
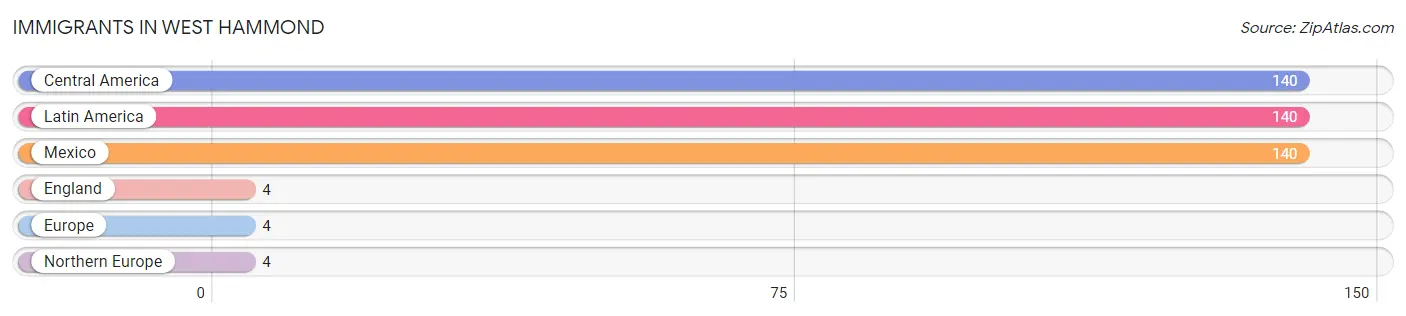
The most numerous immigrant groups reported in West Hammond came from Central America (140 | 5.8%), Latin America (140 | 5.8%), Mexico (140 | 5.8%), England (4 | 0.2%), and Europe (4 | 0.2%), together accounting for 17.8% of all West Hammond residents.
| Immigration Origin | # Population | % Population |
| Central America | 140 | 5.8% |
| England | 4 | 0.2% |
| Europe | 4 | 0.2% |
| Latin America | 140 | 5.8% |
| Mexico | 140 | 5.8% |
| Northern Europe | 4 | 0.2% | View All 6 Rows |
Sex and Age in West Hammond
Sex and Age in West Hammond
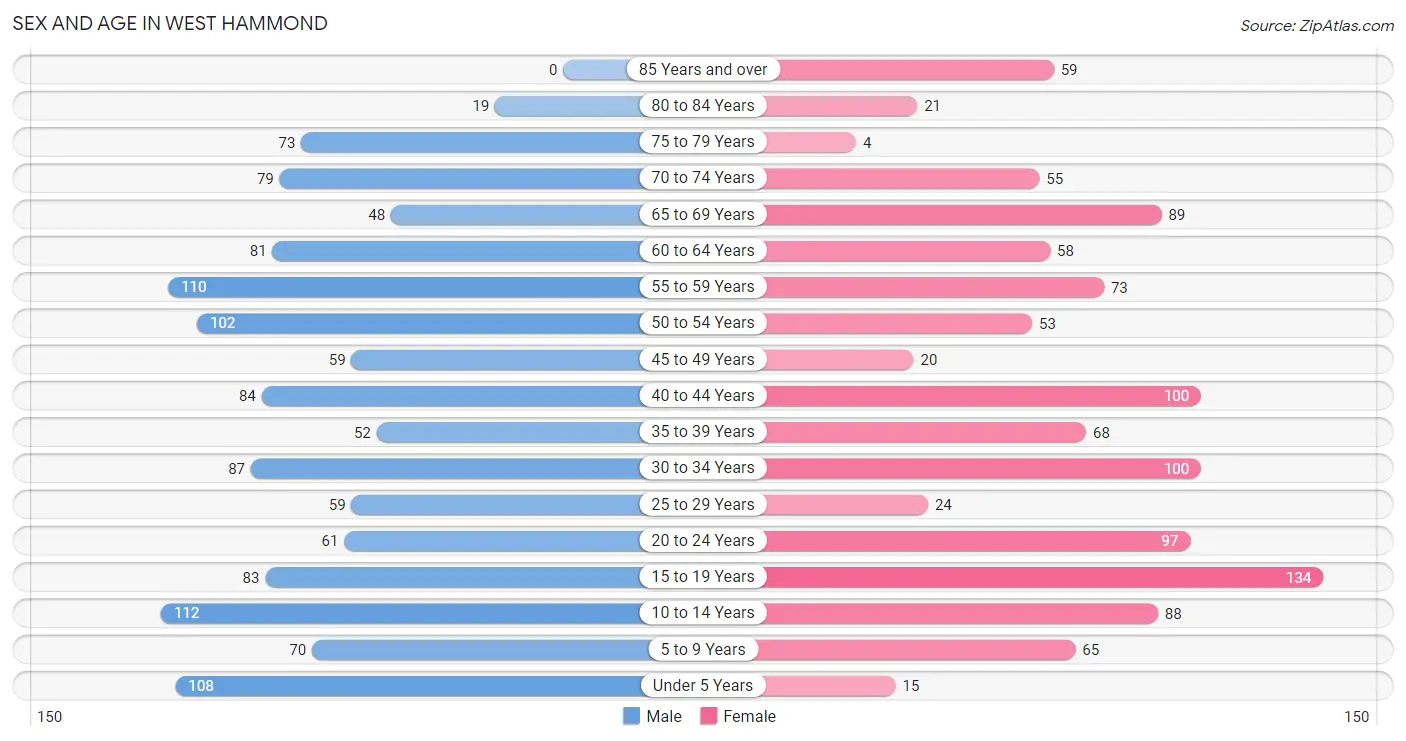
The most populous age groups in West Hammond are 10 to 14 Years (112 | 8.7%) for men and 15 to 19 Years (134 | 11.9%) for women.
| Age Bracket | Male | Female |
| Under 5 Years | 108 (8.4%) | 15 (1.3%) |
| 5 to 9 Years | 70 (5.4%) | 65 (5.8%) |
| 10 to 14 Years | 112 (8.7%) | 88 (7.8%) |
| 15 to 19 Years | 83 (6.5%) | 134 (11.9%) |
| 20 to 24 Years | 61 (4.7%) | 97 (8.6%) |
| 25 to 29 Years | 59 (4.6%) | 24 (2.1%) |
| 30 to 34 Years | 87 (6.8%) | 100 (8.9%) |
| 35 to 39 Years | 52 (4.0%) | 68 (6.1%) |
| 40 to 44 Years | 84 (6.5%) | 100 (8.9%) |
| 45 to 49 Years | 59 (4.6%) | 20 (1.8%) |
| 50 to 54 Years | 102 (7.9%) | 53 (4.7%) |
| 55 to 59 Years | 110 (8.6%) | 73 (6.5%) |
| 60 to 64 Years | 81 (6.3%) | 58 (5.2%) |
| 65 to 69 Years | 48 (3.7%) | 89 (7.9%) |
| 70 to 74 Years | 79 (6.1%) | 55 (4.9%) |
| 75 to 79 Years | 73 (5.7%) | 4 (0.4%) |
| 80 to 84 Years | 19 (1.5%) | 21 (1.9%) |
| 85 Years and over | 0 (0.0%) | 59 (5.2%) |
| Total | 1,287 (100.0%) | 1,123 (100.0%) |
Families and Households in West Hammond
Median Family Size in West Hammond
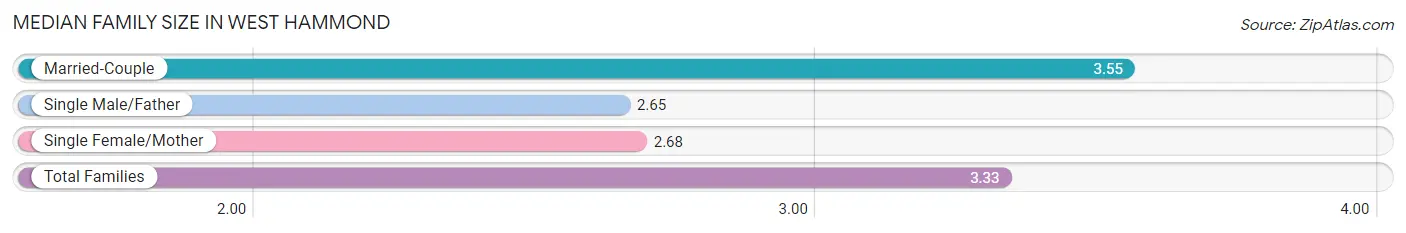
The median family size in West Hammond is 3.33 persons per family, with married-couple families (457 | 74.7%) accounting for the largest median family size of 3.55 persons per family. On the other hand, single male/father families (52 | 8.5%) represent the smallest median family size with 2.65 persons per family.
| Family Type | # Families | Family Size |
| Married-Couple | 457 (74.7%) | 3.55 |
| Single Male/Father | 52 (8.5%) | 2.65 |
| Single Female/Mother | 103 (16.8%) | 2.68 |
| Total Families | 612 (100.0%) | 3.33 |
Median Household Size in West Hammond
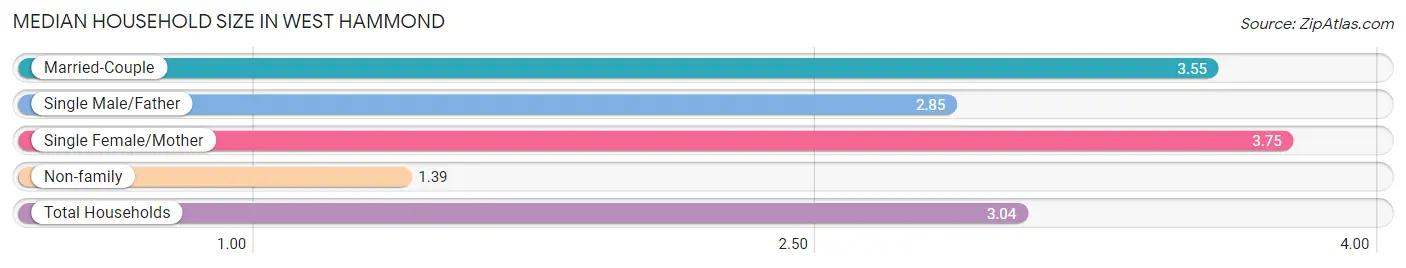
The median household size in West Hammond is 3.04 persons per household, with single female/mother households (103 | 13.0%) accounting for the largest median household size of 3.75 persons per household. non-family households (181 | 22.8%) represent the smallest median household size with 1.39 persons per household.
| Household Type | # Households | Household Size |
| Married-Couple | 457 (57.6%) | 3.55 |
| Single Male/Father | 52 (6.6%) | 2.85 |
| Single Female/Mother | 103 (13.0%) | 3.75 |
| Non-family | 181 (22.8%) | 1.39 |
| Total Households | 793 (100.0%) | 3.04 |
Household Size by Marriage Status in West Hammond
Out of a total of 793 households in West Hammond, 612 (77.2%) are family households, while 181 (22.8%) are nonfamily households. The most numerous type of family households are 3-person households, comprising 222, and the most common type of nonfamily households are 1-person households, comprising 138.
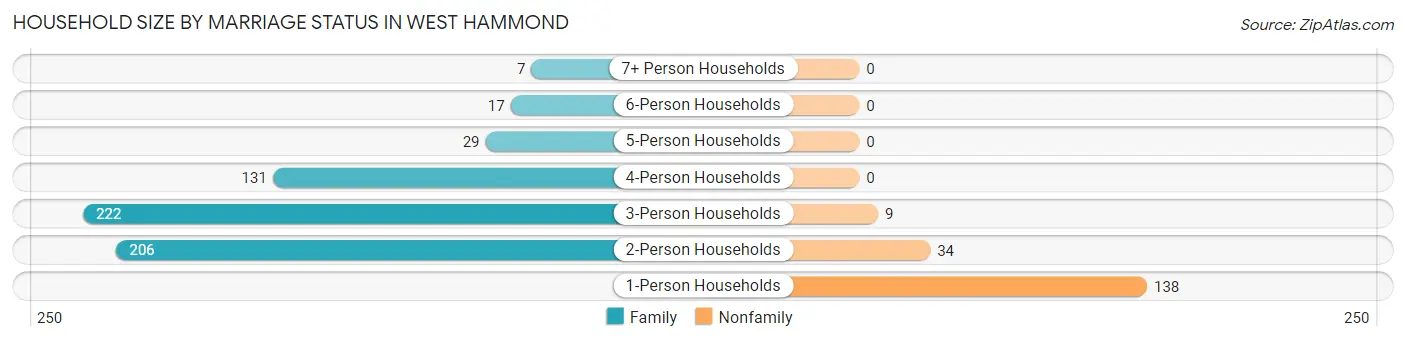
| Household Size | Family Households | Nonfamily Households |
| 1-Person Households | - | 138 (17.4%) |
| 2-Person Households | 206 (26.0%) | 34 (4.3%) |
| 3-Person Households | 222 (28.0%) | 9 (1.1%) |
| 4-Person Households | 131 (16.5%) | 0 (0.0%) |
| 5-Person Households | 29 (3.7%) | 0 (0.0%) |
| 6-Person Households | 17 (2.1%) | 0 (0.0%) |
| 7+ Person Households | 7 (0.9%) | 0 (0.0%) |
| Total | 612 (77.2%) | 181 (22.8%) |
Female Fertility in West Hammond
Fertility by Age in West Hammond
Average fertility rate in West Hammond is 84.0 births per 1,000 women. Women in the age bracket of 20 to 34 years have the highest fertility rate with 176.0 births per 1,000 women. Women in the age bracket of 20 to 34 years acount for 84.8% of all women with births.
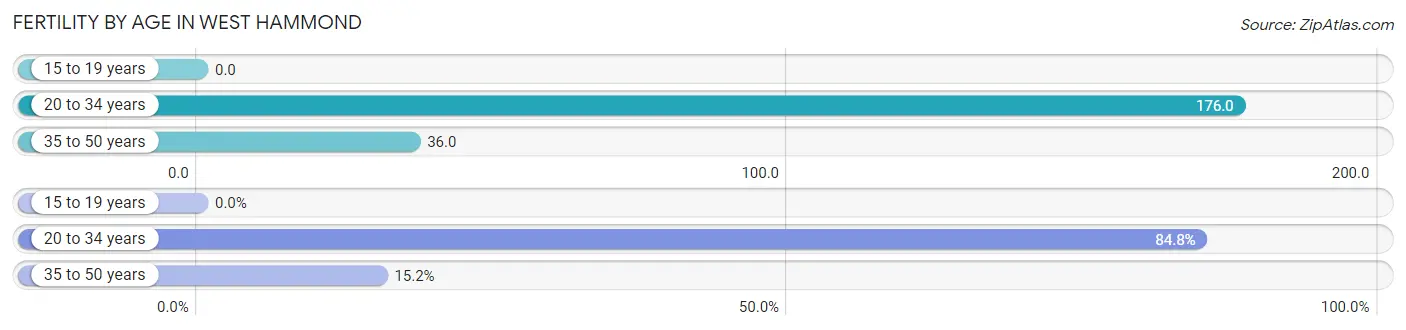
| Age Bracket | Women with Births | Births / 1,000 Women |
| 15 to 19 years | 0 (0.0%) | 0.0 |
| 20 to 34 years | 39 (84.8%) | 176.0 |
| 35 to 50 years | 7 (15.2%) | 36.0 |
| Total | 46 (100.0%) | 84.0 |
Fertility by Age by Marriage Status in West Hammond
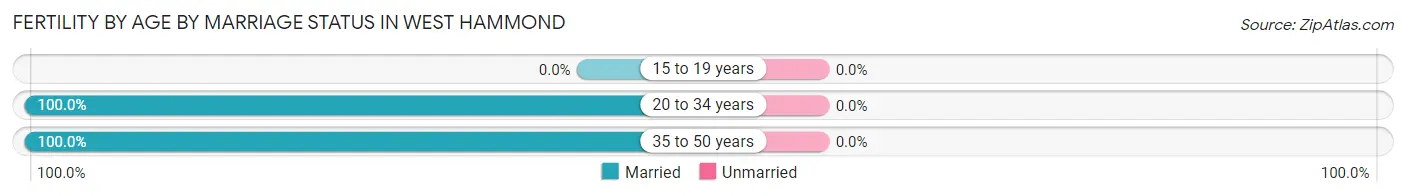
| Age Bracket | Married | Unmarried |
| 15 to 19 years | 0 (0.0%) | 0 (0.0%) |
| 20 to 34 years | 39 (100.0%) | 0 (0.0%) |
| 35 to 50 years | 7 (100.0%) | 0 (0.0%) |
| Total | 46 (100.0%) | 0 (0.0%) |
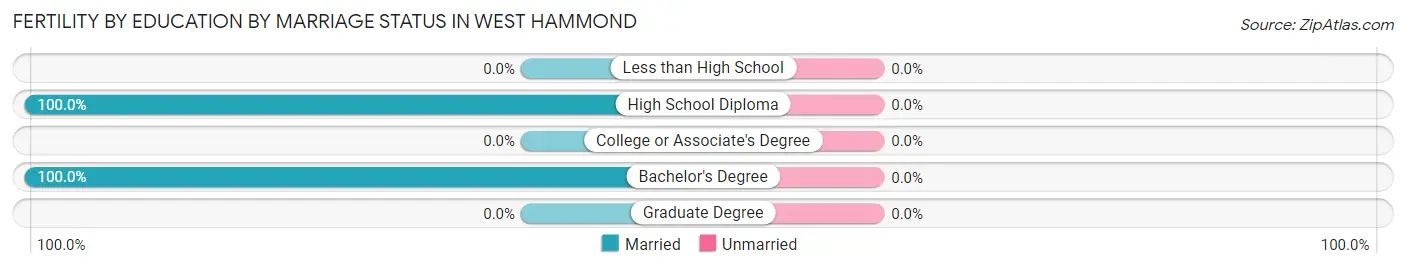
Fertility by Education in West Hammond
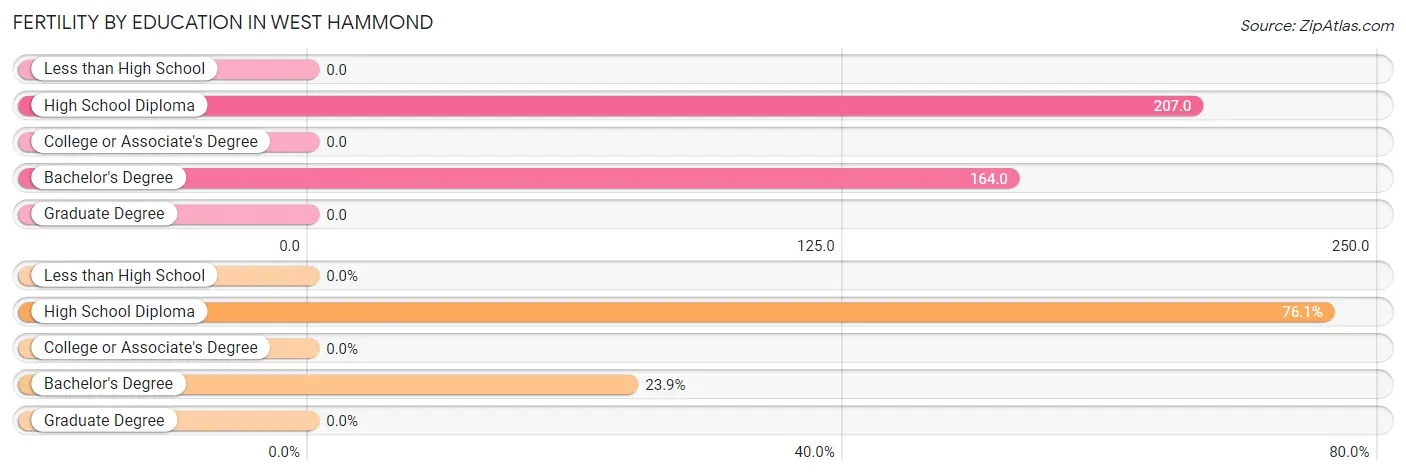
| Educational Attainment | Women with Births | Births / 1,000 Women |
| Less than High School | 0 (0.0%) | 0.0 |
| High School Diploma | 35 (76.1%) | 207.0 |
| College or Associate's Degree | 0 (0.0%) | 0.0 |
| Bachelor's Degree | 11 (23.9%) | 164.0 |
| Graduate Degree | 0 (0.0%) | 0.0 |
| Total | 46 (100.0%) | 84.0 |
Fertility by Education by Marriage Status in West Hammond
| Educational Attainment | Married | Unmarried |
| Less than High School | 0 (0.0%) | 0 (0.0%) |
| High School Diploma | 35 (100.0%) | 0 (0.0%) |
| College or Associate's Degree | 0 (0.0%) | 0 (0.0%) |
| Bachelor's Degree | 11 (100.0%) | 0 (0.0%) |
| Graduate Degree | 0 (0.0%) | 0 (0.0%) |
| Total | 46 (100.0%) | 0 (0.0%) |
Employment Characteristics in West Hammond
Employment by Class of Employer in West Hammond
Among the 892 employed individuals in West Hammond, private company employees (644 | 72.2%), self-employed (not incorporated) (84 | 9.4%), and local government employees (65 | 7.3%) make up the most common classes of employment.
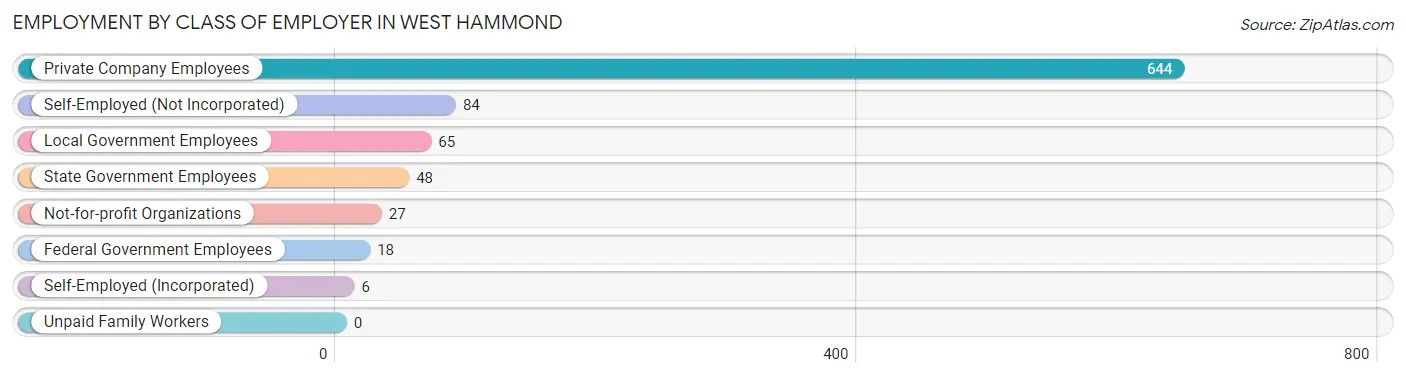
| Employer Class | # Employees | % Employees |
| Private Company Employees | 644 | 72.2% |
| Self-Employed (Incorporated) | 6 | 0.7% |
| Self-Employed (Not Incorporated) | 84 | 9.4% |
| Not-for-profit Organizations | 27 | 3.0% |
| Local Government Employees | 65 | 7.3% |
| State Government Employees | 48 | 5.4% |
| Federal Government Employees | 18 | 2.0% |
| Unpaid Family Workers | 0 | 0.0% |
| Total | 892 | 100.0% |
Employment Status by Age in West Hammond
According to the labor force statistics for West Hammond, out of the total population over 16 years of age (1,893), 51.8% or 981 individuals are in the labor force, with 8.6% or 84 of them unemployed. The age group with the highest labor force participation rate is 30 to 34 years, with 79.1% or 148 individuals in the labor force. Within the labor force, the 20 to 24 years age range has the highest percentage of unemployed individuals, with 50.5% or 54 of them being unemployed.
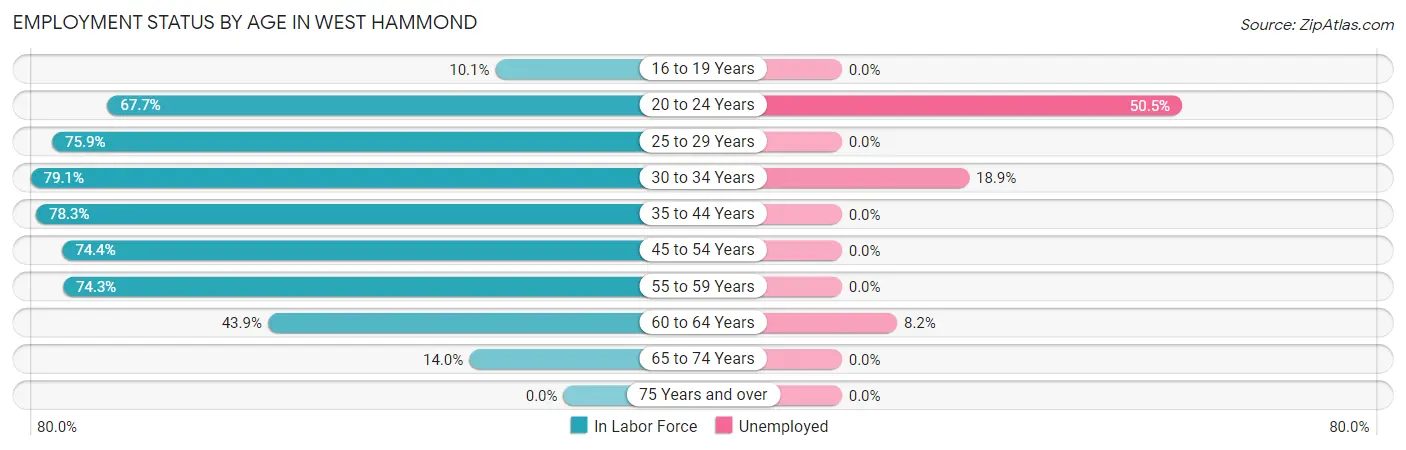
| Age Bracket | In Labor Force | Unemployed |
| 16 to 19 Years | 16 (10.1%) | 0 (0.0%) |
| 20 to 24 Years | 107 (67.7%) | 54 (50.5%) |
| 25 to 29 Years | 63 (75.9%) | 0 (0.0%) |
| 30 to 34 Years | 148 (79.1%) | 28 (18.9%) |
| 35 to 44 Years | 238 (78.3%) | 0 (0.0%) |
| 45 to 54 Years | 174 (74.4%) | 0 (0.0%) |
| 55 to 59 Years | 136 (74.3%) | 0 (0.0%) |
| 60 to 64 Years | 61 (43.9%) | 5 (8.2%) |
| 65 to 74 Years | 38 (14.0%) | 0 (0.0%) |
| 75 Years and over | 0 (0.0%) | 0 (0.0%) |
| Total | 981 (51.8%) | 84 (8.6%) |
Employment Status by Educational Attainment in West Hammond
According to labor force statistics for West Hammond, 72.6% of individuals (820) out of the total population between 25 and 64 years of age (1,130) are in the labor force, with 4.0% or 33 of them being unemployed. The group with the highest labor force participation rate are those with the educational attainment of bachelor's degree or higher, with 84.9% or 152 individuals in the labor force. Within the labor force, individuals with high school diploma education have the highest percentage of unemployment, with 8.6% or 33 of them being unemployed.
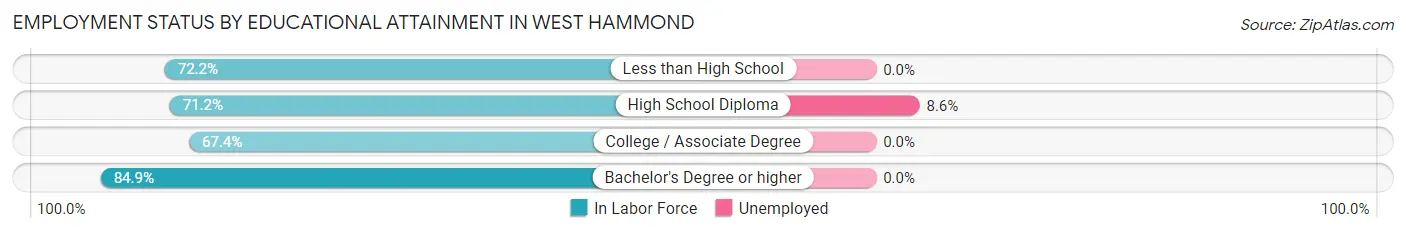
| Educational Attainment | In Labor Force | Unemployed |
| Less than High School | 96 (72.2%) | 0 (0.0%) |
| High School Diploma | 384 (71.2%) | 46 (8.6%) |
| College / Associate Degree | 188 (67.4%) | 0 (0.0%) |
| Bachelor's Degree or higher | 152 (84.9%) | 0 (0.0%) |
| Total | 820 (72.6%) | 45 (4.0%) |
Employment Occupations by Sex in West Hammond
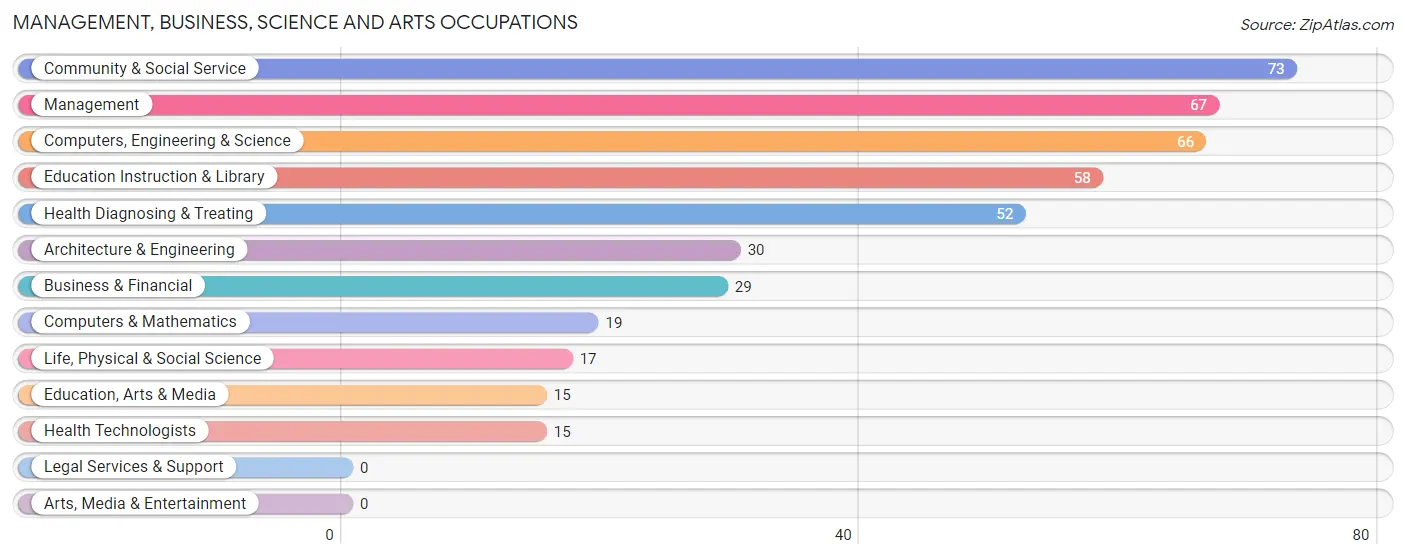
Management, Business, Science and Arts Occupations
The most common Management, Business, Science and Arts occupations in West Hammond are Community & Social Service (73 | 8.2%), Management (67 | 7.5%), Computers, Engineering & Science (66 | 7.4%), Education Instruction & Library (58 | 6.5%), and Health Diagnosing & Treating (52 | 5.8%).
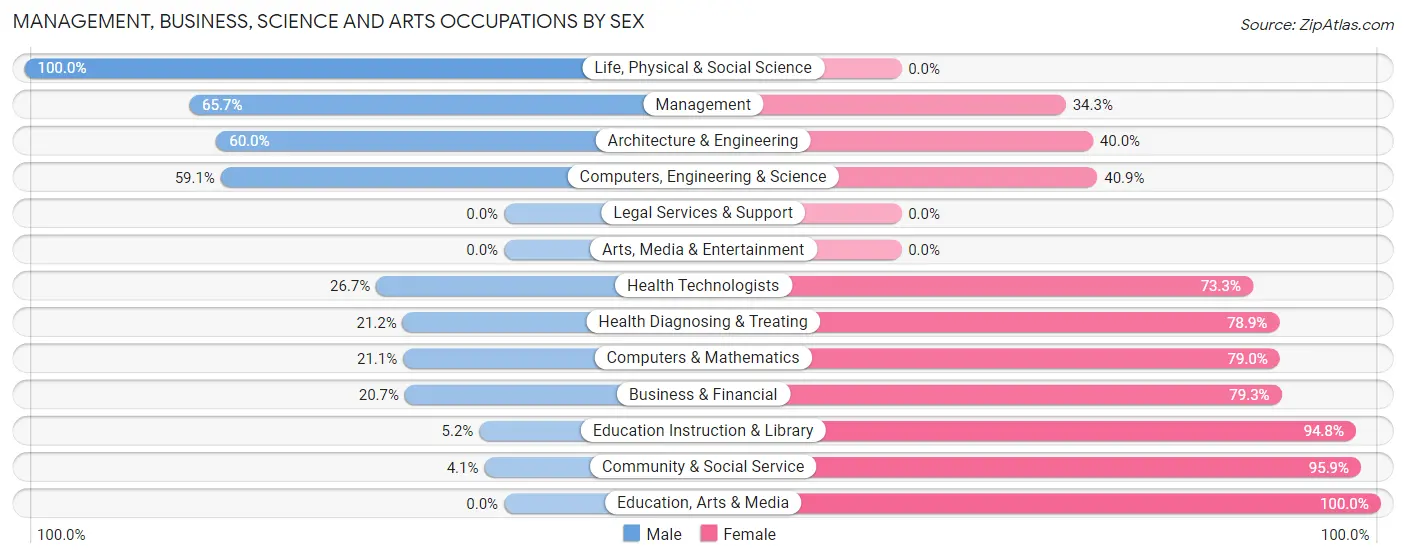
Management, Business, Science and Arts Occupations by Sex
Within the Management, Business, Science and Arts occupations in West Hammond, the most male-oriented occupations are Life, Physical & Social Science (100.0%), Management (65.7%), and Architecture & Engineering (60.0%), while the most female-oriented occupations are Education, Arts & Media (100.0%), Community & Social Service (95.9%), and Education Instruction & Library (94.8%).
| Occupation | Male | Female |
| Management | 44 (65.7%) | 23 (34.3%) |
| Business & Financial | 6 (20.7%) | 23 (79.3%) |
| Computers, Engineering & Science | 39 (59.1%) | 27 (40.9%) |
| Computers & Mathematics | 4 (21.0%) | 15 (78.9%) |
| Architecture & Engineering | 18 (60.0%) | 12 (40.0%) |
| Life, Physical & Social Science | 17 (100.0%) | 0 (0.0%) |
| Community & Social Service | 3 (4.1%) | 70 (95.9%) |
| Education, Arts & Media | 0 (0.0%) | 15 (100.0%) |
| Legal Services & Support | 0 (0.0%) | 0 (0.0%) |
| Education Instruction & Library | 3 (5.2%) | 55 (94.8%) |
| Arts, Media & Entertainment | 0 (0.0%) | 0 (0.0%) |
| Health Diagnosing & Treating | 11 (21.1%) | 41 (78.8%) |
| Health Technologists | 4 (26.7%) | 11 (73.3%) |
| Total (Category) | 103 (35.9%) | 184 (64.1%) |
| Total (Overall) | 516 (57.9%) | 375 (42.1%) |
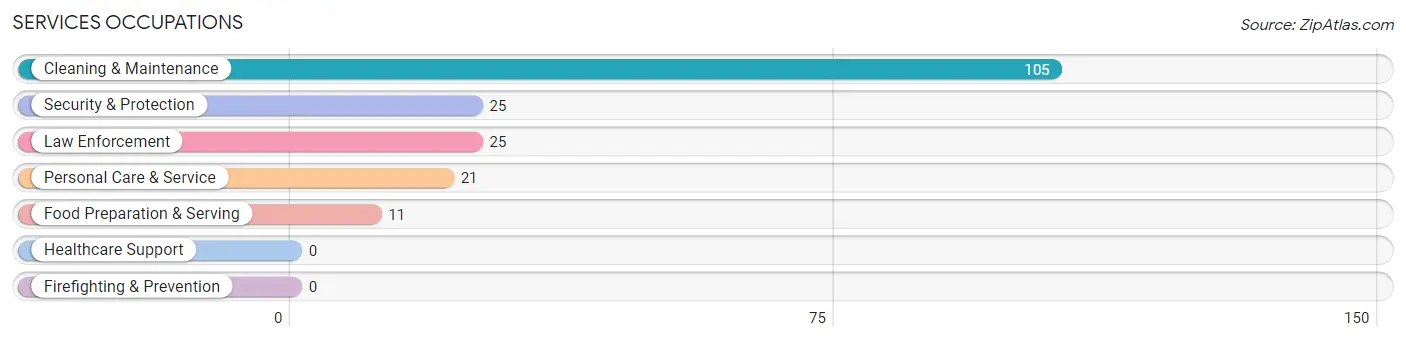
Services Occupations
The most common Services occupations in West Hammond are Cleaning & Maintenance (105 | 11.8%), Security & Protection (25 | 2.8%), Law Enforcement (25 | 2.8%), Personal Care & Service (21 | 2.4%), and Food Preparation & Serving (11 | 1.2%).
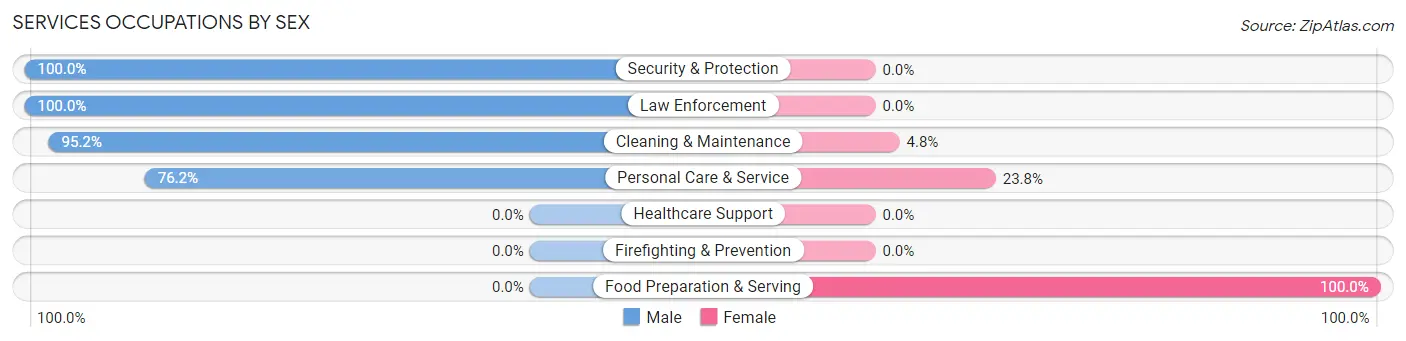
Services Occupations by Sex
Within the Services occupations in West Hammond, the most male-oriented occupations are Security & Protection (100.0%), Law Enforcement (100.0%), and Cleaning & Maintenance (95.2%), while the most female-oriented occupations are Food Preparation & Serving (100.0%), Personal Care & Service (23.8%), and Cleaning & Maintenance (4.8%).
| Occupation | Male | Female |
| Healthcare Support | 0 (0.0%) | 0 (0.0%) |
| Security & Protection | 25 (100.0%) | 0 (0.0%) |
| Firefighting & Prevention | 0 (0.0%) | 0 (0.0%) |
| Law Enforcement | 25 (100.0%) | 0 (0.0%) |
| Food Preparation & Serving | 0 (0.0%) | 11 (100.0%) |
| Cleaning & Maintenance | 100 (95.2%) | 5 (4.8%) |
| Personal Care & Service | 16 (76.2%) | 5 (23.8%) |
| Total (Category) | 141 (87.0%) | 21 (13.0%) |
| Total (Overall) | 516 (57.9%) | 375 (42.1%) |
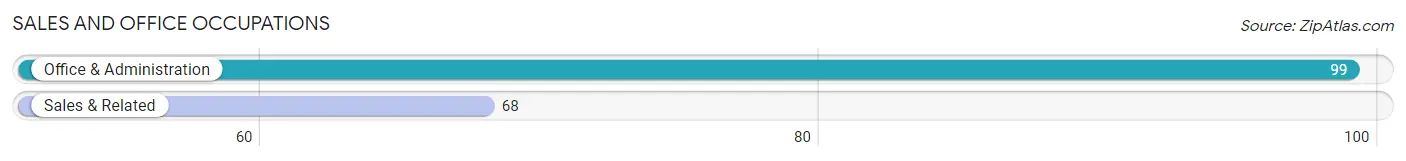
Sales and Office Occupations
The most common Sales and Office occupations in West Hammond are Office & Administration (99 | 11.1%), and Sales & Related (68 | 7.6%).
Sales and Office Occupations by Sex
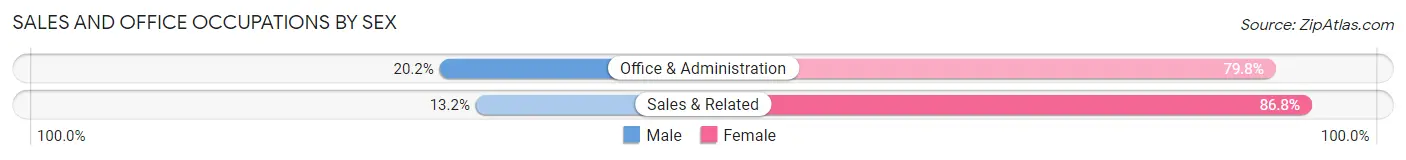
| Occupation | Male | Female |
| Sales & Related | 9 (13.2%) | 59 (86.8%) |
| Office & Administration | 20 (20.2%) | 79 (79.8%) |
| Total (Category) | 29 (17.4%) | 138 (82.6%) |
| Total (Overall) | 516 (57.9%) | 375 (42.1%) |
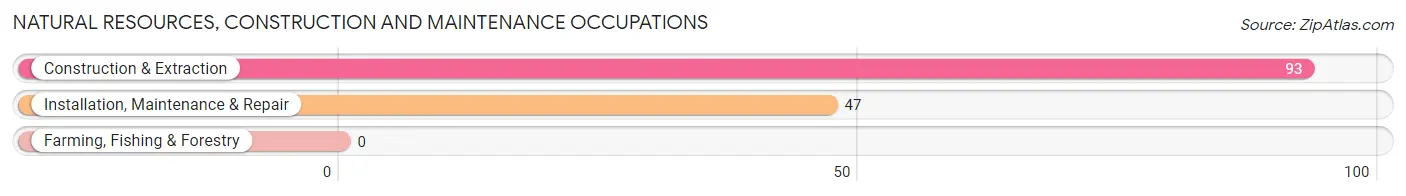
Natural Resources, Construction and Maintenance Occupations
The most common Natural Resources, Construction and Maintenance occupations in West Hammond are Construction & Extraction (93 | 10.4%), and Installation, Maintenance & Repair (47 | 5.3%).
Natural Resources, Construction and Maintenance Occupations by Sex
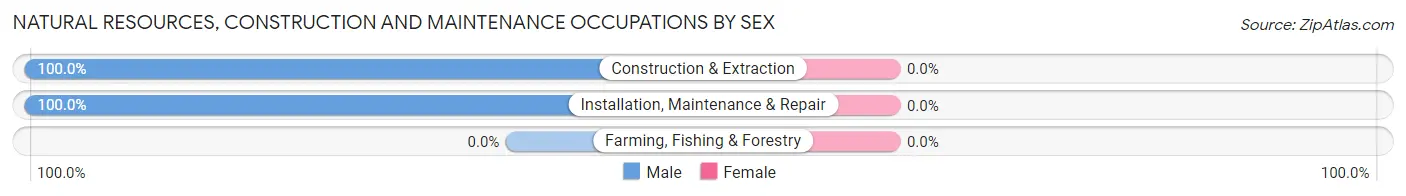
| Occupation | Male | Female |
| Farming, Fishing & Forestry | 0 (0.0%) | 0 (0.0%) |
| Construction & Extraction | 93 (100.0%) | 0 (0.0%) |
| Installation, Maintenance & Repair | 47 (100.0%) | 0 (0.0%) |
| Total (Category) | 140 (100.0%) | 0 (0.0%) |
| Total (Overall) | 516 (57.9%) | 375 (42.1%) |
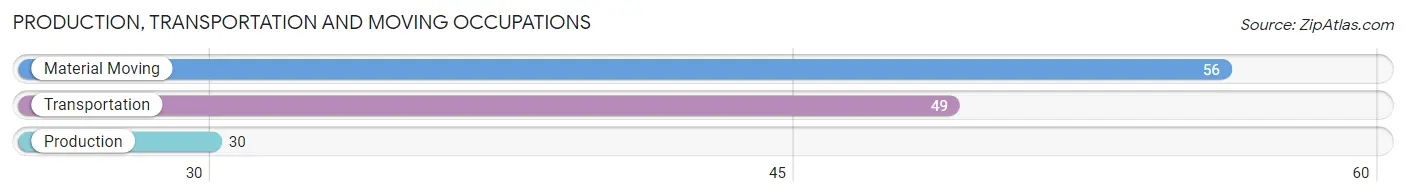
Production, Transportation and Moving Occupations
The most common Production, Transportation and Moving occupations in West Hammond are Material Moving (56 | 6.3%), Transportation (49 | 5.5%), and Production (30 | 3.4%).
Production, Transportation and Moving Occupations by Sex
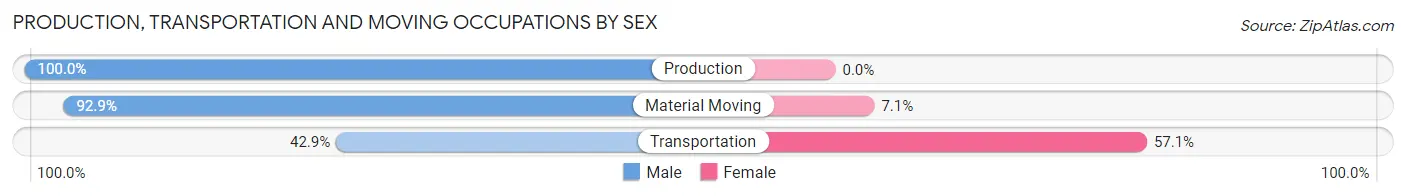
| Occupation | Male | Female |
| Production | 30 (100.0%) | 0 (0.0%) |
| Transportation | 21 (42.9%) | 28 (57.1%) |
| Material Moving | 52 (92.9%) | 4 (7.1%) |
| Total (Category) | 103 (76.3%) | 32 (23.7%) |
| Total (Overall) | 516 (57.9%) | 375 (42.1%) |
Employment Industries by Sex in West Hammond
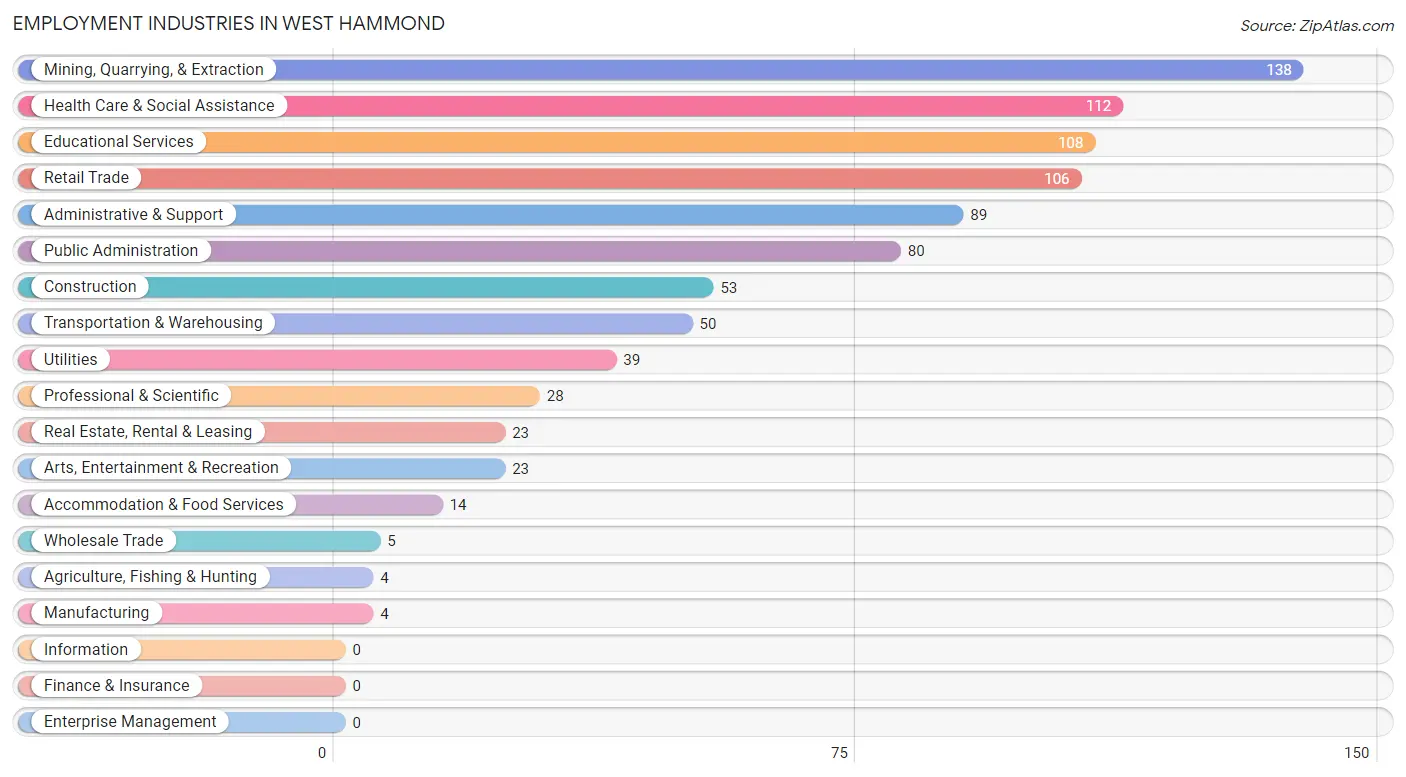
Employment Industries in West Hammond
The major employment industries in West Hammond include Mining, Quarrying, & Extraction (138 | 15.5%), Health Care & Social Assistance (112 | 12.6%), Educational Services (108 | 12.1%), Retail Trade (106 | 11.9%), and Administrative & Support (89 | 10.0%).
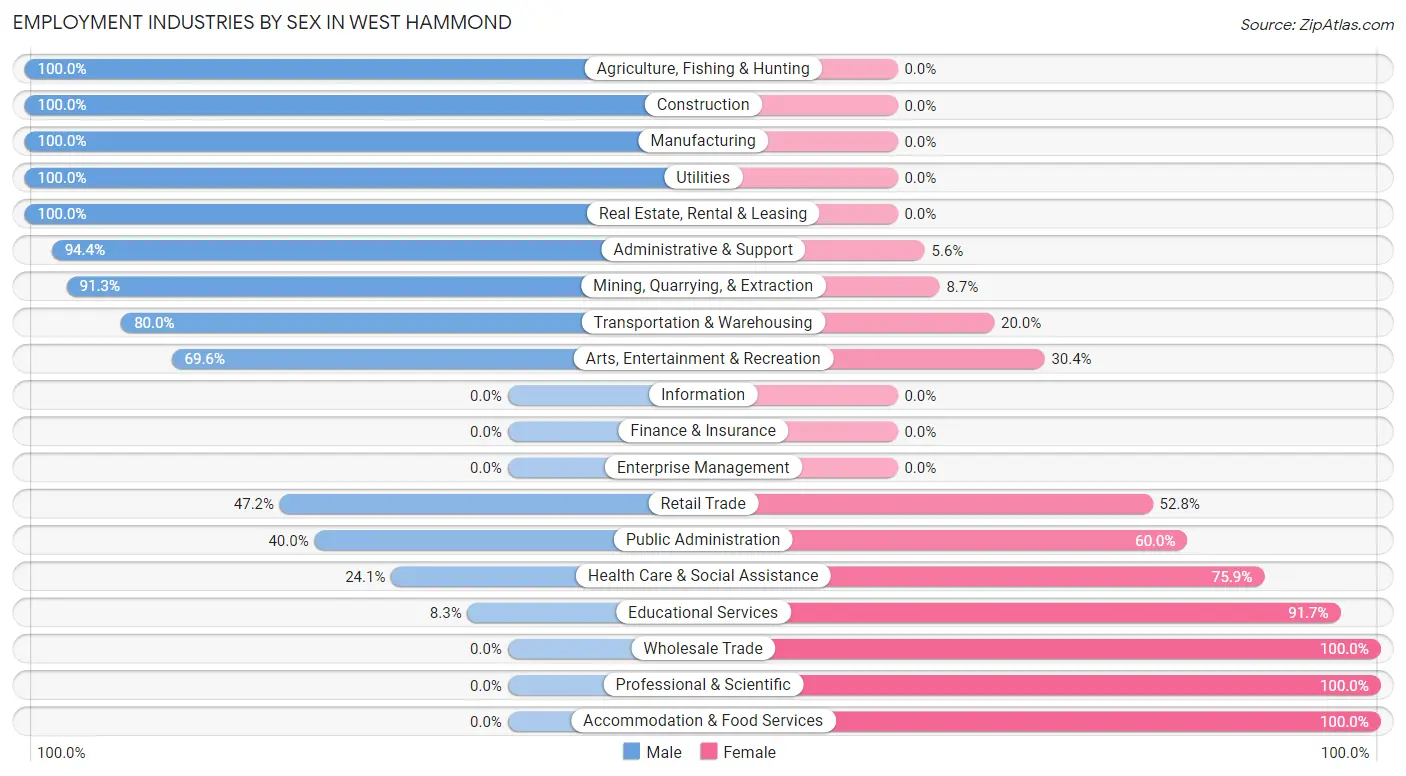
Employment Industries by Sex in West Hammond
The West Hammond industries that see more men than women are Agriculture, Fishing & Hunting (100.0%), Construction (100.0%), and Manufacturing (100.0%), whereas the industries that tend to have a higher number of women are Wholesale Trade (100.0%), Professional & Scientific (100.0%), and Accommodation & Food Services (100.0%).
| Industry | Male | Female |
| Agriculture, Fishing & Hunting | 4 (100.0%) | 0 (0.0%) |
| Mining, Quarrying, & Extraction | 126 (91.3%) | 12 (8.7%) |
| Construction | 53 (100.0%) | 0 (0.0%) |
| Manufacturing | 4 (100.0%) | 0 (0.0%) |
| Wholesale Trade | 0 (0.0%) | 5 (100.0%) |
| Retail Trade | 50 (47.2%) | 56 (52.8%) |
| Transportation & Warehousing | 40 (80.0%) | 10 (20.0%) |
| Utilities | 39 (100.0%) | 0 (0.0%) |
| Information | 0 (0.0%) | 0 (0.0%) |
| Finance & Insurance | 0 (0.0%) | 0 (0.0%) |
| Real Estate, Rental & Leasing | 23 (100.0%) | 0 (0.0%) |
| Professional & Scientific | 0 (0.0%) | 28 (100.0%) |
| Enterprise Management | 0 (0.0%) | 0 (0.0%) |
| Administrative & Support | 84 (94.4%) | 5 (5.6%) |
| Educational Services | 9 (8.3%) | 99 (91.7%) |
| Health Care & Social Assistance | 27 (24.1%) | 85 (75.9%) |
| Arts, Entertainment & Recreation | 16 (69.6%) | 7 (30.4%) |
| Accommodation & Food Services | 0 (0.0%) | 14 (100.0%) |
| Public Administration | 32 (40.0%) | 48 (60.0%) |
| Total | 516 (57.9%) | 375 (42.1%) |
Education in West Hammond
School Enrollment in West Hammond
The most common levels of schooling among the 633 students in West Hammond are high school (266 | 42.0%), college / undergraduate (128 | 20.2%), and elementary school (109 | 17.2%).
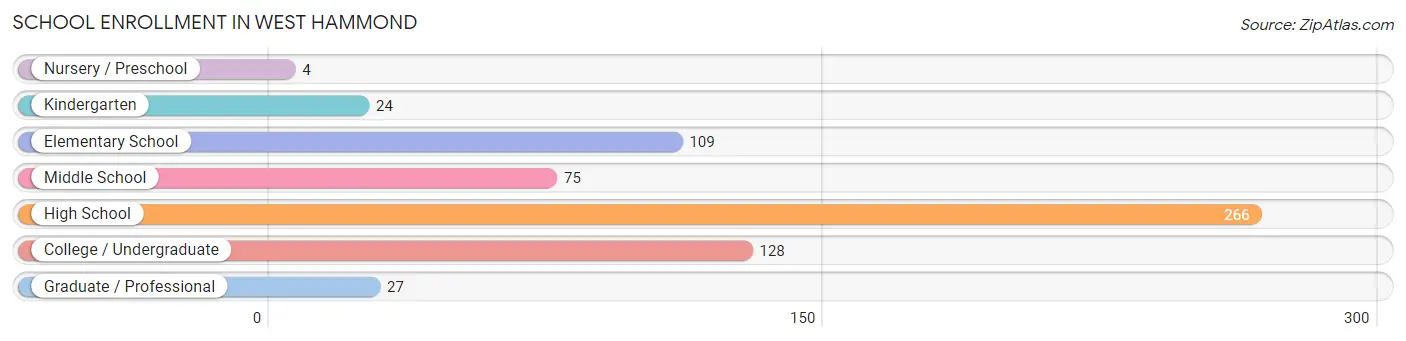
| School Level | # Students | % Students |
| Nursery / Preschool | 4 | 0.6% |
| Kindergarten | 24 | 3.8% |
| Elementary School | 109 | 17.2% |
| Middle School | 75 | 11.8% |
| High School | 266 | 42.0% |
| College / Undergraduate | 128 | 20.2% |
| Graduate / Professional | 27 | 4.3% |
| Total | 633 | 100.0% |
School Enrollment by Age by Funding Source in West Hammond
Out of a total of 633 students who are enrolled in schools in West Hammond, 66 (10.4%) attend a private institution, while the remaining 567 (89.6%) are enrolled in public schools. The age group of 3 to 4 year olds has the highest likelihood of being enrolled in private schools, with 5 (100.0% in the age bracket) enrolled. Conversely, the age group of 15 to 17 year olds has the lowest likelihood of being enrolled in a private school, with 161 (100.0% in the age bracket) attending a public institution.
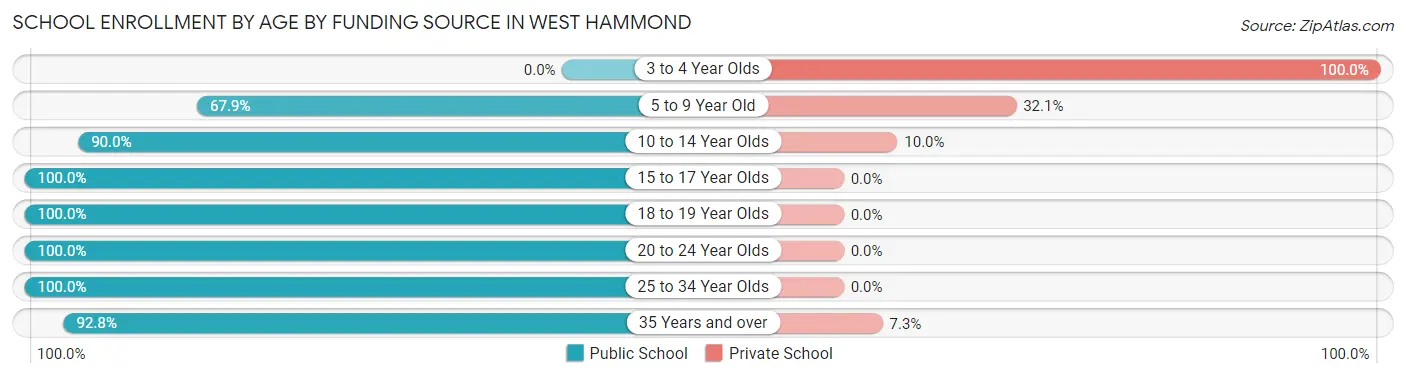
| Age Bracket | Public School | Private School |
| 3 to 4 Year Olds | 0 (0.0%) | 5 (100.0%) |
| 5 to 9 Year Old | 76 (67.9%) | 36 (32.1%) |
| 10 to 14 Year Olds | 180 (90.0%) | 20 (10.0%) |
| 15 to 17 Year Olds | 161 (100.0%) | 0 (0.0%) |
| 18 to 19 Year Olds | 28 (100.0%) | 0 (0.0%) |
| 20 to 24 Year Olds | 51 (100.0%) | 0 (0.0%) |
| 25 to 34 Year Olds | 7 (100.0%) | 0 (0.0%) |
| 35 Years and over | 64 (92.7%) | 5 (7.2%) |
| Total | 567 (89.6%) | 66 (10.4%) |
Educational Attainment by Field of Study in West Hammond
Business (69 | 29.4%), education (49 | 20.8%), liberal arts & history (27 | 11.5%), multidisciplinary studies (23 | 9.8%), and psychology (18 | 7.7%) are the most common fields of study among 235 individuals in West Hammond who have obtained a bachelor's degree or higher.
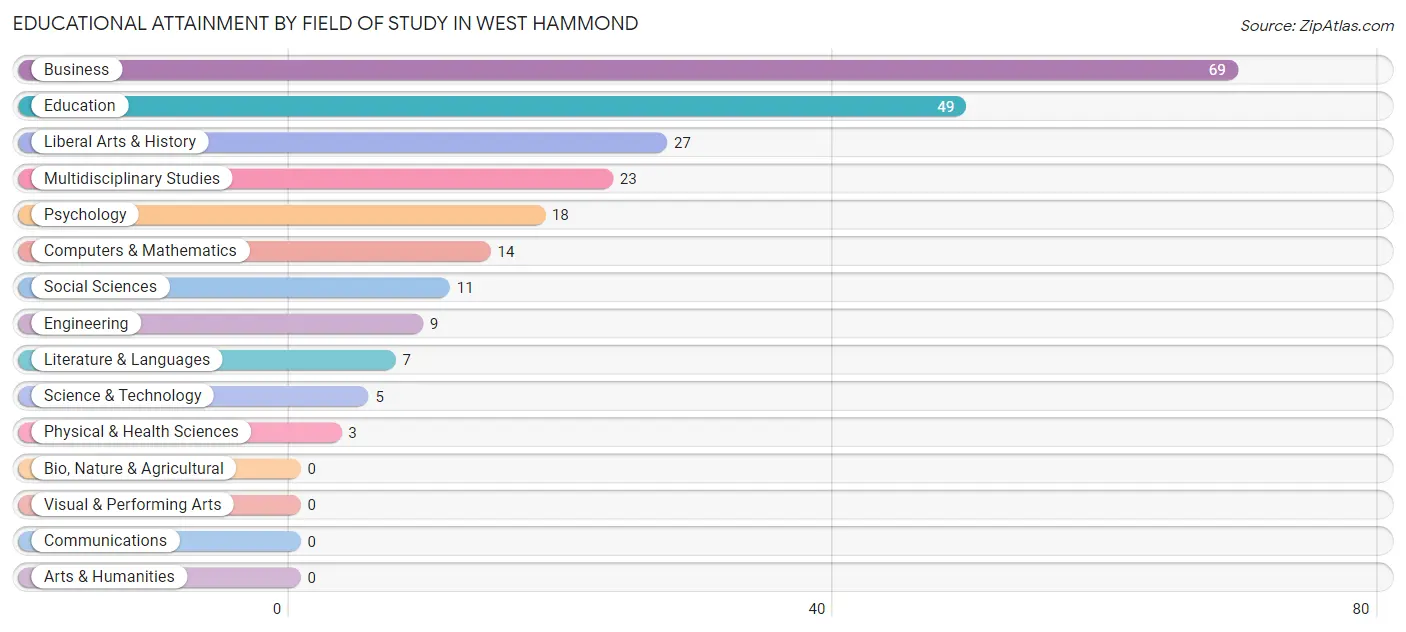
| Field of Study | # Graduates | % Graduates |
| Computers & Mathematics | 14 | 6.0% |
| Bio, Nature & Agricultural | 0 | 0.0% |
| Physical & Health Sciences | 3 | 1.3% |
| Psychology | 18 | 7.7% |
| Social Sciences | 11 | 4.7% |
| Engineering | 9 | 3.8% |
| Multidisciplinary Studies | 23 | 9.8% |
| Science & Technology | 5 | 2.1% |
| Business | 69 | 29.4% |
| Education | 49 | 20.8% |
| Literature & Languages | 7 | 3.0% |
| Liberal Arts & History | 27 | 11.5% |
| Visual & Performing Arts | 0 | 0.0% |
| Communications | 0 | 0.0% |
| Arts & Humanities | 0 | 0.0% |
| Total | 235 | 100.0% |
Transportation & Commute in West Hammond
Vehicle Availability by Sex in West Hammond
The most prevalent vehicle ownership categories in West Hammond are males with 2 vehicles (216, accounting for 41.4%) and females with 2 vehicles (81, making up 58.4%).
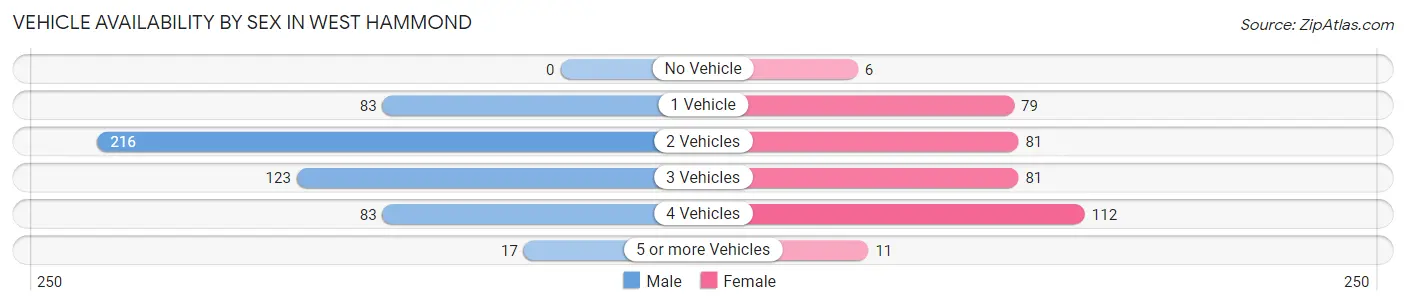
| Vehicles Available | Male | Female |
| No Vehicle | 0 (0.0%) | 6 (1.6%) |
| 1 Vehicle | 83 (15.9%) | 79 (21.3%) |
| 2 Vehicles | 216 (41.4%) | 81 (21.9%) |
| 3 Vehicles | 123 (23.6%) | 81 (21.9%) |
| 4 Vehicles | 83 (15.9%) | 112 (30.3%) |
| 5 or more Vehicles | 17 (3.3%) | 11 (3.0%) |
| Total | 522 (100.0%) | 370 (100.0%) |
Commute Time in West Hammond
The most frequently occuring commute durations in West Hammond are 30 to 34 minutes (178 commuters, 20.8%), 20 to 24 minutes (169 commuters, 19.8%), and 15 to 19 minutes (126 commuters, 14.7%).
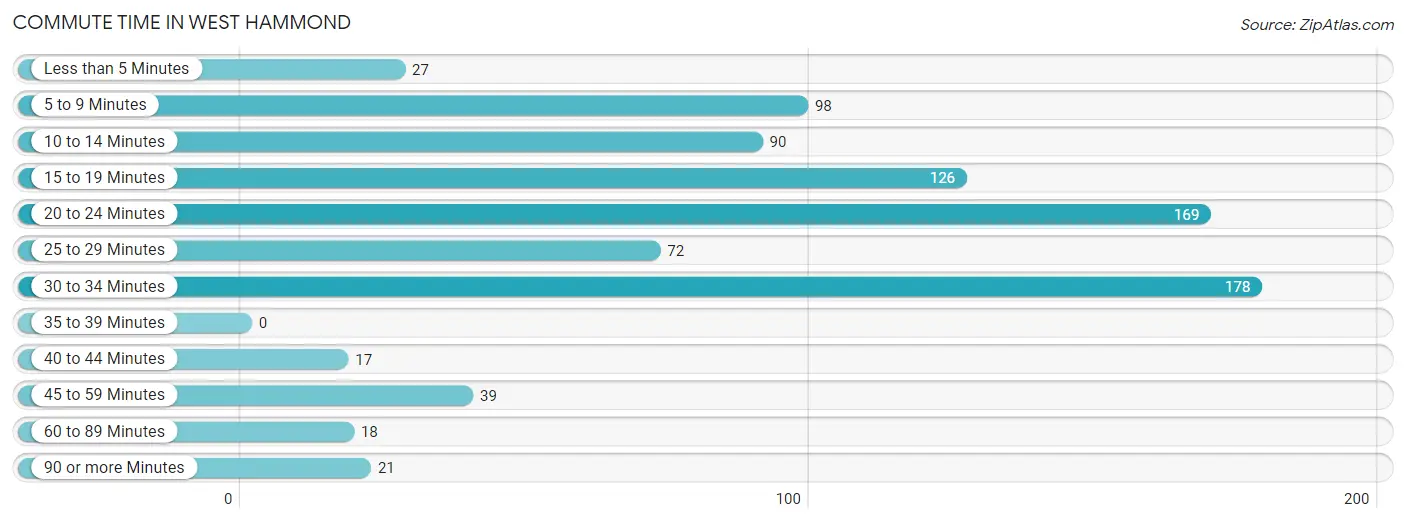
| Commute Time | # Commuters | % Commuters |
| Less than 5 Minutes | 27 | 3.2% |
| 5 to 9 Minutes | 98 | 11.5% |
| 10 to 14 Minutes | 90 | 10.5% |
| 15 to 19 Minutes | 126 | 14.7% |
| 20 to 24 Minutes | 169 | 19.8% |
| 25 to 29 Minutes | 72 | 8.4% |
| 30 to 34 Minutes | 178 | 20.8% |
| 35 to 39 Minutes | 0 | 0.0% |
| 40 to 44 Minutes | 17 | 2.0% |
| 45 to 59 Minutes | 39 | 4.6% |
| 60 to 89 Minutes | 18 | 2.1% |
| 90 or more Minutes | 21 | 2.5% |
Commute Time by Sex in West Hammond
The most common commute times in West Hammond are 30 to 34 minutes (108 commuters, 21.0%) for males and 20 to 24 minutes (90 commuters, 26.3%) for females.
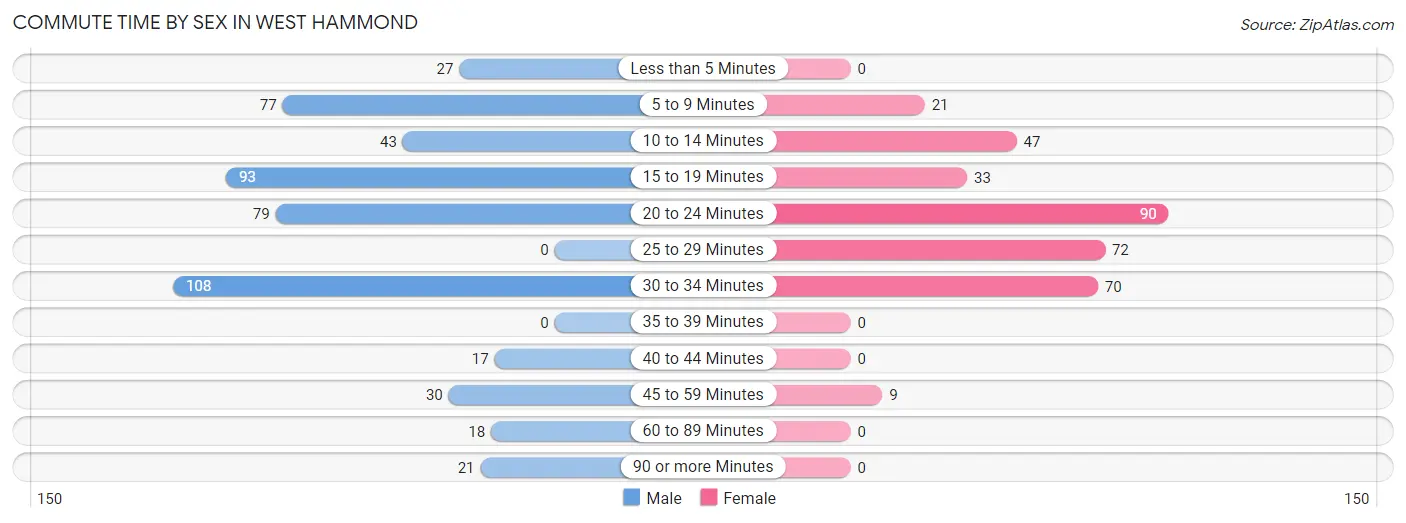
| Commute Time | Male | Female |
| Less than 5 Minutes | 27 (5.3%) | 0 (0.0%) |
| 5 to 9 Minutes | 77 (15.0%) | 21 (6.1%) |
| 10 to 14 Minutes | 43 (8.4%) | 47 (13.7%) |
| 15 to 19 Minutes | 93 (18.1%) | 33 (9.7%) |
| 20 to 24 Minutes | 79 (15.4%) | 90 (26.3%) |
| 25 to 29 Minutes | 0 (0.0%) | 72 (21.0%) |
| 30 to 34 Minutes | 108 (21.0%) | 70 (20.5%) |
| 35 to 39 Minutes | 0 (0.0%) | 0 (0.0%) |
| 40 to 44 Minutes | 17 (3.3%) | 0 (0.0%) |
| 45 to 59 Minutes | 30 (5.9%) | 9 (2.6%) |
| 60 to 89 Minutes | 18 (3.5%) | 0 (0.0%) |
| 90 or more Minutes | 21 (4.1%) | 0 (0.0%) |
Time of Departure to Work by Sex in West Hammond
The most frequent times of departure to work in West Hammond are 7:00 AM to 7:29 AM (134, 26.1%) for males and 7:00 AM to 7:29 AM (134, 39.2%) for females.
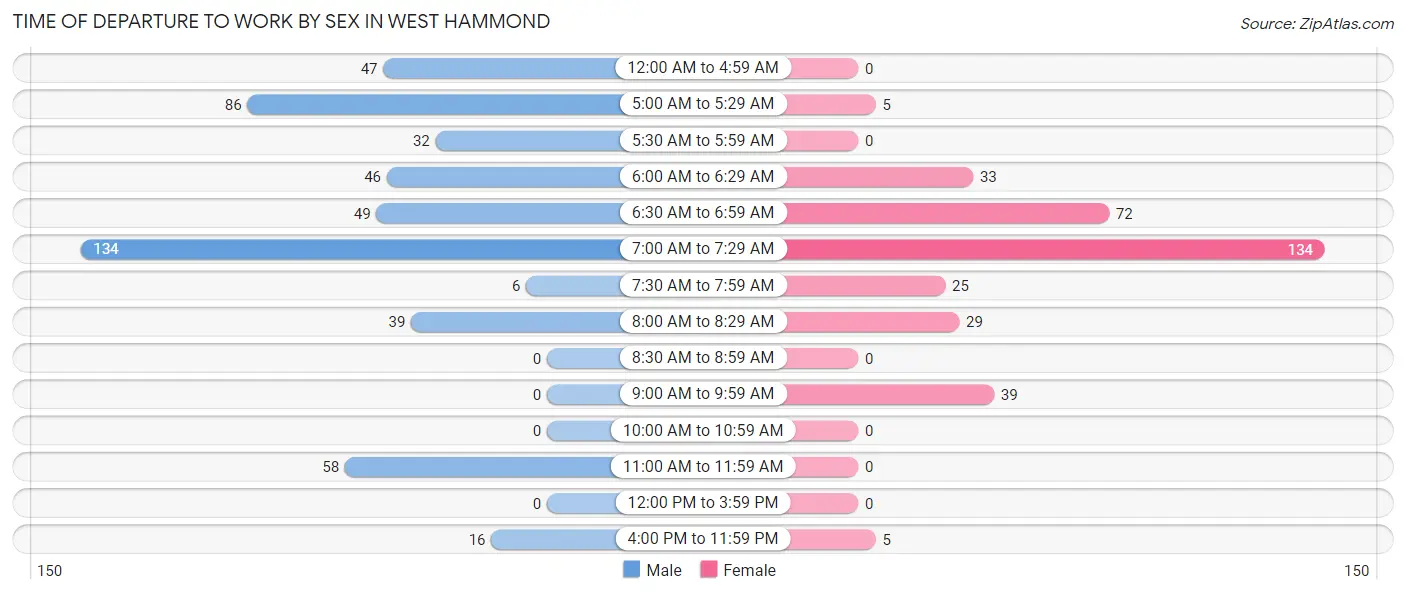
| Time of Departure | Male | Female |
| 12:00 AM to 4:59 AM | 47 (9.2%) | 0 (0.0%) |
| 5:00 AM to 5:29 AM | 86 (16.8%) | 5 (1.5%) |
| 5:30 AM to 5:59 AM | 32 (6.2%) | 0 (0.0%) |
| 6:00 AM to 6:29 AM | 46 (9.0%) | 33 (9.7%) |
| 6:30 AM to 6:59 AM | 49 (9.6%) | 72 (21.0%) |
| 7:00 AM to 7:29 AM | 134 (26.1%) | 134 (39.2%) |
| 7:30 AM to 7:59 AM | 6 (1.2%) | 25 (7.3%) |
| 8:00 AM to 8:29 AM | 39 (7.6%) | 29 (8.5%) |
| 8:30 AM to 8:59 AM | 0 (0.0%) | 0 (0.0%) |
| 9:00 AM to 9:59 AM | 0 (0.0%) | 39 (11.4%) |
| 10:00 AM to 10:59 AM | 0 (0.0%) | 0 (0.0%) |
| 11:00 AM to 11:59 AM | 58 (11.3%) | 0 (0.0%) |
| 12:00 PM to 3:59 PM | 0 (0.0%) | 0 (0.0%) |
| 4:00 PM to 11:59 PM | 16 (3.1%) | 5 (1.5%) |
| Total | 513 (100.0%) | 342 (100.0%) |
Housing Occupancy in West Hammond
Occupancy by Ownership in West Hammond
Of the total 793 dwellings in West Hammond, owner-occupied units account for 711 (89.7%), while renter-occupied units make up 82 (10.3%).
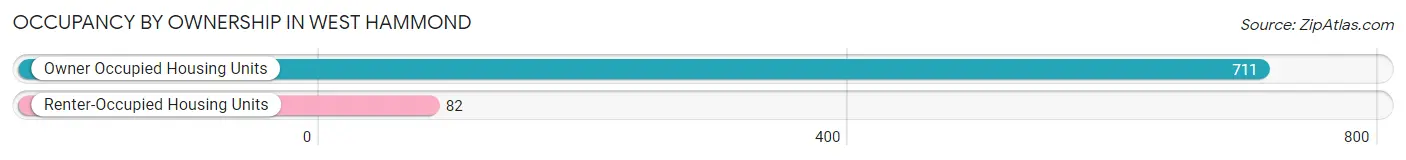
| Occupancy | # Housing Units | % Housing Units |
| Owner Occupied Housing Units | 711 | 89.7% |
| Renter-Occupied Housing Units | 82 | 10.3% |
| Total Occupied Housing Units | 793 | 100.0% |
Occupancy by Household Size in West Hammond
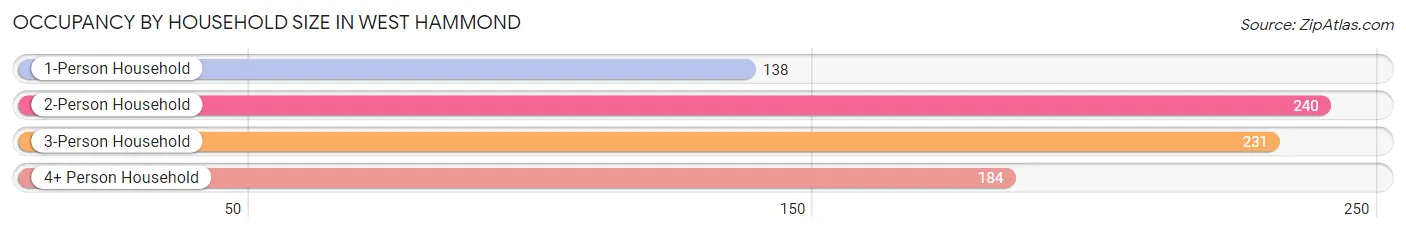
| Household Size | # Housing Units | % Housing Units |
| 1-Person Household | 138 | 17.4% |
| 2-Person Household | 240 | 30.3% |
| 3-Person Household | 231 | 29.1% |
| 4+ Person Household | 184 | 23.2% |
| Total Housing Units | 793 | 100.0% |
Occupancy by Ownership by Household Size in West Hammond
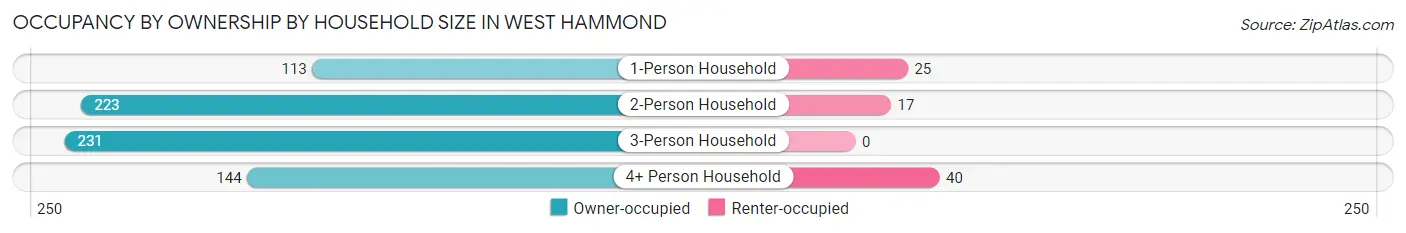
| Household Size | Owner-occupied | Renter-occupied |
| 1-Person Household | 113 (81.9%) | 25 (18.1%) |
| 2-Person Household | 223 (92.9%) | 17 (7.1%) |
| 3-Person Household | 231 (100.0%) | 0 (0.0%) |
| 4+ Person Household | 144 (78.3%) | 40 (21.7%) |
| Total Housing Units | 711 (89.7%) | 82 (10.3%) |
Occupancy by Educational Attainment in West Hammond
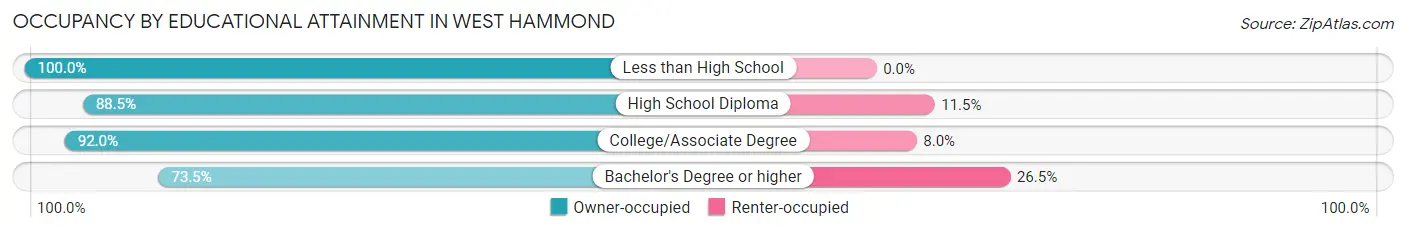
| Household Size | Owner-occupied | Renter-occupied |
| Less than High School | 124 (100.0%) | 0 (0.0%) |
| High School Diploma | 261 (88.5%) | 34 (11.5%) |
| College/Associate Degree | 254 (92.0%) | 22 (8.0%) |
| Bachelor's Degree or higher | 72 (73.5%) | 26 (26.5%) |
Occupancy by Age of Householder in West Hammond
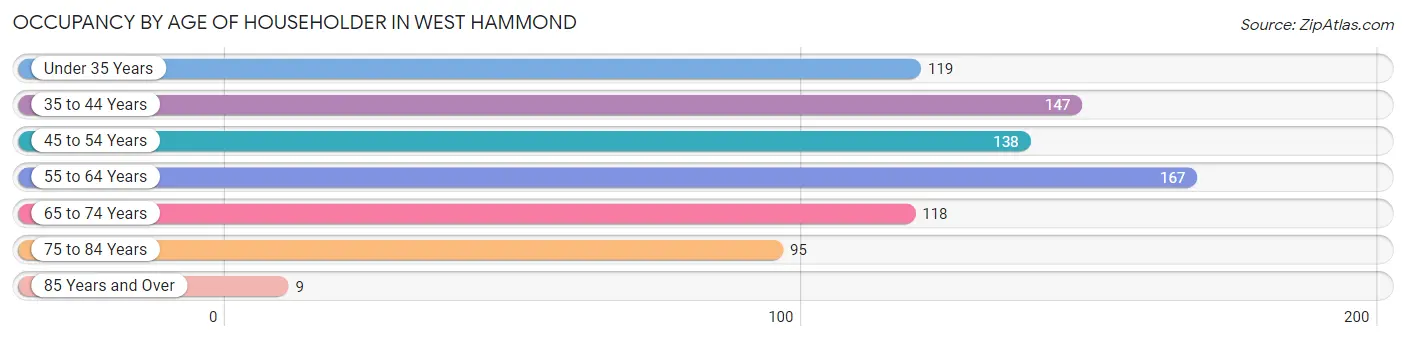
| Age Bracket | # Households | % Households |
| Under 35 Years | 119 | 15.0% |
| 35 to 44 Years | 147 | 18.5% |
| 45 to 54 Years | 138 | 17.4% |
| 55 to 64 Years | 167 | 21.1% |
| 65 to 74 Years | 118 | 14.9% |
| 75 to 84 Years | 95 | 12.0% |
| 85 Years and Over | 9 | 1.1% |
| Total | 793 | 100.0% |
Housing Finances in West Hammond
Median Income by Occupancy in West Hammond
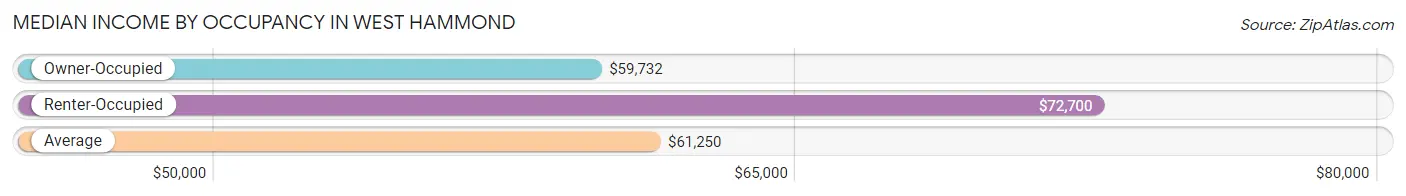
| Occupancy Type | # Households | Median Income |
| Owner-Occupied | 711 (89.7%) | $59,732 |
| Renter-Occupied | 82 (10.3%) | $72,700 |
| Average | 793 (100.0%) | $61,250 |
Occupancy by Householder Income Bracket in West Hammond
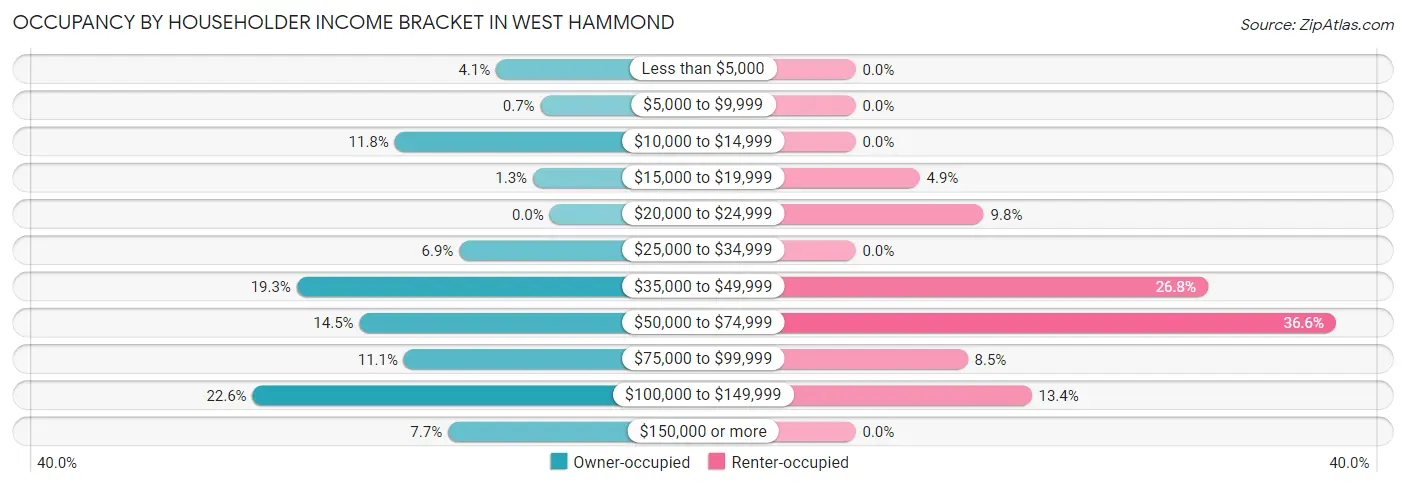
| Income Bracket | Owner-occupied | Renter-occupied |
| Less than $5,000 | 29 (4.1%) | 0 (0.0%) |
| $5,000 to $9,999 | 5 (0.7%) | 0 (0.0%) |
| $10,000 to $14,999 | 84 (11.8%) | 0 (0.0%) |
| $15,000 to $19,999 | 9 (1.3%) | 4 (4.9%) |
| $20,000 to $24,999 | 0 (0.0%) | 8 (9.8%) |
| $25,000 to $34,999 | 49 (6.9%) | 0 (0.0%) |
| $35,000 to $49,999 | 137 (19.3%) | 22 (26.8%) |
| $50,000 to $74,999 | 103 (14.5%) | 30 (36.6%) |
| $75,000 to $99,999 | 79 (11.1%) | 7 (8.5%) |
| $100,000 to $149,999 | 161 (22.6%) | 11 (13.4%) |
| $150,000 or more | 55 (7.7%) | 0 (0.0%) |
| Total | 711 (100.0%) | 82 (100.0%) |
Monthly Housing Cost Tiers in West Hammond
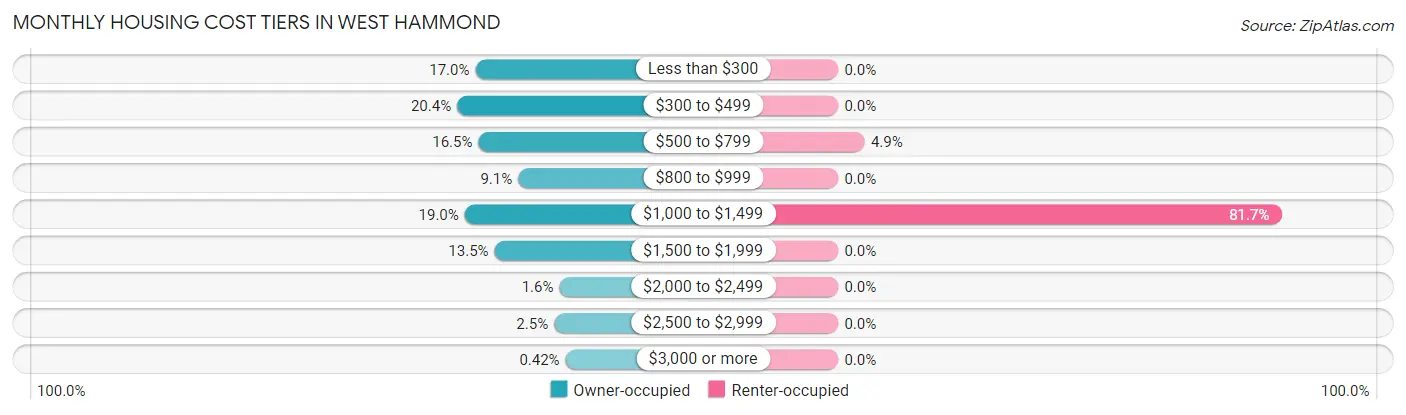
| Monthly Cost | Owner-occupied | Renter-occupied |
| Less than $300 | 121 (17.0%) | 0 (0.0%) |
| $300 to $499 | 145 (20.4%) | 0 (0.0%) |
| $500 to $799 | 117 (16.5%) | 4 (4.9%) |
| $800 to $999 | 65 (9.1%) | 0 (0.0%) |
| $1,000 to $1,499 | 135 (19.0%) | 67 (81.7%) |
| $1,500 to $1,999 | 96 (13.5%) | 0 (0.0%) |
| $2,000 to $2,499 | 11 (1.5%) | 0 (0.0%) |
| $2,500 to $2,999 | 18 (2.5%) | 0 (0.0%) |
| $3,000 or more | 3 (0.4%) | 0 (0.0%) |
| Total | 711 (100.0%) | 82 (100.0%) |
Physical Housing Characteristics in West Hammond
Housing Structures in West Hammond
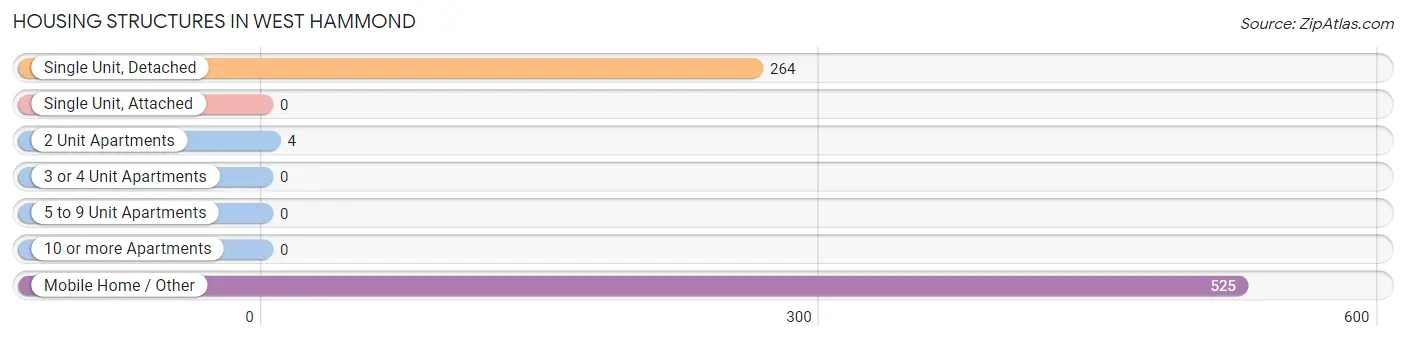
| Structure Type | # Housing Units | % Housing Units |
| Single Unit, Detached | 264 | 33.3% |
| Single Unit, Attached | 0 | 0.0% |
| 2 Unit Apartments | 4 | 0.5% |
| 3 or 4 Unit Apartments | 0 | 0.0% |
| 5 to 9 Unit Apartments | 0 | 0.0% |
| 10 or more Apartments | 0 | 0.0% |
| Mobile Home / Other | 525 | 66.2% |
| Total | 793 | 100.0% |
Housing Structures by Occupancy in West Hammond
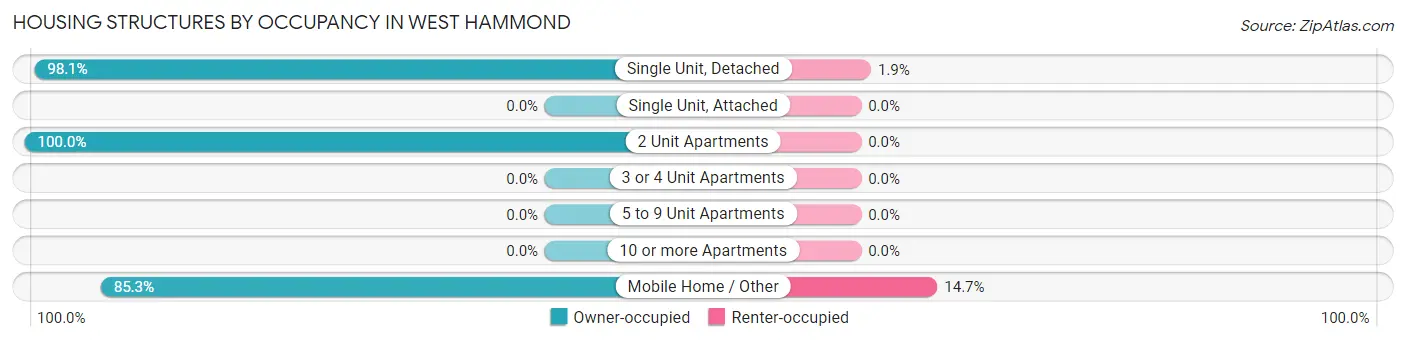
| Structure Type | Owner-occupied | Renter-occupied |
| Single Unit, Detached | 259 (98.1%) | 5 (1.9%) |
| Single Unit, Attached | 0 (0.0%) | 0 (0.0%) |
| 2 Unit Apartments | 4 (100.0%) | 0 (0.0%) |
| 3 or 4 Unit Apartments | 0 (0.0%) | 0 (0.0%) |
| 5 to 9 Unit Apartments | 0 (0.0%) | 0 (0.0%) |
| 10 or more Apartments | 0 (0.0%) | 0 (0.0%) |
| Mobile Home / Other | 448 (85.3%) | 77 (14.7%) |
| Total | 711 (89.7%) | 82 (10.3%) |
Housing Structures by Number of Rooms in West Hammond
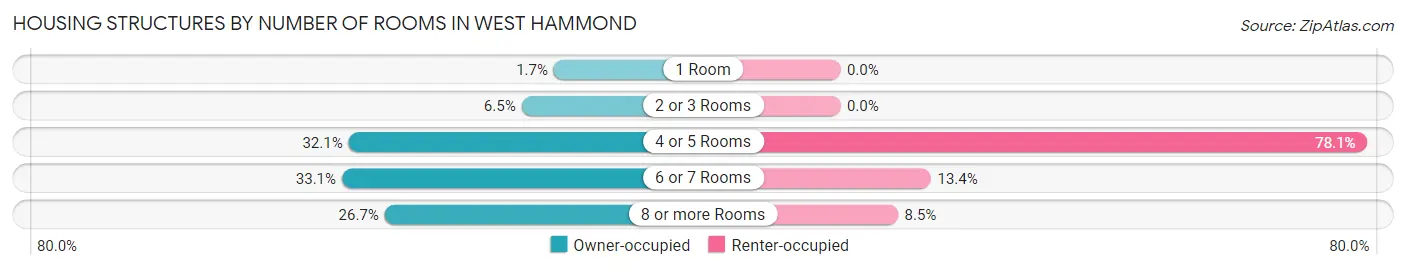
| Number of Rooms | Owner-occupied | Renter-occupied |
| 1 Room | 12 (1.7%) | 0 (0.0%) |
| 2 or 3 Rooms | 46 (6.5%) | 0 (0.0%) |
| 4 or 5 Rooms | 228 (32.1%) | 64 (78.0%) |
| 6 or 7 Rooms | 235 (33.1%) | 11 (13.4%) |
| 8 or more Rooms | 190 (26.7%) | 7 (8.5%) |
| Total | 711 (100.0%) | 82 (100.0%) |
Housing Structure by Heating Type in West Hammond
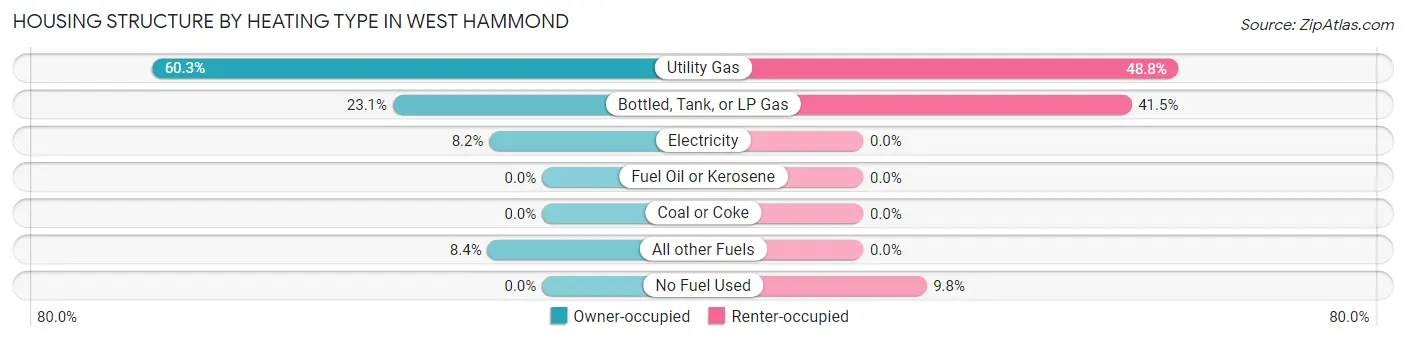
| Heating Type | Owner-occupied | Renter-occupied |
| Utility Gas | 429 (60.3%) | 40 (48.8%) |
| Bottled, Tank, or LP Gas | 164 (23.1%) | 34 (41.5%) |
| Electricity | 58 (8.2%) | 0 (0.0%) |
| Fuel Oil or Kerosene | 0 (0.0%) | 0 (0.0%) |
| Coal or Coke | 0 (0.0%) | 0 (0.0%) |
| All other Fuels | 60 (8.4%) | 0 (0.0%) |
| No Fuel Used | 0 (0.0%) | 8 (9.8%) |
| Total | 711 (100.0%) | 82 (100.0%) |
Household Vehicle Usage in West Hammond
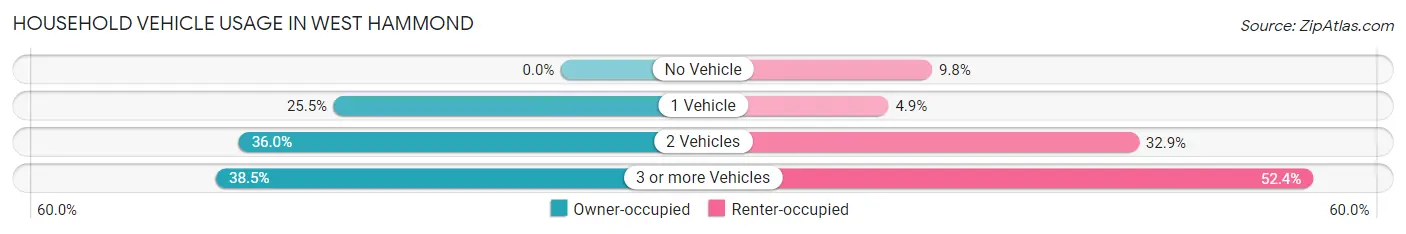
| Vehicles per Household | Owner-occupied | Renter-occupied |
| No Vehicle | 0 (0.0%) | 8 (9.8%) |
| 1 Vehicle | 181 (25.5%) | 4 (4.9%) |
| 2 Vehicles | 256 (36.0%) | 27 (32.9%) |
| 3 or more Vehicles | 274 (38.5%) | 43 (52.4%) |
| Total | 711 (100.0%) | 82 (100.0%) |
Real Estate & Mortgages in West Hammond
Real Estate and Mortgage Overview in West Hammond
| Characteristic | Without Mortgage | With Mortgage |
| Housing Units | 381 | 330 |
| Median Property Value | $165,100 | $196,900 |
| Median Household Income | $40,795 | $30 |
| Monthly Housing Costs | $425 | $3 |
| Real Estate Taxes | $1,156 | $57 |
Property Value by Mortgage Status in West Hammond
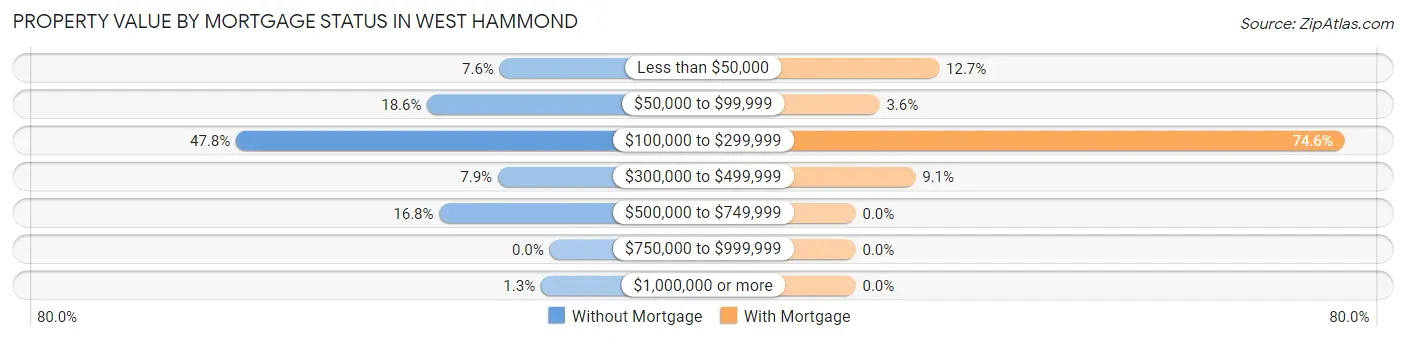
| Property Value | Without Mortgage | With Mortgage |
| Less than $50,000 | 29 (7.6%) | 42 (12.7%) |
| $50,000 to $99,999 | 71 (18.6%) | 12 (3.6%) |
| $100,000 to $299,999 | 182 (47.8%) | 246 (74.6%) |
| $300,000 to $499,999 | 30 (7.9%) | 30 (9.1%) |
| $500,000 to $749,999 | 64 (16.8%) | 0 (0.0%) |
| $750,000 to $999,999 | 0 (0.0%) | 0 (0.0%) |
| $1,000,000 or more | 5 (1.3%) | 0 (0.0%) |
| Total | 381 (100.0%) | 330 (100.0%) |
Household Income by Mortgage Status in West Hammond
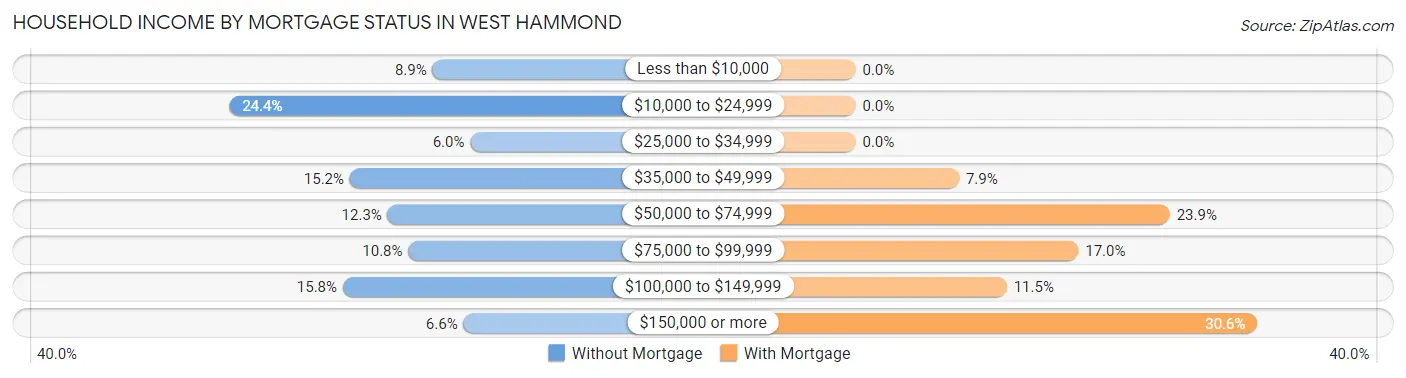
| Household Income | Without Mortgage | With Mortgage |
| Less than $10,000 | 34 (8.9%) | 0 (0.0%) |
| $10,000 to $24,999 | 93 (24.4%) | 0 (0.0%) |
| $25,000 to $34,999 | 23 (6.0%) | 0 (0.0%) |
| $35,000 to $49,999 | 58 (15.2%) | 26 (7.9%) |
| $50,000 to $74,999 | 47 (12.3%) | 79 (23.9%) |
| $75,000 to $99,999 | 41 (10.8%) | 56 (17.0%) |
| $100,000 to $149,999 | 60 (15.8%) | 38 (11.5%) |
| $150,000 or more | 25 (6.6%) | 101 (30.6%) |
| Total | 381 (100.0%) | 330 (100.0%) |
Property Value to Household Income Ratio in West Hammond
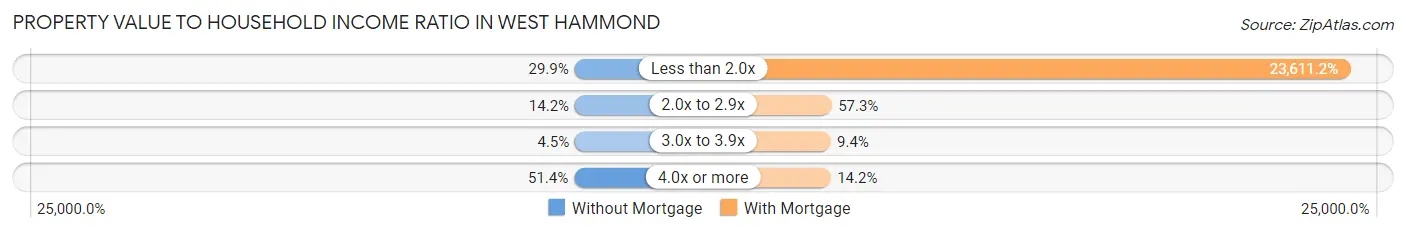
| Value-to-Income Ratio | Without Mortgage | With Mortgage |
| Less than 2.0x | 114 (29.9%) | 77,917 (23,611.2%) |
| 2.0x to 2.9x | 54 (14.2%) | 189 (57.3%) |
| 3.0x to 3.9x | 17 (4.5%) | 31 (9.4%) |
| 4.0x or more | 196 (51.4%) | 47 (14.2%) |
| Total | 381 (100.0%) | 330 (100.0%) |
Real Estate Taxes by Mortgage Status in West Hammond
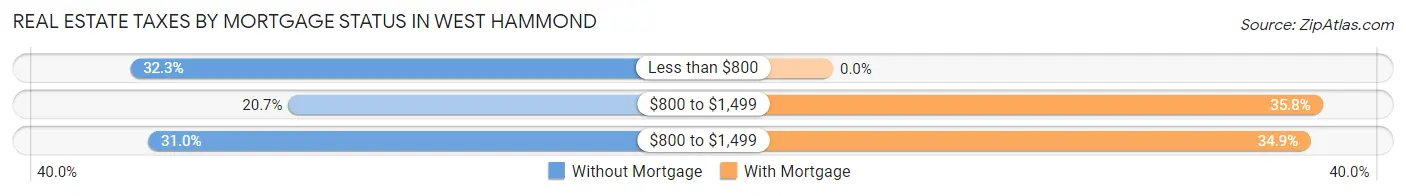
| Property Taxes | Without Mortgage | With Mortgage |
| Less than $800 | 123 (32.3%) | 0 (0.0%) |
| $800 to $1,499 | 79 (20.7%) | 118 (35.8%) |
| $800 to $1,499 | 118 (31.0%) | 115 (34.8%) |
| Total | 381 (100.0%) | 330 (100.0%) |
Health & Disability in West Hammond
Health Insurance Coverage by Age in West Hammond
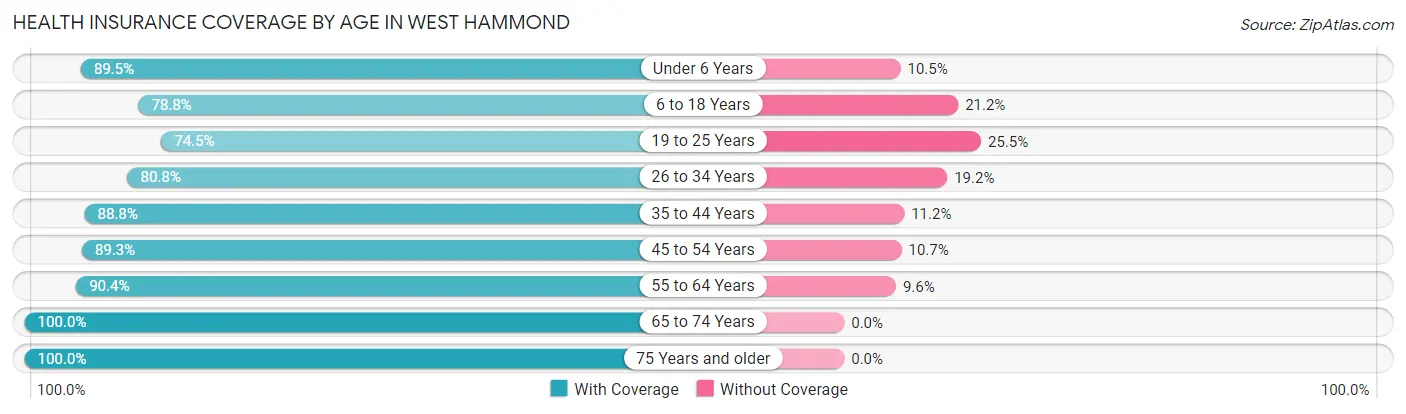
| Age Bracket | With Coverage | Without Coverage |
| Under 6 Years | 145 (89.5%) | 17 (10.5%) |
| 6 to 18 Years | 382 (78.8%) | 103 (21.2%) |
| 19 to 25 Years | 149 (74.5%) | 51 (25.5%) |
| 26 to 34 Years | 202 (80.8%) | 48 (19.2%) |
| 35 to 44 Years | 270 (88.8%) | 34 (11.2%) |
| 45 to 54 Years | 209 (89.3%) | 25 (10.7%) |
| 55 to 64 Years | 291 (90.4%) | 31 (9.6%) |
| 65 to 74 Years | 271 (100.0%) | 0 (0.0%) |
| 75 Years and older | 176 (100.0%) | 0 (0.0%) |
| Total | 2,095 (87.2%) | 309 (12.9%) |
Health Insurance Coverage by Citizenship Status in West Hammond
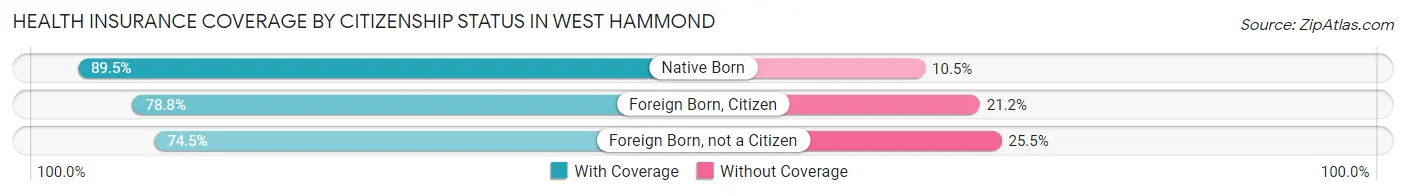
| Citizenship Status | With Coverage | Without Coverage |
| Native Born | 145 (89.5%) | 17 (10.5%) |
| Foreign Born, Citizen | 382 (78.8%) | 103 (21.2%) |
| Foreign Born, not a Citizen | 149 (74.5%) | 51 (25.5%) |
Health Insurance Coverage by Household Income in West Hammond
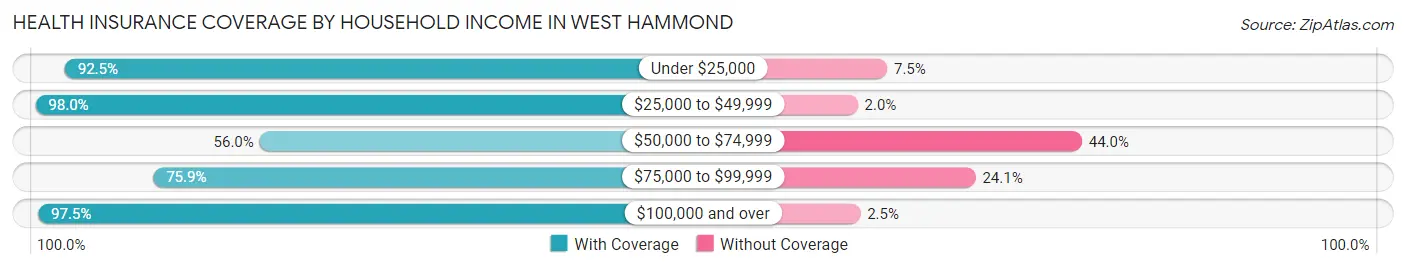
| Household Income | With Coverage | Without Coverage |
| Under $25,000 | 233 (92.5%) | 19 (7.5%) |
| $25,000 to $49,999 | 724 (98.0%) | 15 (2.0%) |
| $50,000 to $74,999 | 225 (56.0%) | 177 (44.0%) |
| $75,000 to $99,999 | 255 (75.9%) | 81 (24.1%) |
| $100,000 and over | 658 (97.5%) | 17 (2.5%) |
Public vs Private Health Insurance Coverage by Age in West Hammond
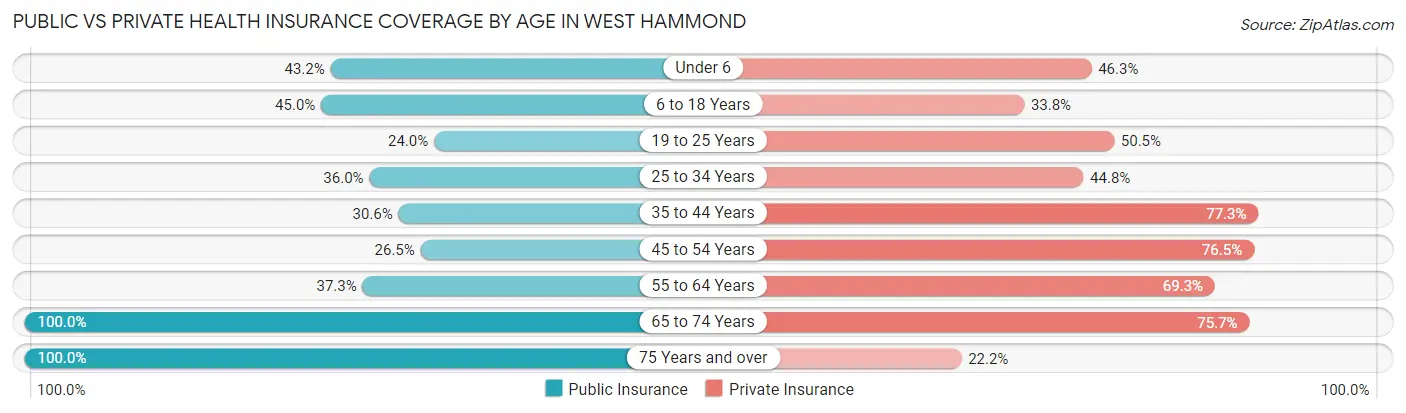
| Age Bracket | Public Insurance | Private Insurance |
| Under 6 | 70 (43.2%) | 75 (46.3%) |
| 6 to 18 Years | 218 (45.0%) | 164 (33.8%) |
| 19 to 25 Years | 48 (24.0%) | 101 (50.5%) |
| 25 to 34 Years | 90 (36.0%) | 112 (44.8%) |
| 35 to 44 Years | 93 (30.6%) | 235 (77.3%) |
| 45 to 54 Years | 62 (26.5%) | 179 (76.5%) |
| 55 to 64 Years | 120 (37.3%) | 223 (69.3%) |
| 65 to 74 Years | 271 (100.0%) | 205 (75.6%) |
| 75 Years and over | 176 (100.0%) | 39 (22.2%) |
| Total | 1,148 (47.7%) | 1,333 (55.4%) |
Disability Status by Sex by Age in West Hammond
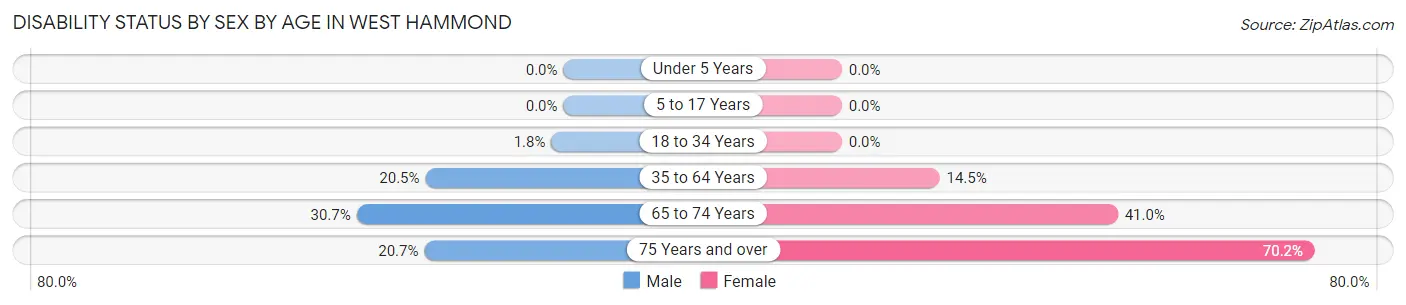
| Age Bracket | Male | Female |
| Under 5 Years | 0 (0.0%) | 0 (0.0%) |
| 5 to 17 Years | 0 (0.0%) | 0 (0.0%) |
| 18 to 34 Years | 4 (1.8%) | 0 (0.0%) |
| 35 to 64 Years | 100 (20.5%) | 54 (14.5%) |
| 65 to 74 Years | 39 (30.7%) | 59 (41.0%) |
| 75 Years and over | 19 (20.6%) | 59 (70.2%) |
Disability Class by Sex by Age in West Hammond
Disability Class: Hearing Difficulty
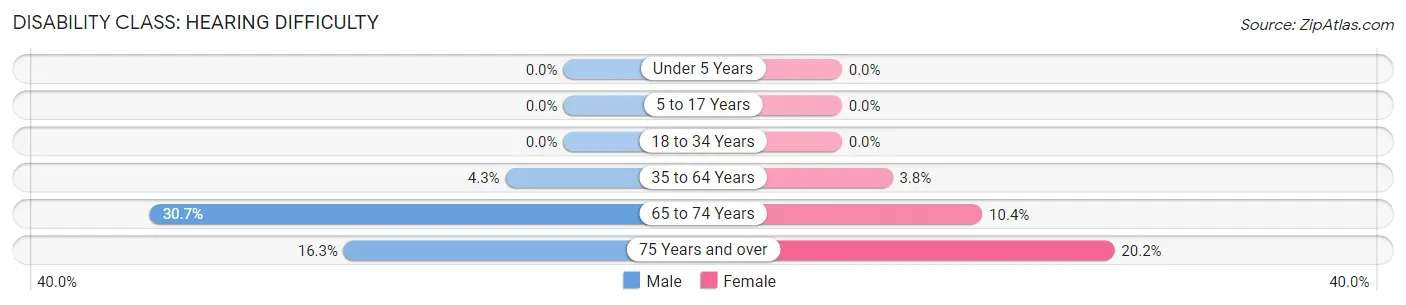
| Age Bracket | Male | Female |
| Under 5 Years | 0 (0.0%) | 0 (0.0%) |
| 5 to 17 Years | 0 (0.0%) | 0 (0.0%) |
| 18 to 34 Years | 0 (0.0%) | 0 (0.0%) |
| 35 to 64 Years | 21 (4.3%) | 14 (3.8%) |
| 65 to 74 Years | 39 (30.7%) | 15 (10.4%) |
| 75 Years and over | 15 (16.3%) | 17 (20.2%) |
Disability Class: Vision Difficulty
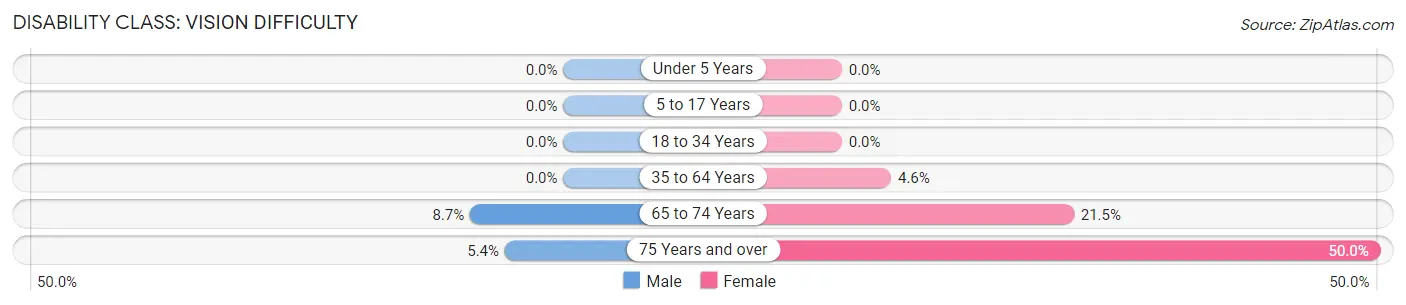
| Age Bracket | Male | Female |
| Under 5 Years | 0 (0.0%) | 0 (0.0%) |
| 5 to 17 Years | 0 (0.0%) | 0 (0.0%) |
| 18 to 34 Years | 0 (0.0%) | 0 (0.0%) |
| 35 to 64 Years | 0 (0.0%) | 17 (4.6%) |
| 65 to 74 Years | 11 (8.7%) | 31 (21.5%) |
| 75 Years and over | 5 (5.4%) | 42 (50.0%) |
Disability Class: Cognitive Difficulty
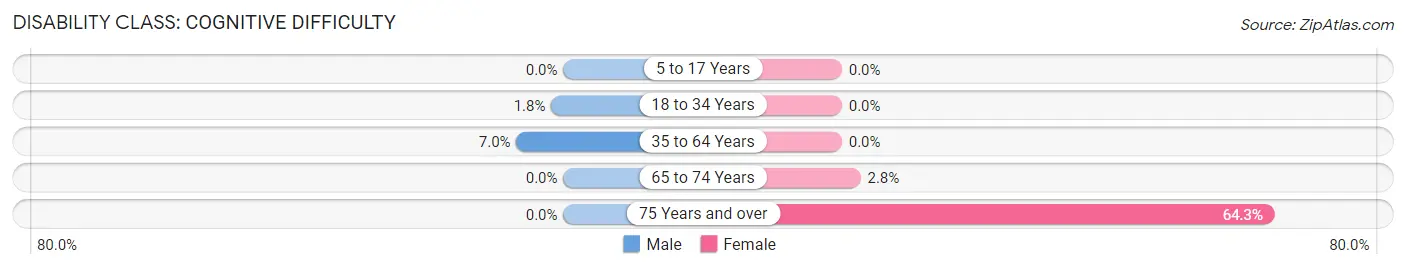
| Age Bracket | Male | Female |
| 5 to 17 Years | 0 (0.0%) | 0 (0.0%) |
| 18 to 34 Years | 4 (1.8%) | 0 (0.0%) |
| 35 to 64 Years | 34 (7.0%) | 0 (0.0%) |
| 65 to 74 Years | 0 (0.0%) | 4 (2.8%) |
| 75 Years and over | 0 (0.0%) | 54 (64.3%) |
Disability Class: Ambulatory Difficulty
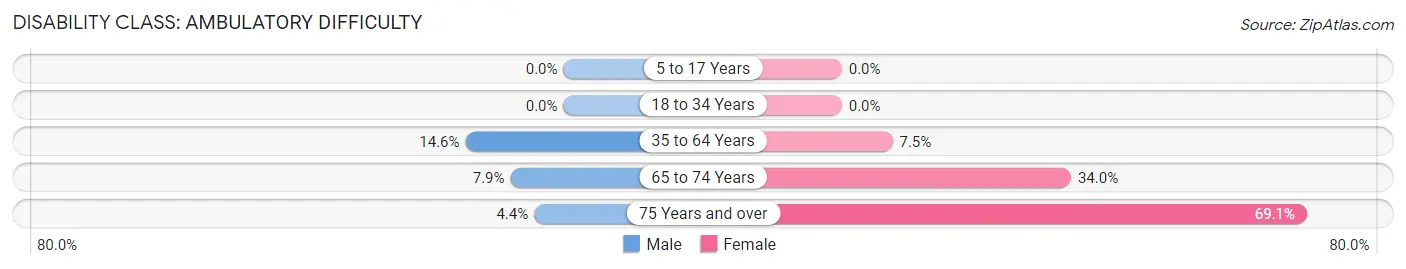
| Age Bracket | Male | Female |
| 5 to 17 Years | 0 (0.0%) | 0 (0.0%) |
| 18 to 34 Years | 0 (0.0%) | 0 (0.0%) |
| 35 to 64 Years | 71 (14.5%) | 28 (7.5%) |
| 65 to 74 Years | 10 (7.9%) | 49 (34.0%) |
| 75 Years and over | 4 (4.3%) | 58 (69.1%) |
Disability Class: Self-Care Difficulty
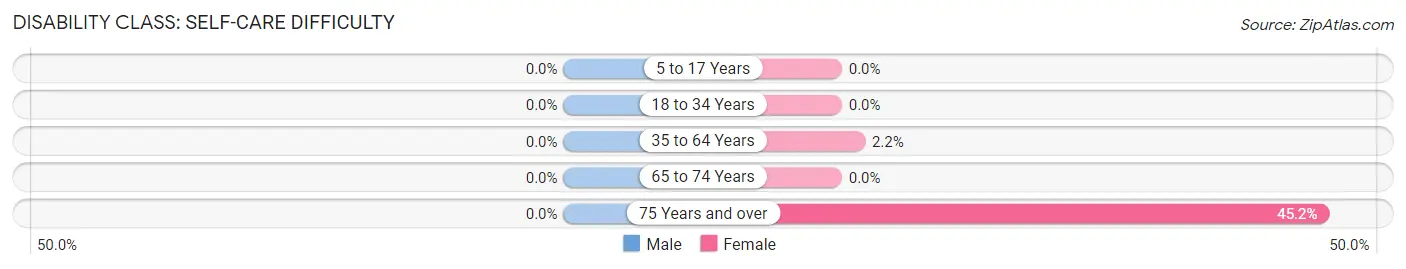
| Age Bracket | Male | Female |
| 5 to 17 Years | 0 (0.0%) | 0 (0.0%) |
| 18 to 34 Years | 0 (0.0%) | 0 (0.0%) |
| 35 to 64 Years | 0 (0.0%) | 8 (2.1%) |
| 65 to 74 Years | 0 (0.0%) | 0 (0.0%) |
| 75 Years and over | 0 (0.0%) | 38 (45.2%) |
Technology Access in West Hammond
Computing Device Access in West Hammond
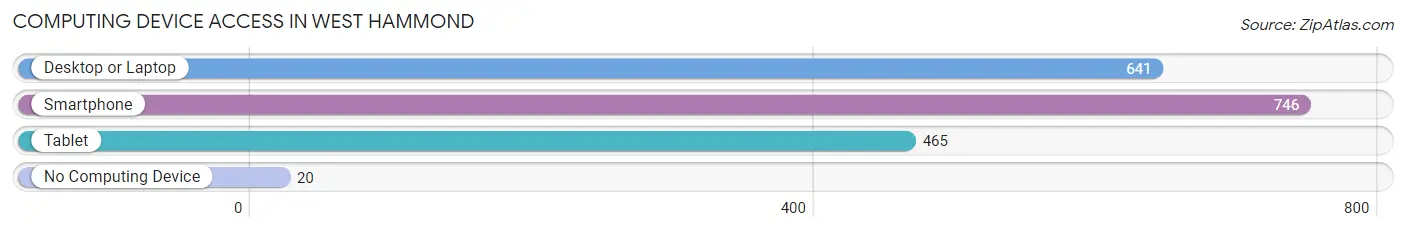
| Device Type | # Households | % Households |
| Desktop or Laptop | 641 | 80.8% |
| Smartphone | 746 | 94.1% |
| Tablet | 465 | 58.6% |
| No Computing Device | 20 | 2.5% |
| Total | 793 | 100.0% |
Internet Access in West Hammond
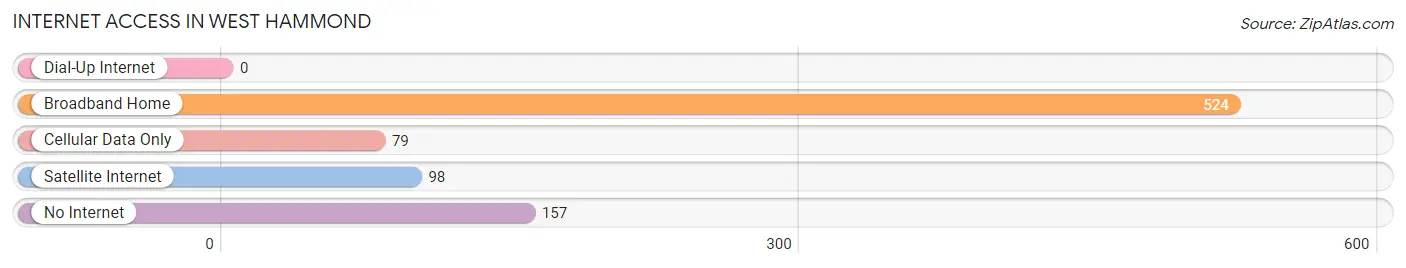
| Internet Type | # Households | % Households |
| Dial-Up Internet | 0 | 0.0% |
| Broadband Home | 524 | 66.1% |
| Cellular Data Only | 79 | 10.0% |
| Satellite Internet | 98 | 12.4% |
| No Internet | 157 | 19.8% |
| Total | 793 | 100.0% |
West Hammond Summary
Hammond, New Mexico is a small town located in the southeastern corner of the state. It is situated in the foothills of the Sangre de Cristo Mountains, and is part of the larger San Miguel County. The town was founded in 1881 by a group of settlers from the nearby town of Las Vegas, and was named after the first postmaster, William Hammond.
History
The area around Hammond was first settled by Native Americans, including the Apache, Navajo, and Ute tribes. The first Europeans to arrive in the area were Spanish explorers, who arrived in the late 1700s. The area was later settled by American settlers in the mid-1800s, and the town of Hammond was founded in 1881.
The town was originally a farming and ranching community, and the main industry was sheep and cattle ranching. The town also had a small sawmill, which provided lumber for the local area. In the early 1900s, the town began to grow, and a school and post office were established.
In the 1920s, the town began to experience a period of growth, and several businesses were established, including a bank, a hotel, and a movie theater. The town also had a newspaper, the Hammond Herald, which was published from 1921 to 1932.
In the 1940s, the town experienced a period of decline, as many of the businesses closed and the population decreased. However, in the 1950s, the town began to experience a period of growth, and several new businesses were established.
Geography
Hammond is located in the southeastern corner of New Mexico, in the foothills of the Sangre de Cristo Mountains. The town is situated at an elevation of 6,000 feet, and is surrounded by rolling hills and mountains. The town is located approximately 25 miles from the city of Las Vegas, and is about an hour and a half drive from Santa Fe.
The climate in Hammond is semi-arid, with hot summers and cold winters. The average annual temperature is around 50 degrees Fahrenheit, and the average annual precipitation is around 12 inches.
Economy
The economy of Hammond is largely based on agriculture and tourism. The town is home to several farms and ranches, which produce a variety of crops, including alfalfa, hay, and wheat. The town is also home to several tourist attractions, including the Hammond Museum, which features a variety of artifacts from the town’s history.
The town is also home to several small businesses, including restaurants, shops, and a gas station. The town is also home to a small airport, which serves the local area.
Demographics
As of the 2010 census, the population of Hammond was 1,845. The racial makeup of the town was 94.3% White, 0.7% African American, 0.7% Native American, 0.3% Asian, 0.1% Pacific Islander, and 3.0% from other races. The median household income was $31,250, and the median family income was $37,500.
Conclusion
Hammond, New Mexico is a small town located in the southeastern corner of the state. It is situated in the foothills of the Sangre de Cristo Mountains, and is part of the larger San Miguel County. The town was founded in 1881 by a group of settlers from the nearby town of Las Vegas, and was named after the first postmaster, William Hammond. The economy of Hammond is largely based on agriculture and tourism, and the town is home to several farms and ranches, as well as several tourist attractions. The population of Hammond was 1,845 as of the 2010 census, and the median household income was $31,250.
Common Questions
What is Per Capita Income in West Hammond?
Per Capita income in West Hammond is $26,305.
What is the Median Family Income in West Hammond?
Median Family Income in West Hammond is $59,881.
What is the Median Household income in West Hammond?
Median Household Income in West Hammond is $61,250.
What is Income or Wage Gap in West Hammond?
Income or Wage Gap in West Hammond is 7.0%.
Women in West Hammond earn 93.0 cents for every dollar earned by a man.
What is Inequality or Gini Index in West Hammond?
Inequality or Gini Index in West Hammond is 0.41.
What is the Total Population of West Hammond?
Total Population of West Hammond is 2,410.
What is the Total Male Population of West Hammond?
Total Male Population of West Hammond is 1,287.
What is the Total Female Population of West Hammond?
Total Female Population of West Hammond is 1,123.
What is the Ratio of Males per 100 Females in West Hammond?
There are 114.60 Males per 100 Females in West Hammond.
What is the Ratio of Females per 100 Males in West Hammond?
There are 87.26 Females per 100 Males in West Hammond.
What is the Median Population Age in West Hammond?
Median Population Age in West Hammond is 39.6 Years.
What is the Average Family Size in West Hammond
Average Family Size in West Hammond is 3.3 People.
What is the Average Household Size in West Hammond
Average Household Size in West Hammond is 3.0 People.
How Large is the Labor Force in West Hammond?
There are 981 People in the Labor Forcein in West Hammond.
What is the Percentage of People in the Labor Force in West Hammond?
51.8% of People are in the Labor Force in West Hammond.
What is the Unemployment Rate in West Hammond?
Unemployment Rate in West Hammond is 8.6%.