Chamisal, NM Map & Demographics
Chamisal Map
Chamisal Overview
$32,066
PER CAPITA INCOME
$71,250
AVG FAMILY INCOME
$34,875
AVG HOUSEHOLD INCOME
18.6%
WAGE / INCOME GAP [ % ]
81.4¢/ $1
WAGE / INCOME GAP [ $ ]
0.48
INEQUALITY / GINI INDEX
358
TOTAL POPULATION
222
MALE POPULATION
136
FEMALE POPULATION
163.24
MALES / 100 FEMALES
61.26
FEMALES / 100 MALES
40.9
MEDIAN AGE
4.1
AVG FAMILY SIZE
2.9
AVG HOUSEHOLD SIZE
159
LABOR FORCE [ PEOPLE ]
51.6%
PERCENT IN LABOR FORCE
1.3%
UNEMPLOYMENT RATE
Chamisal Zip Codes
Chamisal Area Codes
Income in Chamisal
Income Overview in Chamisal
Per Capita Income in Chamisal is $32,066, while median incomes of families and households are $71,250 and $34,875 respectively.
| Characteristic | Number | Measure |
| Per Capita Income | 358 | $32,066 |
| Median Family Income | 68 | $71,250 |
| Mean Family Income | 68 | $77,712 |
| Median Household Income | 125 | $34,875 |
| Mean Household Income | 125 | $58,668 |
| Income Deficit | 68 | $0 |
| Wage / Income Gap (%) | 358 | 18.62% |
| Wage / Income Gap ($) | 358 | 81.38¢ per $1 |
| Gini / Inequality Index | 358 | 0.48 |
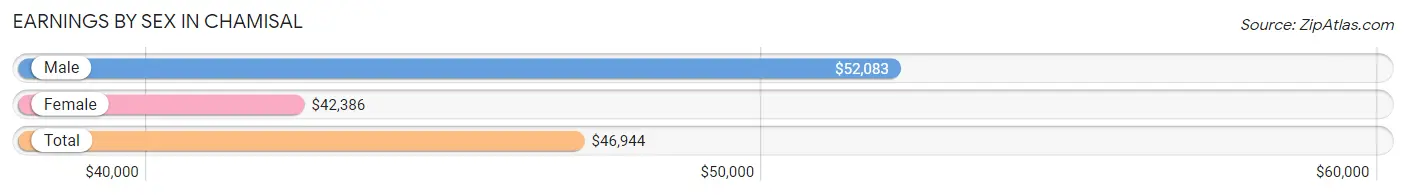
Earnings by Sex in Chamisal
Average Earnings in Chamisal are $46,944, $52,083 for men and $42,386 for women, a difference of 18.6%.
| Sex | Number | Average Earnings |
| Male | 99 (61.9%) | $52,083 |
| Female | 61 (38.1%) | $42,386 |
| Total | 160 (100.0%) | $46,944 |
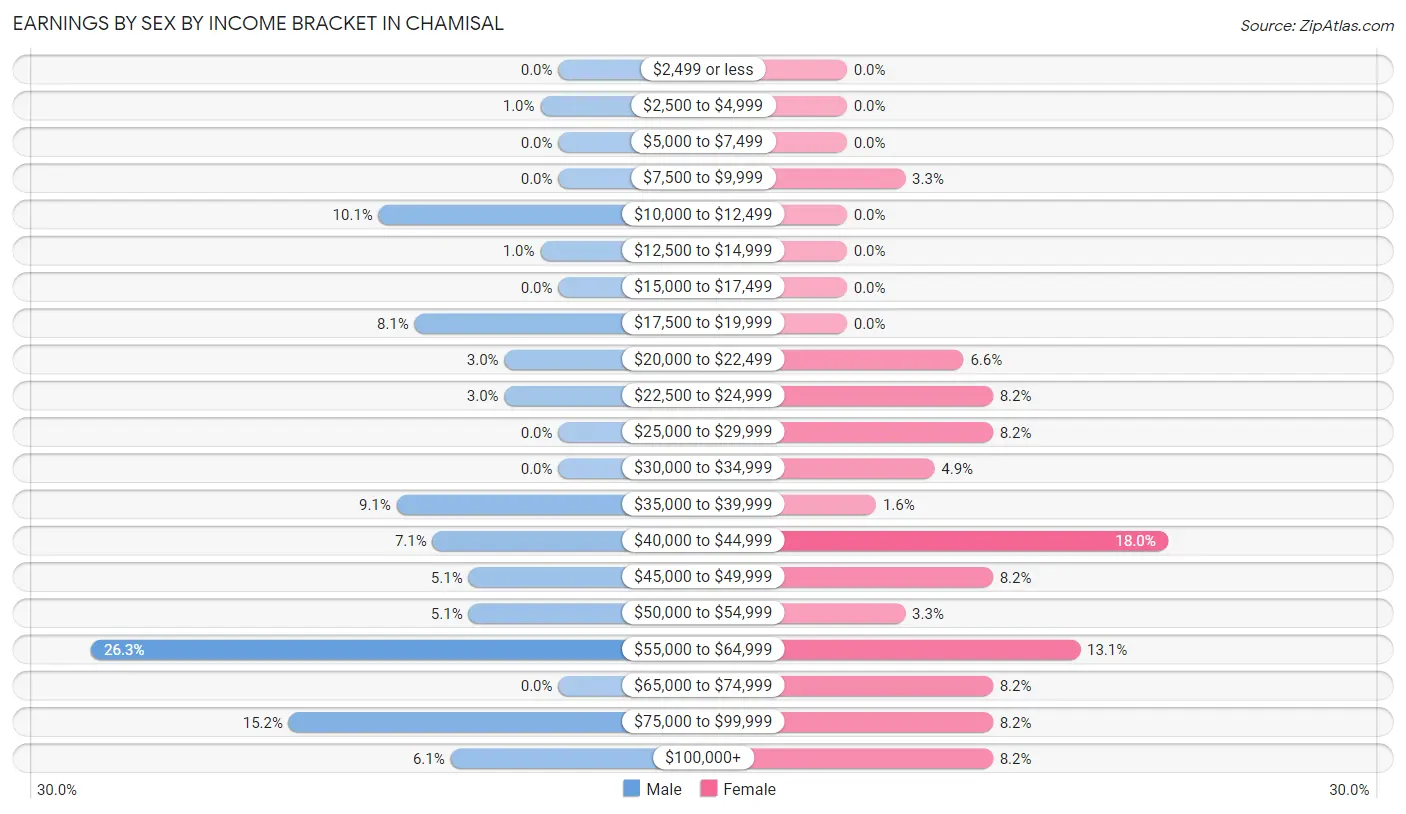
Earnings by Sex by Income Bracket in Chamisal
The most common earnings brackets in Chamisal are $55,000 to $64,999 for men (26 | 26.3%) and $40,000 to $44,999 for women (11 | 18.0%).
| Income | Male | Female |
| $2,499 or less | 0 (0.0%) | 0 (0.0%) |
| $2,500 to $4,999 | 1 (1.0%) | 0 (0.0%) |
| $5,000 to $7,499 | 0 (0.0%) | 0 (0.0%) |
| $7,500 to $9,999 | 0 (0.0%) | 2 (3.3%) |
| $10,000 to $12,499 | 10 (10.1%) | 0 (0.0%) |
| $12,500 to $14,999 | 1 (1.0%) | 0 (0.0%) |
| $15,000 to $17,499 | 0 (0.0%) | 0 (0.0%) |
| $17,500 to $19,999 | 8 (8.1%) | 0 (0.0%) |
| $20,000 to $22,499 | 3 (3.0%) | 4 (6.6%) |
| $22,500 to $24,999 | 3 (3.0%) | 5 (8.2%) |
| $25,000 to $29,999 | 0 (0.0%) | 5 (8.2%) |
| $30,000 to $34,999 | 0 (0.0%) | 3 (4.9%) |
| $35,000 to $39,999 | 9 (9.1%) | 1 (1.6%) |
| $40,000 to $44,999 | 7 (7.1%) | 11 (18.0%) |
| $45,000 to $49,999 | 5 (5.1%) | 5 (8.2%) |
| $50,000 to $54,999 | 5 (5.1%) | 2 (3.3%) |
| $55,000 to $64,999 | 26 (26.3%) | 8 (13.1%) |
| $65,000 to $74,999 | 0 (0.0%) | 5 (8.2%) |
| $75,000 to $99,999 | 15 (15.1%) | 5 (8.2%) |
| $100,000+ | 6 (6.1%) | 5 (8.2%) |
| Total | 99 (100.0%) | 61 (100.0%) |
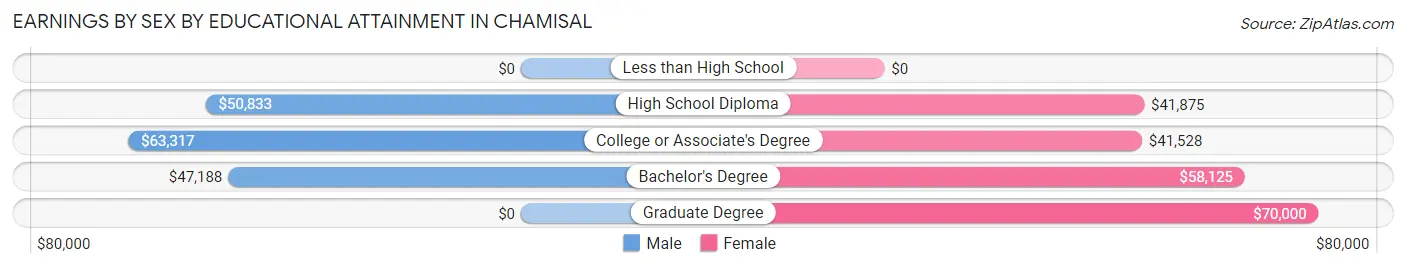
Earnings by Sex by Educational Attainment in Chamisal
Average earnings in Chamisal are $63,029 for men and $42,159 for women, a difference of 33.1%. Men with an educational attainment of college or associate's degree enjoy the highest average annual earnings of $63,317, while those with bachelor's degree education earn the least with $47,188. Women with an educational attainment of graduate degree earn the most with the average annual earnings of $70,000, while those with college or associate's degree education have the smallest earnings of $41,528.
| Educational Attainment | Male Income | Female Income |
| Less than High School | - | - |
| High School Diploma | $50,833 | $41,875 |
| College or Associate's Degree | $63,317 | $41,528 |
| Bachelor's Degree | $47,188 | $58,125 |
| Graduate Degree | - | - |
| Total | $63,029 | $42,159 |
Family Income in Chamisal
Family Income Brackets in Chamisal
According to the Chamisal family income data, there are 15 families falling into the $75,000 to $99,999 income range, which is the most common income bracket and makes up 22.1% of all families. Conversely, the $200,000+ income bracket is the least frequent group with only 1 families (1.5%) belonging to this category.
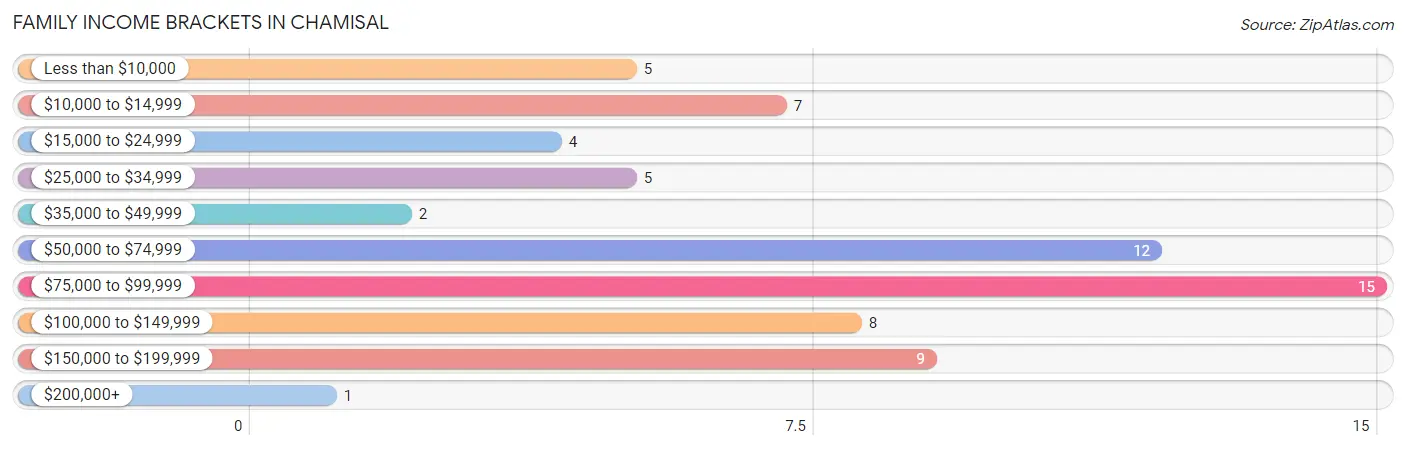
| Income Bracket | # Families | % Families |
| Less than $10,000 | 5 | 7.4% |
| $10,000 to $14,999 | 7 | 10.3% |
| $15,000 to $24,999 | 4 | 5.9% |
| $25,000 to $34,999 | 5 | 7.4% |
| $35,000 to $49,999 | 2 | 2.9% |
| $50,000 to $74,999 | 12 | 17.6% |
| $75,000 to $99,999 | 15 | 22.1% |
| $100,000 to $149,999 | 8 | 11.8% |
| $150,000 to $199,999 | 9 | 13.2% |
| $200,000+ | 1 | 1.5% |
Family Income by Famaliy Size in Chamisal
4-person families (9 | 13.2%) account for the highest median family income in Chamisal with $107,917 per family, while 2-person families (47 | 69.1%) have the highest median income of $27,812 per family member.
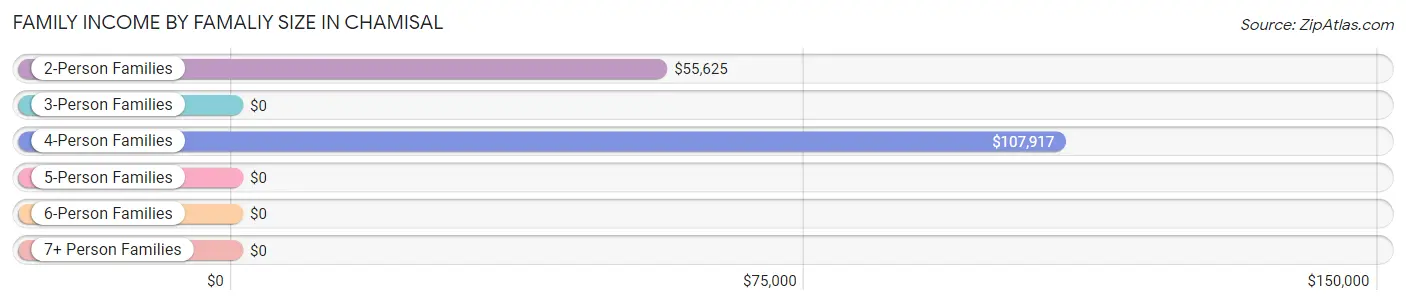
| Income Bracket | # Families | Median Income |
| 2-Person Families | 47 (69.1%) | $55,625 |
| 3-Person Families | 6 (8.8%) | $0 |
| 4-Person Families | 9 (13.2%) | $107,917 |
| 5-Person Families | 2 (2.9%) | $0 |
| 6-Person Families | 4 (5.9%) | $0 |
| 7+ Person Families | 0 (0.0%) | $0 |
| Total | 68 (100.0%) | $71,250 |
Family Income by Number of Earners in Chamisal
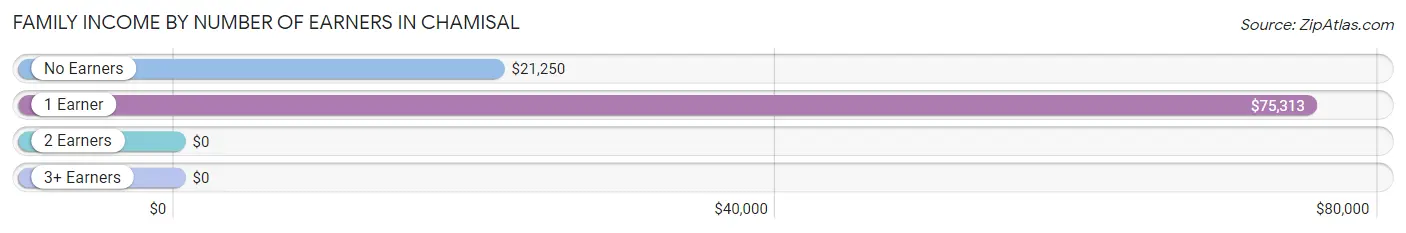
| Number of Earners | # Families | Median Income |
| No Earners | 26 (38.2%) | $21,250 |
| 1 Earner | 19 (27.9%) | $75,313 |
| 2 Earners | 19 (27.9%) | $0 |
| 3+ Earners | 4 (5.9%) | $0 |
| Total | 68 (100.0%) | $71,250 |
Household Income in Chamisal
Household Income Brackets in Chamisal
With 24 households falling in the category, the $75,000 to $99,999 income range is the most frequent in Chamisal, accounting for 19.2% of all households. In contrast, only 1 households (0.8%) fall into the $200,000+ income bracket, making it the least populous group.
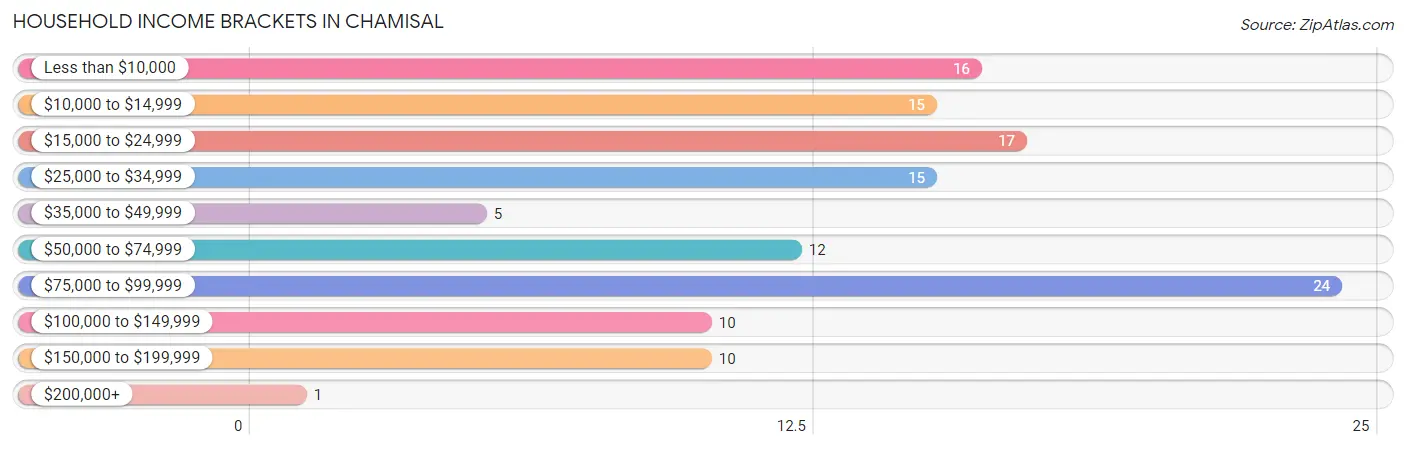
| Income Bracket | # Households | % Households |
| Less than $10,000 | 16 | 12.8% |
| $10,000 to $14,999 | 15 | 12.0% |
| $15,000 to $24,999 | 17 | 13.6% |
| $25,000 to $34,999 | 15 | 12.0% |
| $35,000 to $49,999 | 5 | 4.0% |
| $50,000 to $74,999 | 12 | 9.6% |
| $75,000 to $99,999 | 24 | 19.2% |
| $100,000 to $149,999 | 10 | 8.0% |
| $150,000 to $199,999 | 10 | 8.0% |
| $200,000+ | 1 | 0.8% |
Household Income by Householder Age in Chamisal
The median household income in Chamisal is $34,875, with the highest median household income of $47,500 found in the 45 to 64 years age bracket for the primary householder. A total of 50 households (40.0%) fall into this category. Meanwhile, the 15 to 24 years age bracket for the primary householder has the lowest median household income of $0, with 2 households (1.6%) in this group.
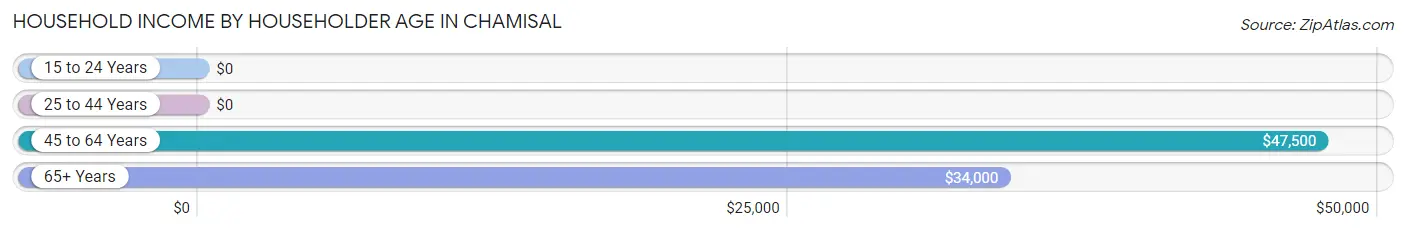
| Income Bracket | # Households | Median Income |
| 15 to 24 Years | 2 (1.6%) | $0 |
| 25 to 44 Years | 13 (10.4%) | $0 |
| 45 to 64 Years | 50 (40.0%) | $47,500 |
| 65+ Years | 60 (48.0%) | $34,000 |
| Total | 125 (100.0%) | $34,875 |
Poverty in Chamisal
Income Below Poverty by Sex and Age in Chamisal
With 12.3% poverty level for males and 22.1% for females among the residents of Chamisal, 16 and 17 year old males and 16 and 17 year old females are the most vulnerable to poverty, with 3 males (100.0%) and 2 females (100.0%) in their respective age groups living below the poverty level.
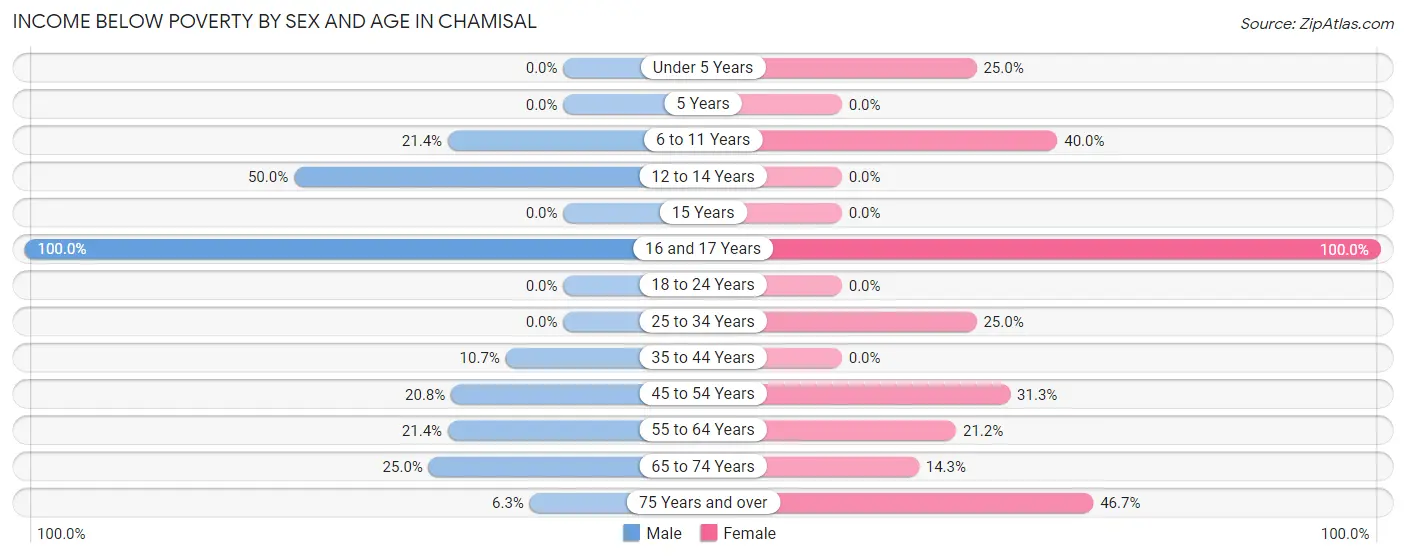
| Age Bracket | Male | Female |
| Under 5 Years | 0 (0.0%) | 2 (25.0%) |
| 5 Years | 0 (0.0%) | 0 (0.0%) |
| 6 to 11 Years | 3 (21.4%) | 2 (40.0%) |
| 12 to 14 Years | 3 (50.0%) | 0 (0.0%) |
| 15 Years | 0 (0.0%) | 0 (0.0%) |
| 16 and 17 Years | 3 (100.0%) | 2 (100.0%) |
| 18 to 24 Years | 0 (0.0%) | 0 (0.0%) |
| 25 to 34 Years | 0 (0.0%) | 2 (25.0%) |
| 35 to 44 Years | 3 (10.7%) | 0 (0.0%) |
| 45 to 54 Years | 5 (20.8%) | 5 (31.2%) |
| 55 to 64 Years | 3 (21.4%) | 7 (21.2%) |
| 65 to 74 Years | 4 (25.0%) | 3 (14.3%) |
| 75 Years and over | 2 (6.2%) | 7 (46.7%) |
| Total | 26 (12.3%) | 30 (22.1%) |
Income Above Poverty by Sex and Age in Chamisal
According to the poverty statistics in Chamisal, males aged under 5 years and females aged 12 to 14 years are the age groups that are most secure financially, with 100.0% of males and 100.0% of females in these age groups living above the poverty line.
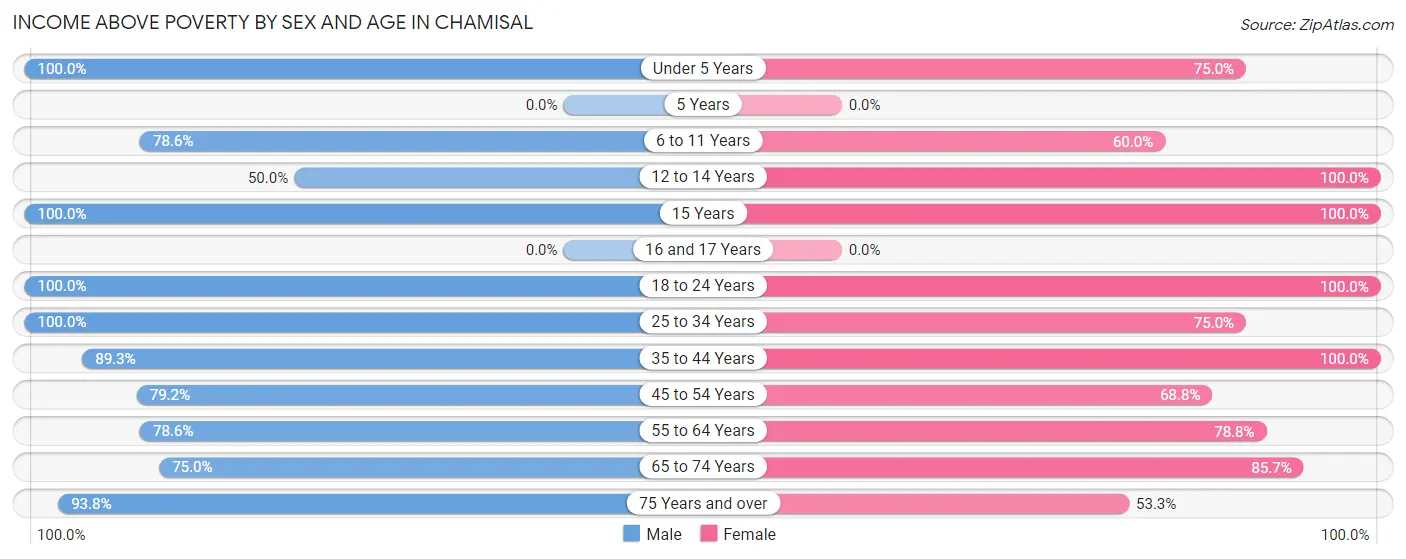
| Age Bracket | Male | Female |
| Under 5 Years | 1 (100.0%) | 6 (75.0%) |
| 5 Years | 0 (0.0%) | 0 (0.0%) |
| 6 to 11 Years | 11 (78.6%) | 3 (60.0%) |
| 12 to 14 Years | 3 (50.0%) | 1 (100.0%) |
| 15 Years | 3 (100.0%) | 2 (100.0%) |
| 16 and 17 Years | 0 (0.0%) | 0 (0.0%) |
| 18 to 24 Years | 26 (100.0%) | 7 (100.0%) |
| 25 to 34 Years | 45 (100.0%) | 6 (75.0%) |
| 35 to 44 Years | 25 (89.3%) | 18 (100.0%) |
| 45 to 54 Years | 19 (79.2%) | 11 (68.8%) |
| 55 to 64 Years | 11 (78.6%) | 26 (78.8%) |
| 65 to 74 Years | 12 (75.0%) | 18 (85.7%) |
| 75 Years and over | 30 (93.8%) | 8 (53.3%) |
| Total | 186 (87.7%) | 106 (77.9%) |
Income Below Poverty Among Married-Couple Families in Chamisal
The poverty statistics for married-couple families in Chamisal show that 15.6% or 7 of the total 45 families live below the poverty line. Families with 1 or 2 children have the highest poverty rate of 18.2%, comprising of 2 families. On the other hand, families with no children have the lowest poverty rate of 14.7%, which includes 5 families.
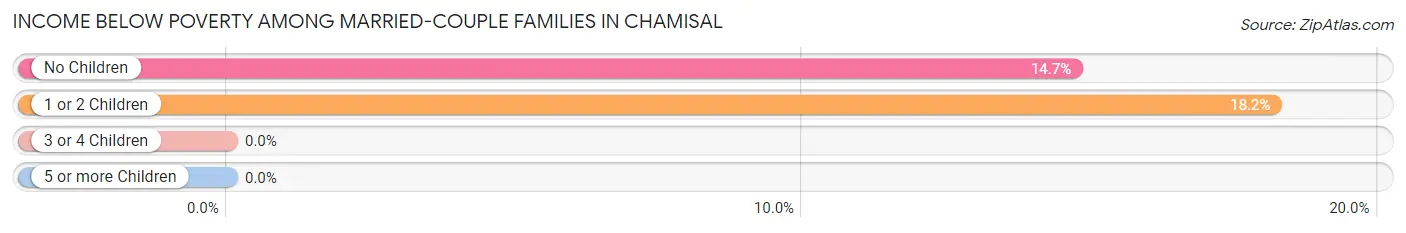
| Children | Above Poverty | Below Poverty |
| No Children | 29 (85.3%) | 5 (14.7%) |
| 1 or 2 Children | 9 (81.8%) | 2 (18.2%) |
| 3 or 4 Children | 0 (0.0%) | 0 (0.0%) |
| 5 or more Children | 0 (0.0%) | 0 (0.0%) |
| Total | 38 (84.4%) | 7 (15.6%) |
Income Below Poverty Among Single-Parent Households in Chamisal
According to the poverty data in Chamisal, 42.9% or 3 single-father households and 25.0% or 4 single-mother households are living below the poverty line. Among single-father households, those with 1 or 2 children have the highest poverty rate, with 3 households (60.0%) experiencing poverty. Likewise, among single-mother households, those with 1 or 2 children have the highest poverty rate, with 4 households (36.4%) falling below the poverty line.
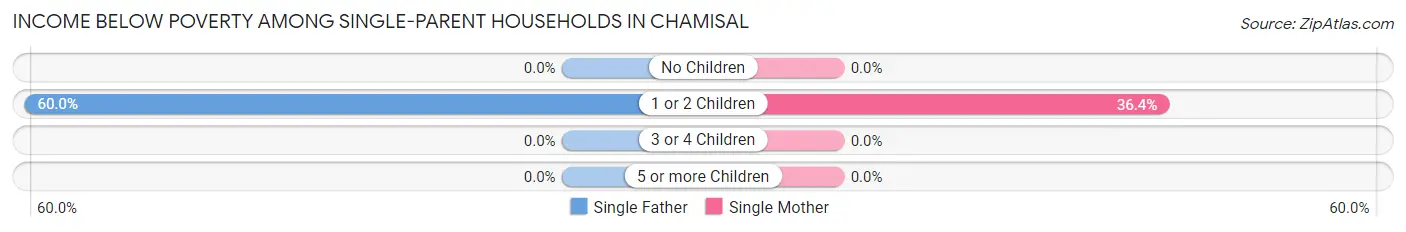
| Children | Single Father | Single Mother |
| No Children | 0 (0.0%) | 0 (0.0%) |
| 1 or 2 Children | 3 (60.0%) | 4 (36.4%) |
| 3 or 4 Children | 0 (0.0%) | 0 (0.0%) |
| 5 or more Children | 0 (0.0%) | 0 (0.0%) |
| Total | 3 (42.9%) | 4 (25.0%) |
Income Below Poverty Among Married-Couple vs Single-Parent Households in Chamisal
The poverty data for Chamisal shows that 7 of the married-couple family households (15.6%) and 7 of the single-parent households (30.4%) are living below the poverty level. Within the married-couple family households, those with 1 or 2 children have the highest poverty rate, with 2 households (18.2%) falling below the poverty line. Among the single-parent households, those with 1 or 2 children have the highest poverty rate, with 7 household (43.8%) living below poverty.
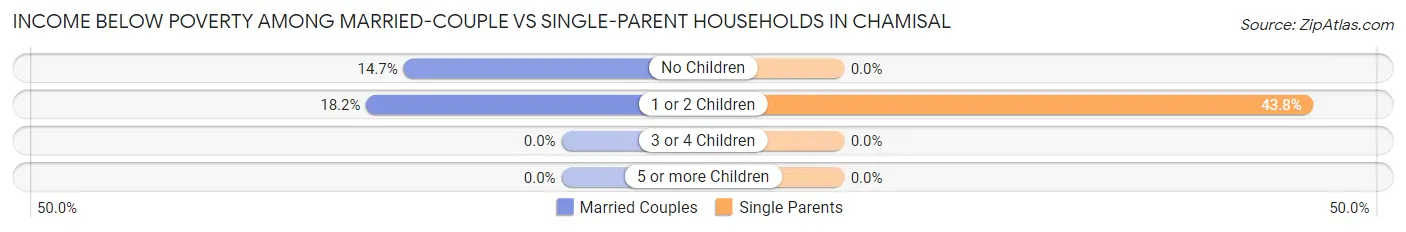
| Children | Married-Couple Families | Single-Parent Households |
| No Children | 5 (14.7%) | 0 (0.0%) |
| 1 or 2 Children | 2 (18.2%) | 7 (43.8%) |
| 3 or 4 Children | 0 (0.0%) | 0 (0.0%) |
| 5 or more Children | 0 (0.0%) | 0 (0.0%) |
| Total | 7 (15.6%) | 7 (30.4%) |
Race in Chamisal
The most populous races in Chamisal are Hispanic or Latino (336 | 93.9%), Two or more Races (183 | 51.1%), and White / Caucasian (154 | 43.0%).
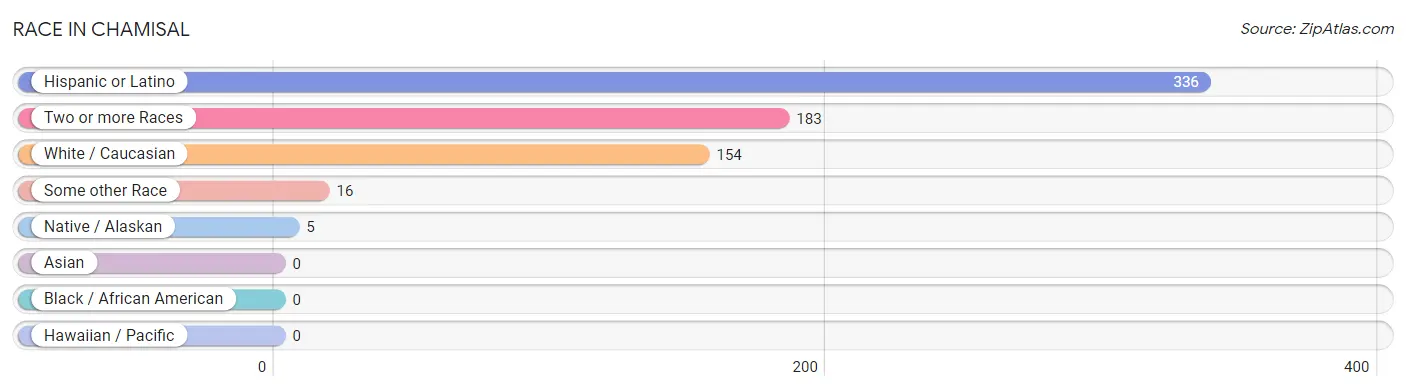
| Race | # Population | % Population |
| Asian | 0 | 0.0% |
| Black / African American | 0 | 0.0% |
| Hawaiian / Pacific | 0 | 0.0% |
| Hispanic or Latino | 336 | 93.9% |
| Native / Alaskan | 5 | 1.4% |
| White / Caucasian | 154 | 43.0% |
| Two or more Races | 183 | 51.1% |
| Some other Race | 16 | 4.5% |
| Total | 358 | 100.0% |
Ancestry in Chamisal
The most populous ancestries reported in Chamisal are Spanish (185 | 51.7%), Mexican (17 | 4.8%), French Canadian (9 | 2.5%), Spanish American (9 | 2.5%), and English (4 | 1.1%), together accounting for 62.6% of all Chamisal residents.
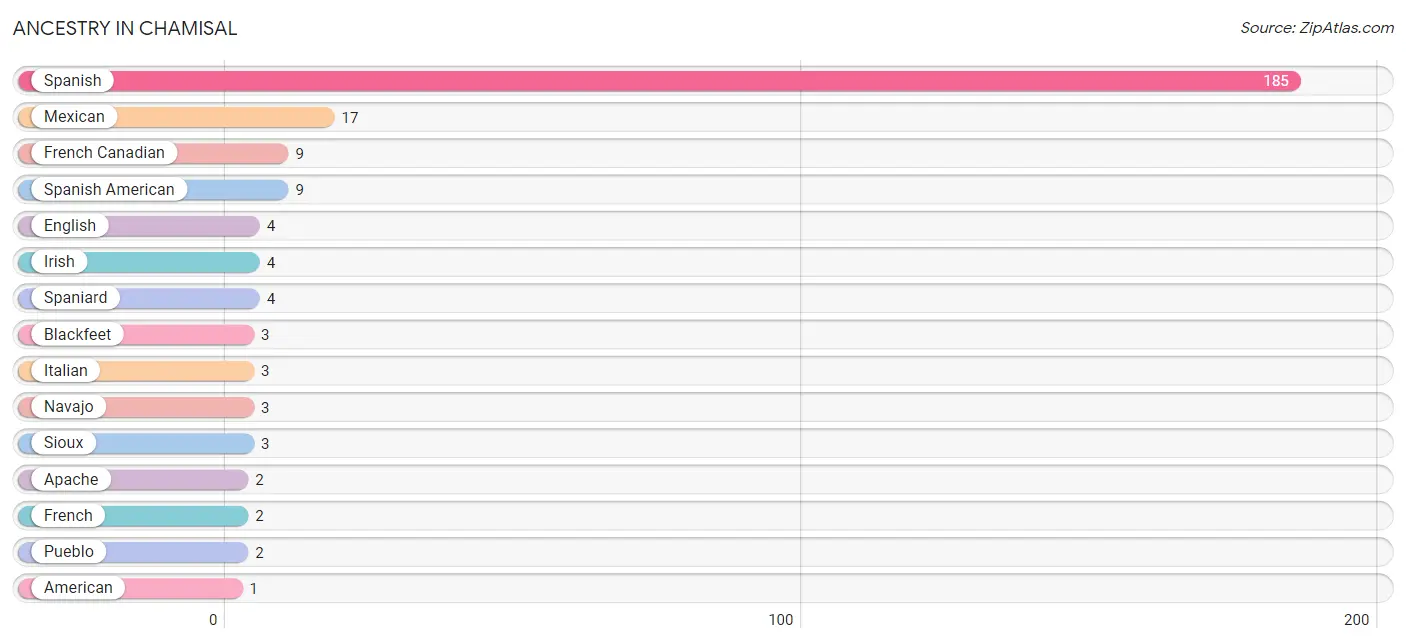
| Ancestry | # Population | % Population |
| American | 1 | 0.3% |
| Apache | 2 | 0.6% |
| Blackfeet | 3 | 0.8% |
| Bulgarian | 1 | 0.3% |
| Cherokee | 1 | 0.3% |
| Dutch | 1 | 0.3% |
| English | 4 | 1.1% |
| European | 1 | 0.3% |
| French | 2 | 0.6% |
| French Canadian | 9 | 2.5% |
| German | 1 | 0.3% |
| Irish | 4 | 1.1% |
| Italian | 3 | 0.8% |
| Mexican | 17 | 4.8% |
| Navajo | 3 | 0.8% |
| Polish | 1 | 0.3% |
| Pueblo | 2 | 0.6% |
| Russian | 1 | 0.3% |
| Sioux | 3 | 0.8% |
| Spaniard | 4 | 1.1% |
| Spanish | 185 | 51.7% |
| Spanish American | 9 | 2.5% | View All 22 Rows |
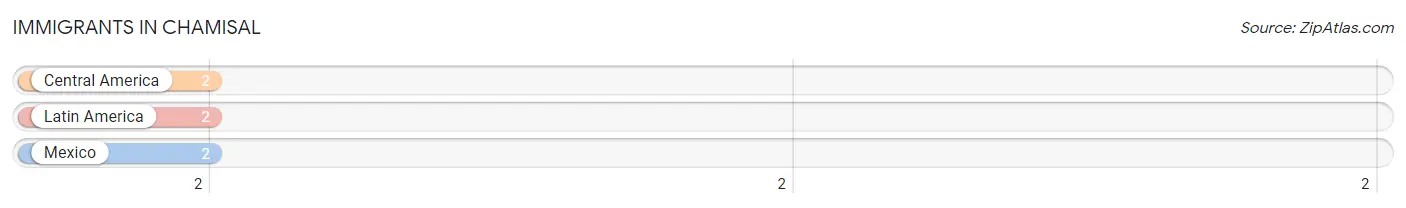
Immigrants in Chamisal
The most numerous immigrant groups reported in Chamisal came from Central America (2 | 0.6%), Latin America (2 | 0.6%), and Mexico (2 | 0.6%), together accounting for 1.7% of all Chamisal residents.
| Immigration Origin | # Population | % Population |
| Central America | 2 | 0.6% |
| Latin America | 2 | 0.6% |
| Mexico | 2 | 0.6% | View All 3 Rows |
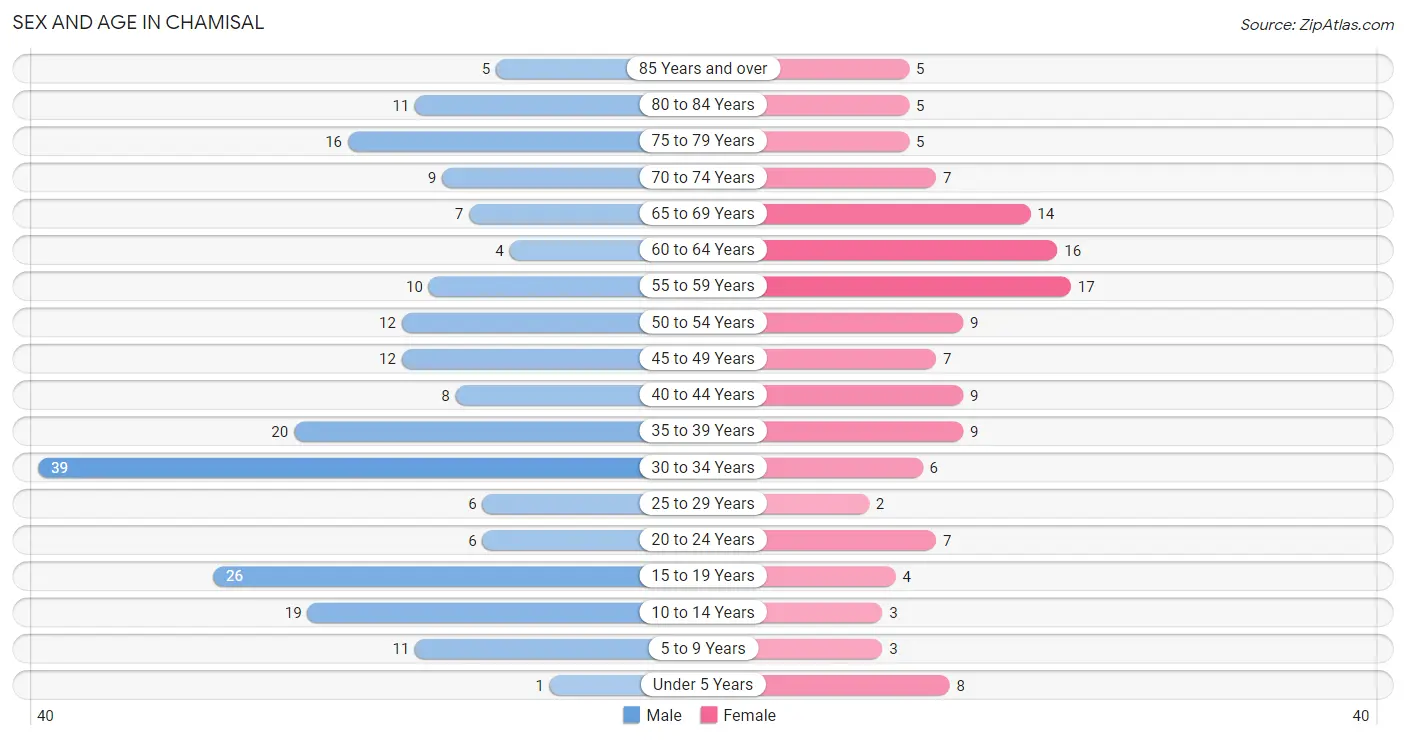
Sex and Age in Chamisal
Sex and Age in Chamisal
The most populous age groups in Chamisal are 30 to 34 Years (39 | 17.6%) for men and 55 to 59 Years (17 | 12.5%) for women.
| Age Bracket | Male | Female |
| Under 5 Years | 1 (0.4%) | 8 (5.9%) |
| 5 to 9 Years | 11 (5.0%) | 3 (2.2%) |
| 10 to 14 Years | 19 (8.6%) | 3 (2.2%) |
| 15 to 19 Years | 26 (11.7%) | 4 (2.9%) |
| 20 to 24 Years | 6 (2.7%) | 7 (5.1%) |
| 25 to 29 Years | 6 (2.7%) | 2 (1.5%) |
| 30 to 34 Years | 39 (17.6%) | 6 (4.4%) |
| 35 to 39 Years | 20 (9.0%) | 9 (6.6%) |
| 40 to 44 Years | 8 (3.6%) | 9 (6.6%) |
| 45 to 49 Years | 12 (5.4%) | 7 (5.1%) |
| 50 to 54 Years | 12 (5.4%) | 9 (6.6%) |
| 55 to 59 Years | 10 (4.5%) | 17 (12.5%) |
| 60 to 64 Years | 4 (1.8%) | 16 (11.8%) |
| 65 to 69 Years | 7 (3.2%) | 14 (10.3%) |
| 70 to 74 Years | 9 (4.1%) | 7 (5.1%) |
| 75 to 79 Years | 16 (7.2%) | 5 (3.7%) |
| 80 to 84 Years | 11 (5.0%) | 5 (3.7%) |
| 85 Years and over | 5 (2.2%) | 5 (3.7%) |
| Total | 222 (100.0%) | 136 (100.0%) |
Families and Households in Chamisal
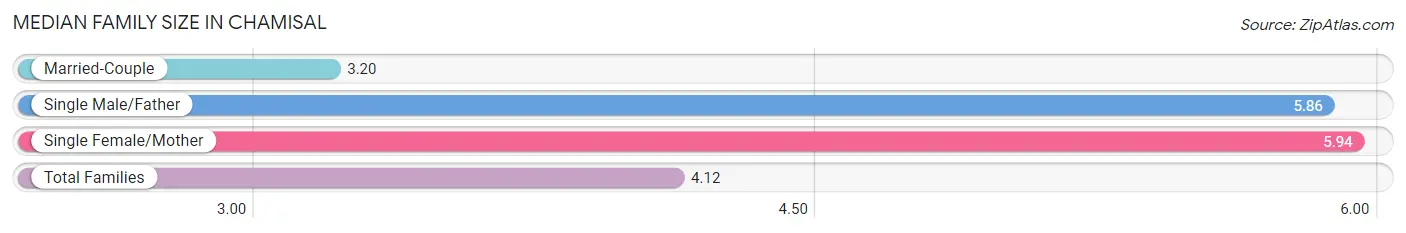
Median Family Size in Chamisal
The median family size in Chamisal is 4.12 persons per family, with single female/mother families (16 | 23.5%) accounting for the largest median family size of 5.94 persons per family. On the other hand, married-couple families (45 | 66.2%) represent the smallest median family size with 3.20 persons per family.
| Family Type | # Families | Family Size |
| Married-Couple | 45 (66.2%) | 3.20 |
| Single Male/Father | 7 (10.3%) | 5.86 |
| Single Female/Mother | 16 (23.5%) | 5.94 |
| Total Families | 68 (100.0%) | 4.12 |
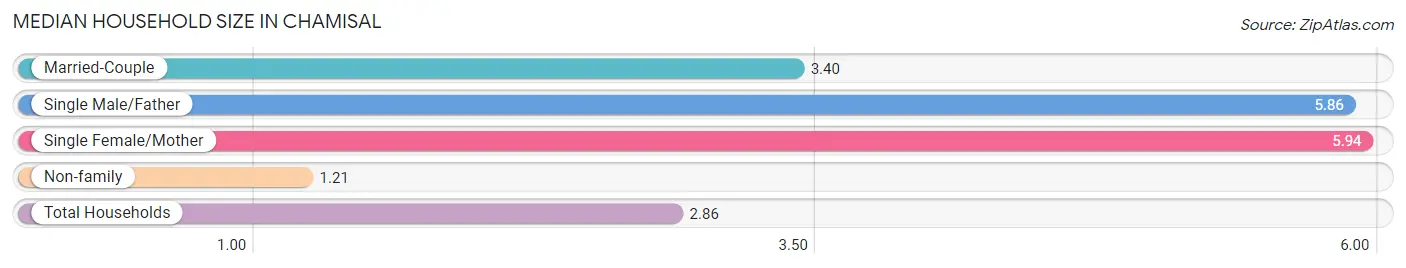
Median Household Size in Chamisal
The median household size in Chamisal is 2.86 persons per household, with single female/mother households (16 | 12.8%) accounting for the largest median household size of 5.94 persons per household. non-family households (57 | 45.6%) represent the smallest median household size with 1.21 persons per household.
| Household Type | # Households | Household Size |
| Married-Couple | 45 (36.0%) | 3.40 |
| Single Male/Father | 7 (5.6%) | 5.86 |
| Single Female/Mother | 16 (12.8%) | 5.94 |
| Non-family | 57 (45.6%) | 1.21 |
| Total Households | 125 (100.0%) | 2.86 |
Household Size by Marriage Status in Chamisal
Out of a total of 125 households in Chamisal, 68 (54.4%) are family households, while 57 (45.6%) are nonfamily households. The most numerous type of family households are 2-person households, comprising 47, and the most common type of nonfamily households are 1-person households, comprising 54.
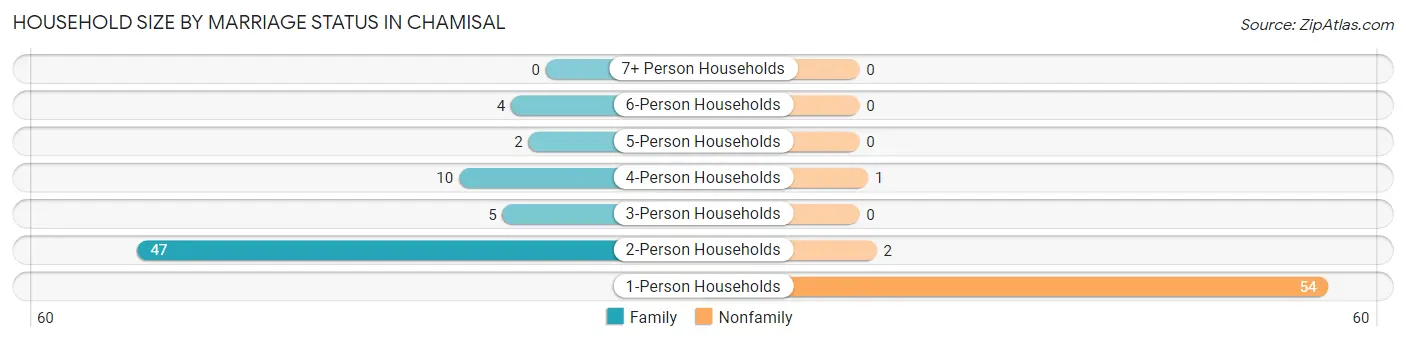
| Household Size | Family Households | Nonfamily Households |
| 1-Person Households | - | 54 (43.2%) |
| 2-Person Households | 47 (37.6%) | 2 (1.6%) |
| 3-Person Households | 5 (4.0%) | 0 (0.0%) |
| 4-Person Households | 10 (8.0%) | 1 (0.8%) |
| 5-Person Households | 2 (1.6%) | 0 (0.0%) |
| 6-Person Households | 4 (3.2%) | 0 (0.0%) |
| 7+ Person Households | 0 (0.0%) | 0 (0.0%) |
| Total | 68 (54.4%) | 57 (45.6%) |
Female Fertility in Chamisal
Fertility by Age in Chamisal
Average fertility rate in Chamisal is 83.0 births per 1,000 women. Women in the age bracket of 35 to 50 years have the highest fertility rate with 138.0 births per 1,000 women. Women in the age bracket of 35 to 50 years acount for 100.0% of all women with births.
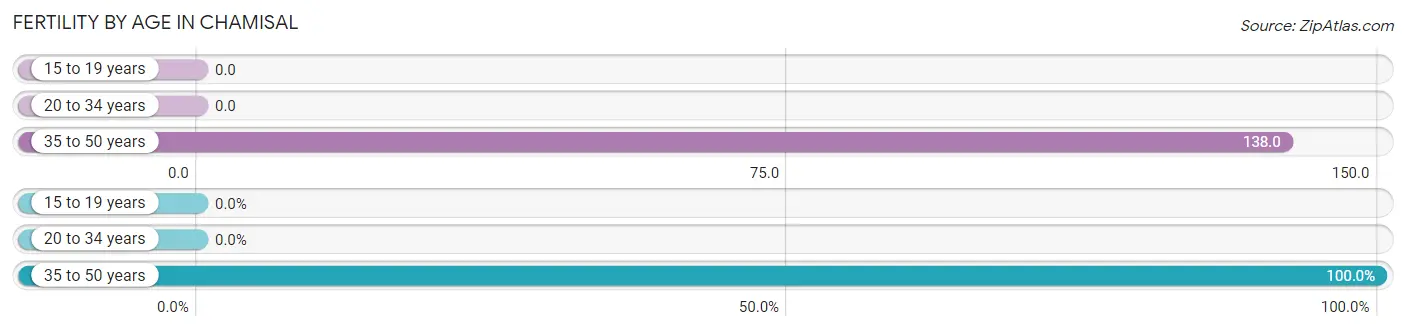
| Age Bracket | Women with Births | Births / 1,000 Women |
| 15 to 19 years | 0 (0.0%) | 0.0 |
| 20 to 34 years | 0 (0.0%) | 0.0 |
| 35 to 50 years | 4 (100.0%) | 138.0 |
| Total | 4 (100.0%) | 83.0 |
Fertility by Age by Marriage Status in Chamisal
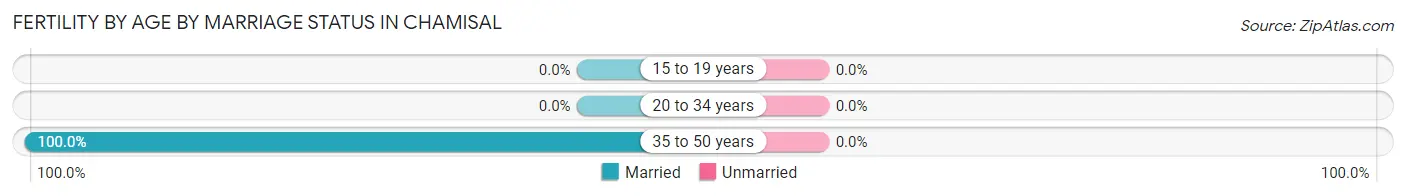
| Age Bracket | Married | Unmarried |
| 15 to 19 years | 0 (0.0%) | 0 (0.0%) |
| 20 to 34 years | 0 (0.0%) | 0 (0.0%) |
| 35 to 50 years | 4 (100.0%) | 0 (0.0%) |
| Total | 4 (100.0%) | 0 (0.0%) |
Fertility by Education in Chamisal
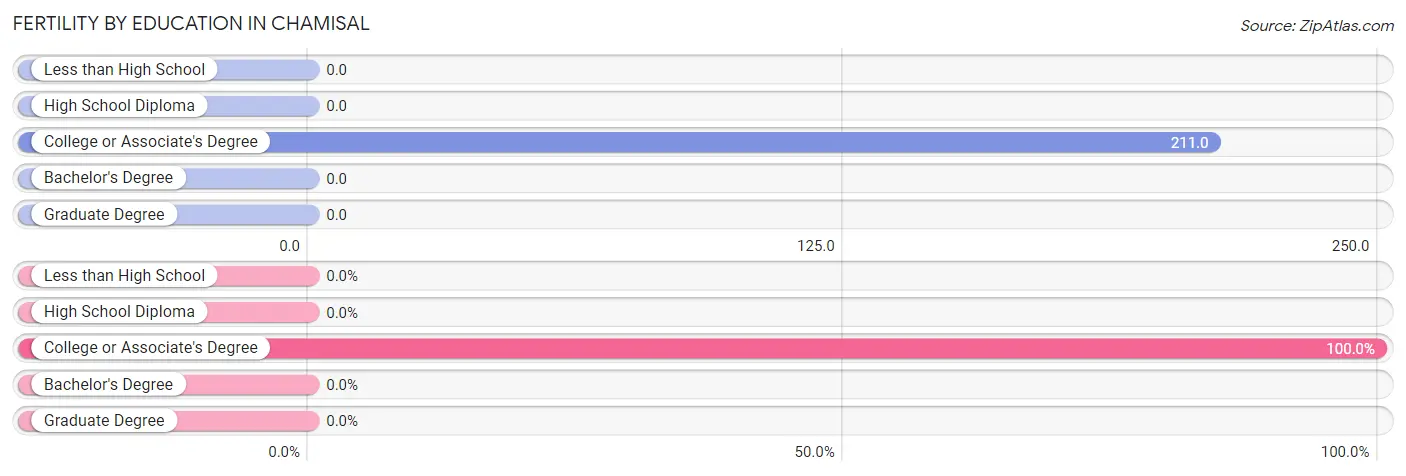
| Educational Attainment | Women with Births | Births / 1,000 Women |
| Less than High School | 0 (0.0%) | 0.0 |
| High School Diploma | 0 (0.0%) | 0.0 |
| College or Associate's Degree | 4 (100.0%) | 211.0 |
| Bachelor's Degree | 0 (0.0%) | 0.0 |
| Graduate Degree | 0 (0.0%) | 0.0 |
| Total | 4 (100.0%) | 83.0 |
Fertility by Education by Marriage Status in Chamisal
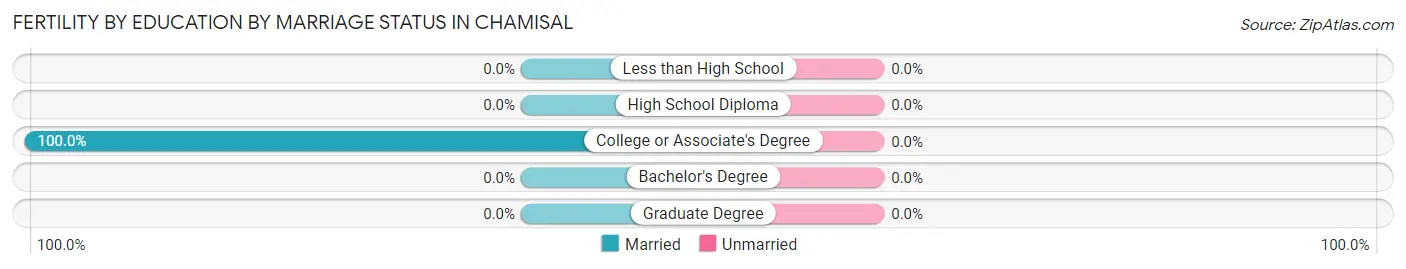
| Educational Attainment | Married | Unmarried |
| Less than High School | 0 (0.0%) | 0 (0.0%) |
| High School Diploma | 0 (0.0%) | 0 (0.0%) |
| College or Associate's Degree | 4 (100.0%) | 0 (0.0%) |
| Bachelor's Degree | 0 (0.0%) | 0 (0.0%) |
| Graduate Degree | 0 (0.0%) | 0 (0.0%) |
| Total | 4 (100.0%) | 0 (0.0%) |
Employment Characteristics in Chamisal
Employment by Class of Employer in Chamisal
Among the 150 employed individuals in Chamisal, private company employees (62 | 41.3%), not-for-profit organizations (32 | 21.3%), and local government employees (22 | 14.7%) make up the most common classes of employment.
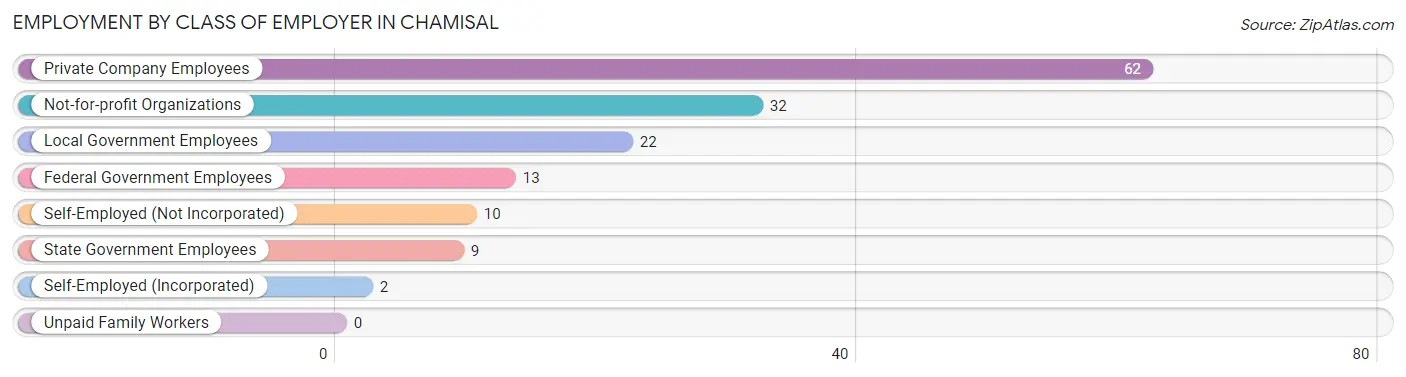
| Employer Class | # Employees | % Employees |
| Private Company Employees | 62 | 41.3% |
| Self-Employed (Incorporated) | 2 | 1.3% |
| Self-Employed (Not Incorporated) | 10 | 6.7% |
| Not-for-profit Organizations | 32 | 21.3% |
| Local Government Employees | 22 | 14.7% |
| State Government Employees | 9 | 6.0% |
| Federal Government Employees | 13 | 8.7% |
| Unpaid Family Workers | 0 | 0.0% |
| Total | 150 | 100.0% |
Employment Status by Age in Chamisal
According to the labor force statistics for Chamisal, out of the total population over 16 years of age (308), 51.6% or 159 individuals are in the labor force, with 1.3% or 2 of them unemployed. The age group with the highest labor force participation rate is 25 to 29 years, with 100.0% or 8 individuals in the labor force. Within the labor force, the 55 to 59 years age range has the highest percentage of unemployed individuals, with 5.9% or 1 of them being unemployed.
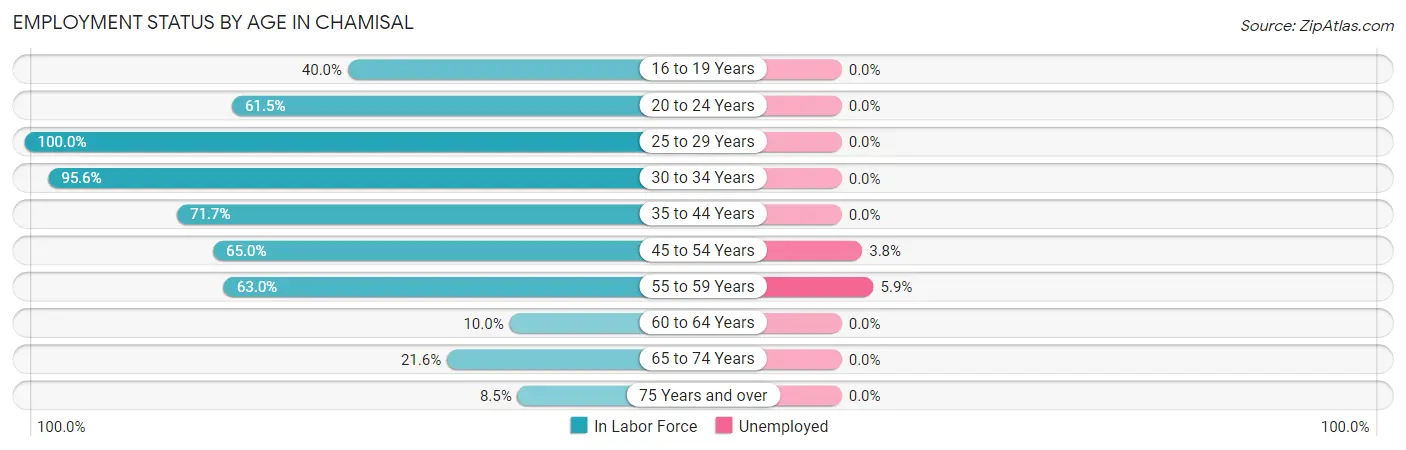
| Age Bracket | In Labor Force | Unemployed |
| 16 to 19 Years | 10 (40.0%) | 0 (0.0%) |
| 20 to 24 Years | 8 (61.5%) | 0 (0.0%) |
| 25 to 29 Years | 8 (100.0%) | 0 (0.0%) |
| 30 to 34 Years | 43 (95.6%) | 0 (0.0%) |
| 35 to 44 Years | 33 (71.7%) | 0 (0.0%) |
| 45 to 54 Years | 26 (65.0%) | 1 (3.8%) |
| 55 to 59 Years | 17 (63.0%) | 1 (5.9%) |
| 60 to 64 Years | 2 (10.0%) | 0 (0.0%) |
| 65 to 74 Years | 8 (21.6%) | 0 (0.0%) |
| 75 Years and over | 4 (8.5%) | 0 (0.0%) |
| Total | 159 (51.6%) | 2 (1.3%) |
Employment Status by Educational Attainment in Chamisal
According to labor force statistics for Chamisal, 69.4% of individuals (129) out of the total population between 25 and 64 years of age (186) are in the labor force, with 1.6% or 2 of them being unemployed. The group with the highest labor force participation rate are those with the educational attainment of college / associate degree, with 78.4% or 80 individuals in the labor force. Within the labor force, individuals with high school diploma education have the highest percentage of unemployment, with 5.9% or 2 of them being unemployed.
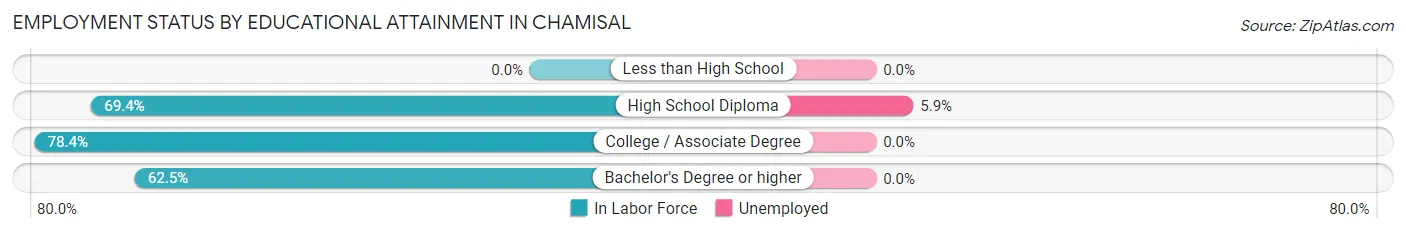
| Educational Attainment | In Labor Force | Unemployed |
| Less than High School | 0 (0.0%) | 0 (0.0%) |
| High School Diploma | 34 (69.4%) | 3 (5.9%) |
| College / Associate Degree | 80 (78.4%) | 0 (0.0%) |
| Bachelor's Degree or higher | 15 (62.5%) | 0 (0.0%) |
| Total | 129 (69.4%) | 3 (1.6%) |
Employment Occupations by Sex in Chamisal
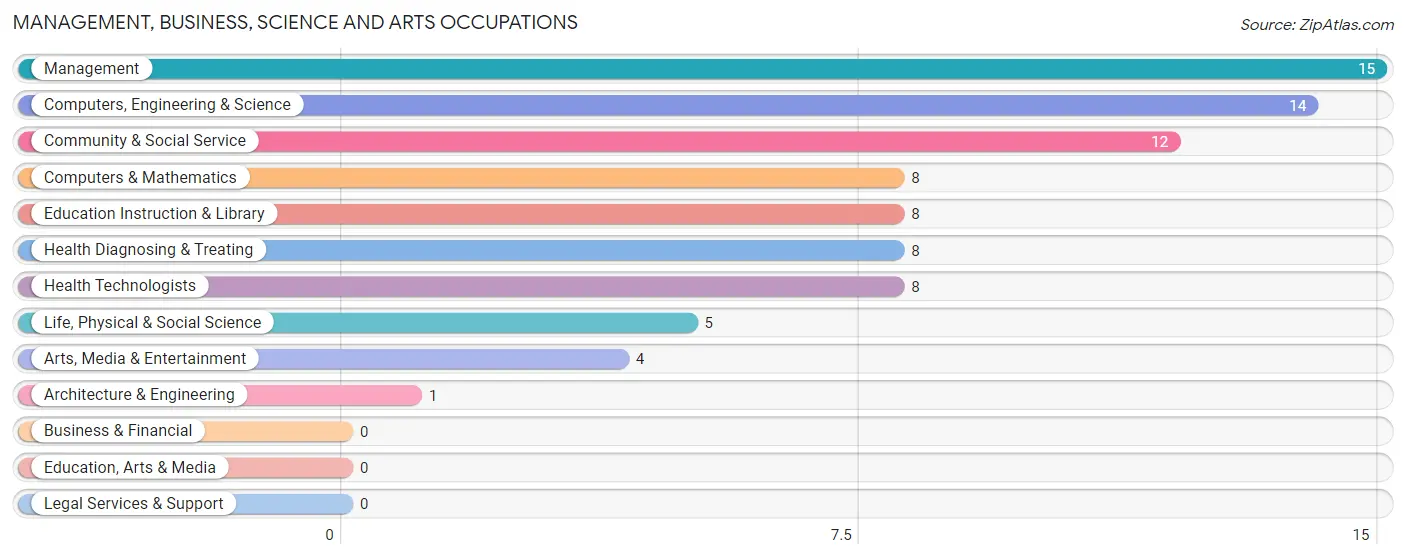
Management, Business, Science and Arts Occupations
The most common Management, Business, Science and Arts occupations in Chamisal are Management (15 | 9.6%), Computers, Engineering & Science (14 | 8.9%), Community & Social Service (12 | 7.6%), Computers & Mathematics (8 | 5.1%), and Education Instruction & Library (8 | 5.1%).
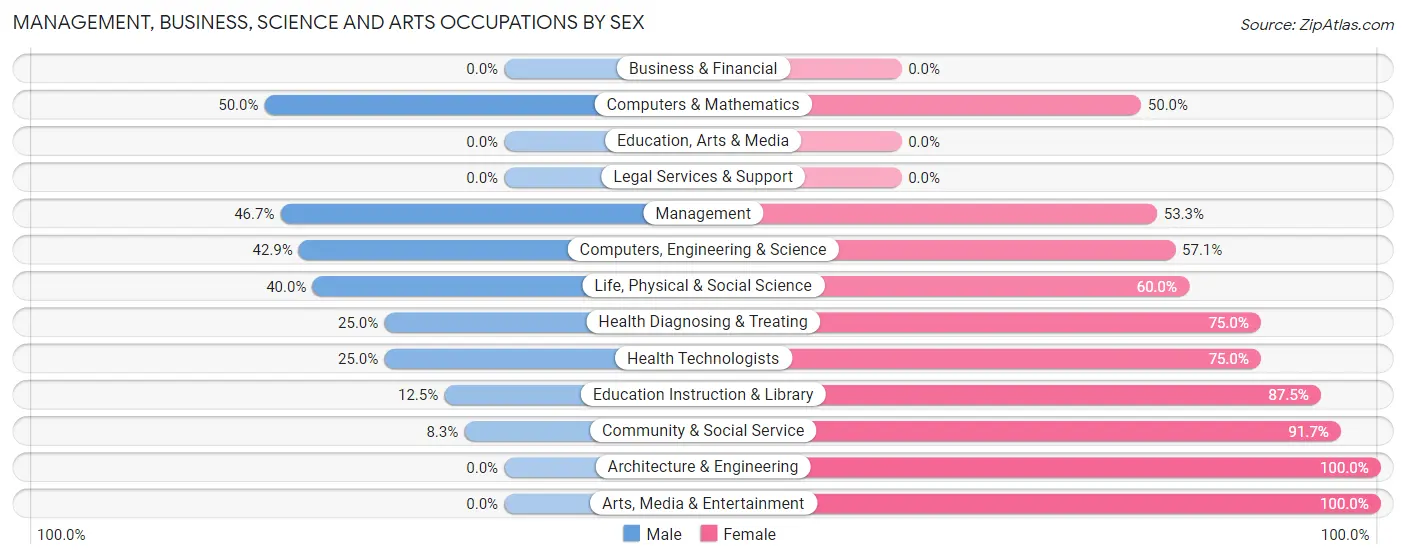
Management, Business, Science and Arts Occupations by Sex
Within the Management, Business, Science and Arts occupations in Chamisal, the most male-oriented occupations are Computers & Mathematics (50.0%), Management (46.7%), and Computers, Engineering & Science (42.9%), while the most female-oriented occupations are Architecture & Engineering (100.0%), Arts, Media & Entertainment (100.0%), and Community & Social Service (91.7%).
| Occupation | Male | Female |
| Management | 7 (46.7%) | 8 (53.3%) |
| Business & Financial | 0 (0.0%) | 0 (0.0%) |
| Computers, Engineering & Science | 6 (42.9%) | 8 (57.1%) |
| Computers & Mathematics | 4 (50.0%) | 4 (50.0%) |
| Architecture & Engineering | 0 (0.0%) | 1 (100.0%) |
| Life, Physical & Social Science | 2 (40.0%) | 3 (60.0%) |
| Community & Social Service | 1 (8.3%) | 11 (91.7%) |
| Education, Arts & Media | 0 (0.0%) | 0 (0.0%) |
| Legal Services & Support | 0 (0.0%) | 0 (0.0%) |
| Education Instruction & Library | 1 (12.5%) | 7 (87.5%) |
| Arts, Media & Entertainment | 0 (0.0%) | 4 (100.0%) |
| Health Diagnosing & Treating | 2 (25.0%) | 6 (75.0%) |
| Health Technologists | 2 (25.0%) | 6 (75.0%) |
| Total (Category) | 16 (32.7%) | 33 (67.3%) |
| Total (Overall) | 99 (63.1%) | 58 (36.9%) |
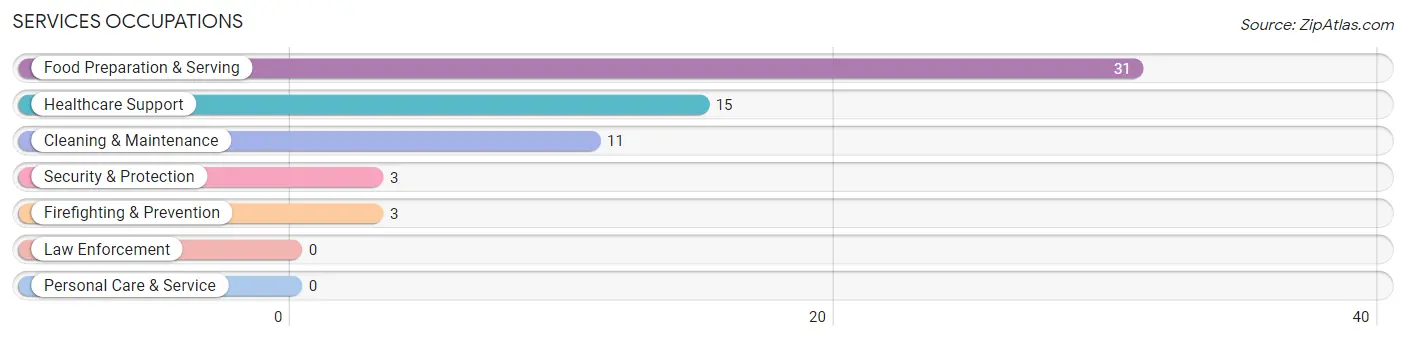
Services Occupations
The most common Services occupations in Chamisal are Food Preparation & Serving (31 | 19.8%), Healthcare Support (15 | 9.6%), Cleaning & Maintenance (11 | 7.0%), Security & Protection (3 | 1.9%), and Firefighting & Prevention (3 | 1.9%).
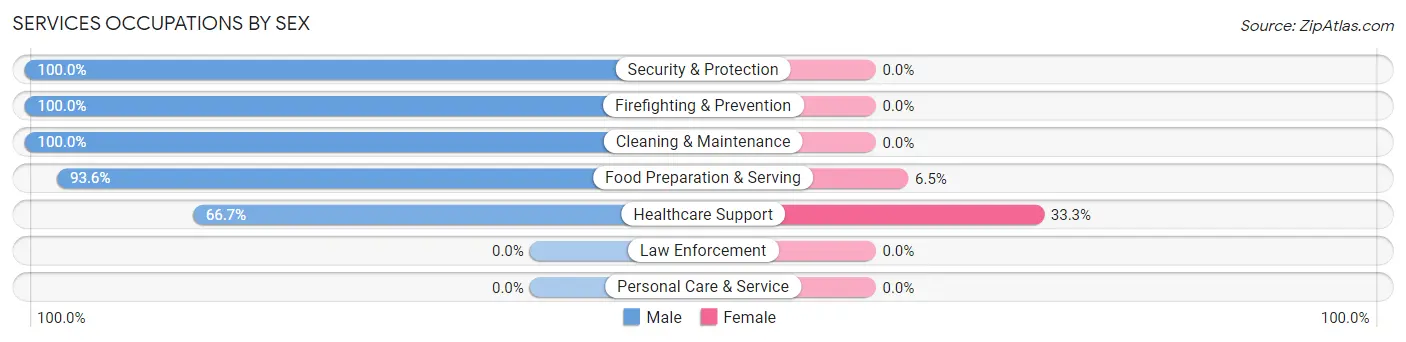
Services Occupations by Sex
Within the Services occupations in Chamisal, the most male-oriented occupations are Security & Protection (100.0%), Firefighting & Prevention (100.0%), and Cleaning & Maintenance (100.0%), while the most female-oriented occupations are Healthcare Support (33.3%), and Food Preparation & Serving (6.5%).
| Occupation | Male | Female |
| Healthcare Support | 10 (66.7%) | 5 (33.3%) |
| Security & Protection | 3 (100.0%) | 0 (0.0%) |
| Firefighting & Prevention | 3 (100.0%) | 0 (0.0%) |
| Law Enforcement | 0 (0.0%) | 0 (0.0%) |
| Food Preparation & Serving | 29 (93.5%) | 2 (6.5%) |
| Cleaning & Maintenance | 11 (100.0%) | 0 (0.0%) |
| Personal Care & Service | 0 (0.0%) | 0 (0.0%) |
| Total (Category) | 53 (88.3%) | 7 (11.7%) |
| Total (Overall) | 99 (63.1%) | 58 (36.9%) |
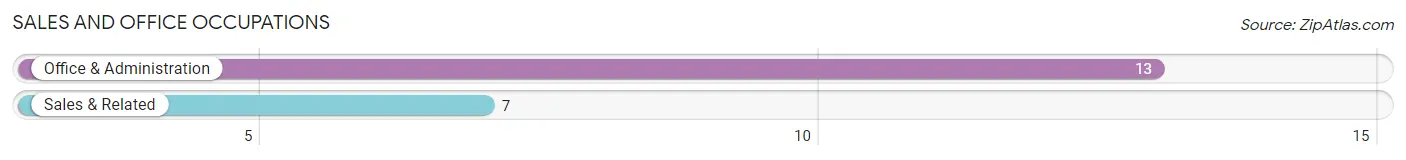
Sales and Office Occupations
The most common Sales and Office occupations in Chamisal are Office & Administration (13 | 8.3%), and Sales & Related (7 | 4.5%).
Sales and Office Occupations by Sex
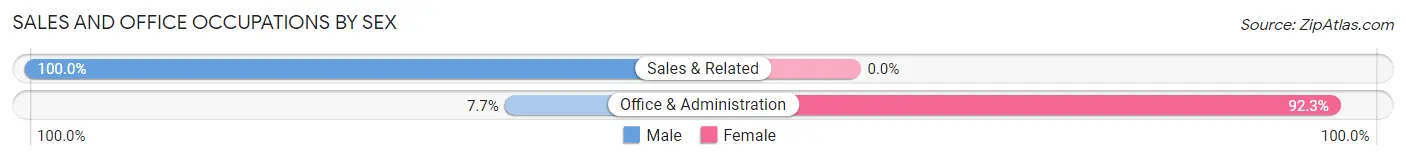
| Occupation | Male | Female |
| Sales & Related | 7 (100.0%) | 0 (0.0%) |
| Office & Administration | 1 (7.7%) | 12 (92.3%) |
| Total (Category) | 8 (40.0%) | 12 (60.0%) |
| Total (Overall) | 99 (63.1%) | 58 (36.9%) |
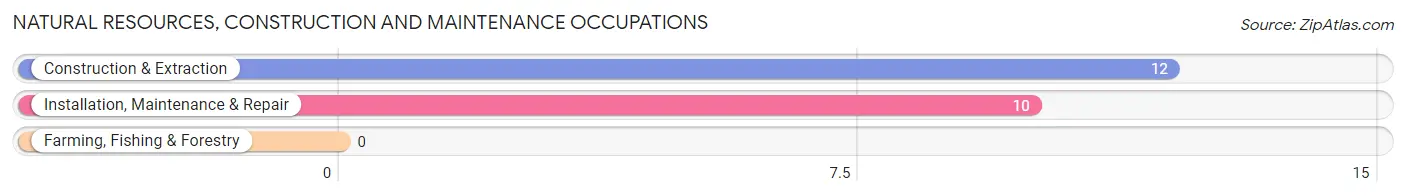
Natural Resources, Construction and Maintenance Occupations
The most common Natural Resources, Construction and Maintenance occupations in Chamisal are Construction & Extraction (12 | 7.6%), and Installation, Maintenance & Repair (10 | 6.4%).
Natural Resources, Construction and Maintenance Occupations by Sex
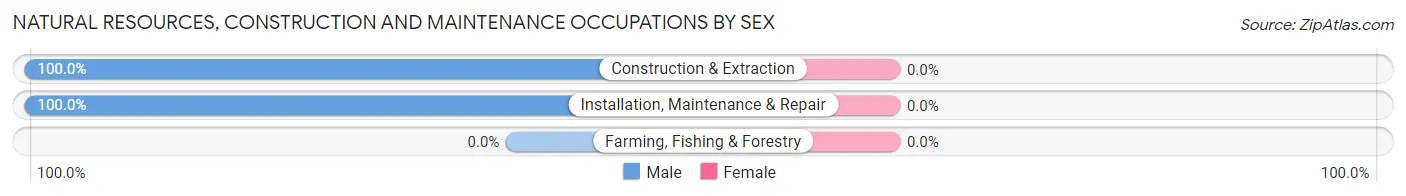
| Occupation | Male | Female |
| Farming, Fishing & Forestry | 0 (0.0%) | 0 (0.0%) |
| Construction & Extraction | 12 (100.0%) | 0 (0.0%) |
| Installation, Maintenance & Repair | 10 (100.0%) | 0 (0.0%) |
| Total (Category) | 22 (100.0%) | 0 (0.0%) |
| Total (Overall) | 99 (63.1%) | 58 (36.9%) |
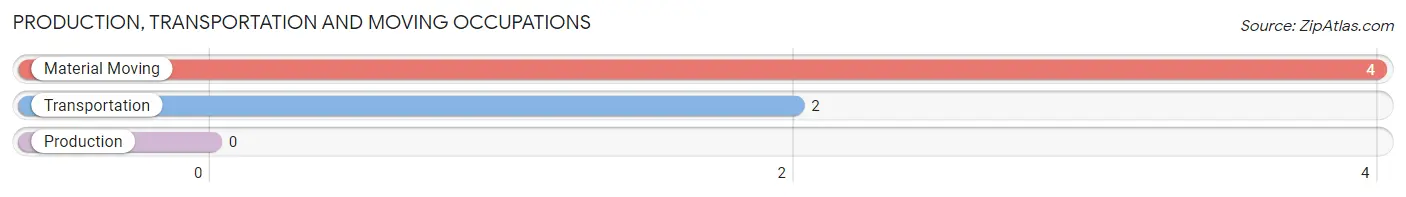
Production, Transportation and Moving Occupations
The most common Production, Transportation and Moving occupations in Chamisal are Material Moving (4 | 2.5%), and Transportation (2 | 1.3%).
Production, Transportation and Moving Occupations by Sex
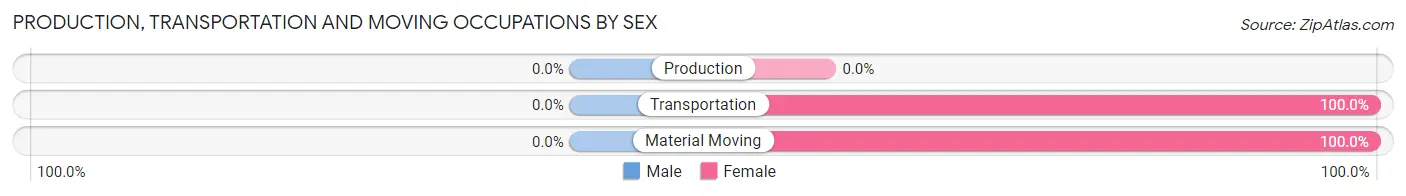
| Occupation | Male | Female |
| Production | 0 (0.0%) | 0 (0.0%) |
| Transportation | 0 (0.0%) | 2 (100.0%) |
| Material Moving | 0 (0.0%) | 4 (100.0%) |
| Total (Category) | 0 (0.0%) | 6 (100.0%) |
| Total (Overall) | 99 (63.1%) | 58 (36.9%) |
Employment Industries by Sex in Chamisal
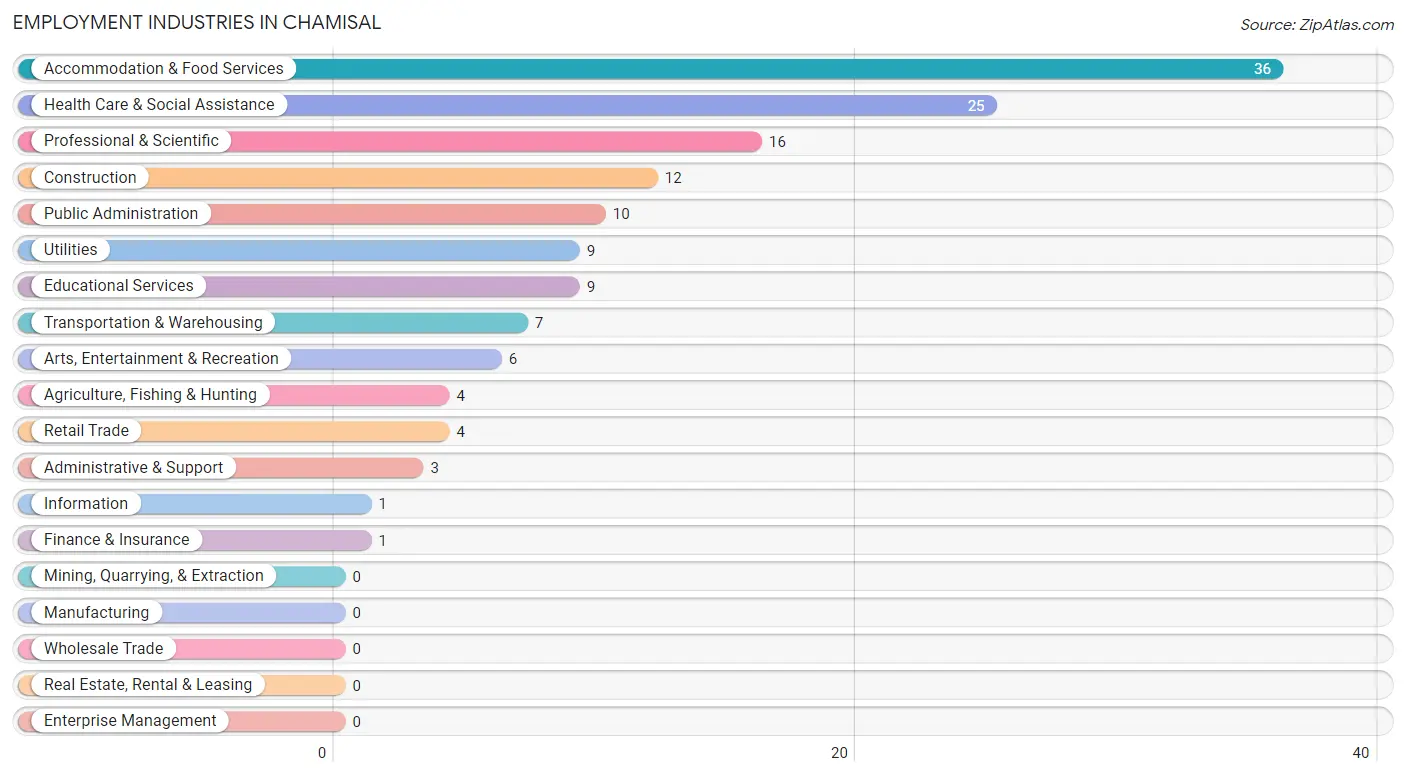
Employment Industries in Chamisal
The major employment industries in Chamisal include Accommodation & Food Services (36 | 22.9%), Health Care & Social Assistance (25 | 15.9%), Professional & Scientific (16 | 10.2%), Construction (12 | 7.6%), and Public Administration (10 | 6.4%).
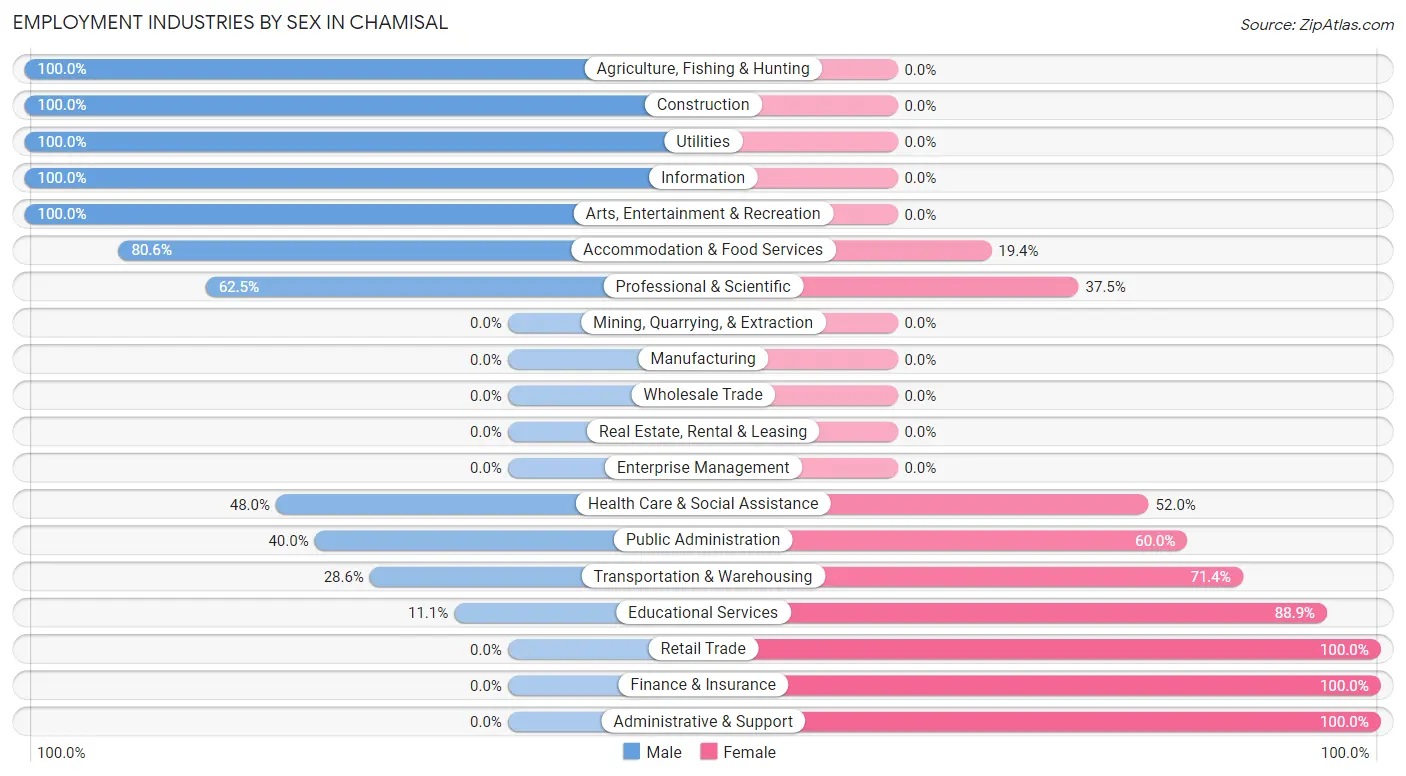
Employment Industries by Sex in Chamisal
The Chamisal industries that see more men than women are Agriculture, Fishing & Hunting (100.0%), Construction (100.0%), and Utilities (100.0%), whereas the industries that tend to have a higher number of women are Retail Trade (100.0%), Finance & Insurance (100.0%), and Administrative & Support (100.0%).
| Industry | Male | Female |
| Agriculture, Fishing & Hunting | 4 (100.0%) | 0 (0.0%) |
| Mining, Quarrying, & Extraction | 0 (0.0%) | 0 (0.0%) |
| Construction | 12 (100.0%) | 0 (0.0%) |
| Manufacturing | 0 (0.0%) | 0 (0.0%) |
| Wholesale Trade | 0 (0.0%) | 0 (0.0%) |
| Retail Trade | 0 (0.0%) | 4 (100.0%) |
| Transportation & Warehousing | 2 (28.6%) | 5 (71.4%) |
| Utilities | 9 (100.0%) | 0 (0.0%) |
| Information | 1 (100.0%) | 0 (0.0%) |
| Finance & Insurance | 0 (0.0%) | 1 (100.0%) |
| Real Estate, Rental & Leasing | 0 (0.0%) | 0 (0.0%) |
| Professional & Scientific | 10 (62.5%) | 6 (37.5%) |
| Enterprise Management | 0 (0.0%) | 0 (0.0%) |
| Administrative & Support | 0 (0.0%) | 3 (100.0%) |
| Educational Services | 1 (11.1%) | 8 (88.9%) |
| Health Care & Social Assistance | 12 (48.0%) | 13 (52.0%) |
| Arts, Entertainment & Recreation | 6 (100.0%) | 0 (0.0%) |
| Accommodation & Food Services | 29 (80.6%) | 7 (19.4%) |
| Public Administration | 4 (40.0%) | 6 (60.0%) |
| Total | 99 (63.1%) | 58 (36.9%) |
Education in Chamisal
School Enrollment in Chamisal
The most common levels of schooling among the 58 students in Chamisal are middle school (22 | 37.9%), high school (10 | 17.2%), and college / undergraduate (10 | 17.2%).
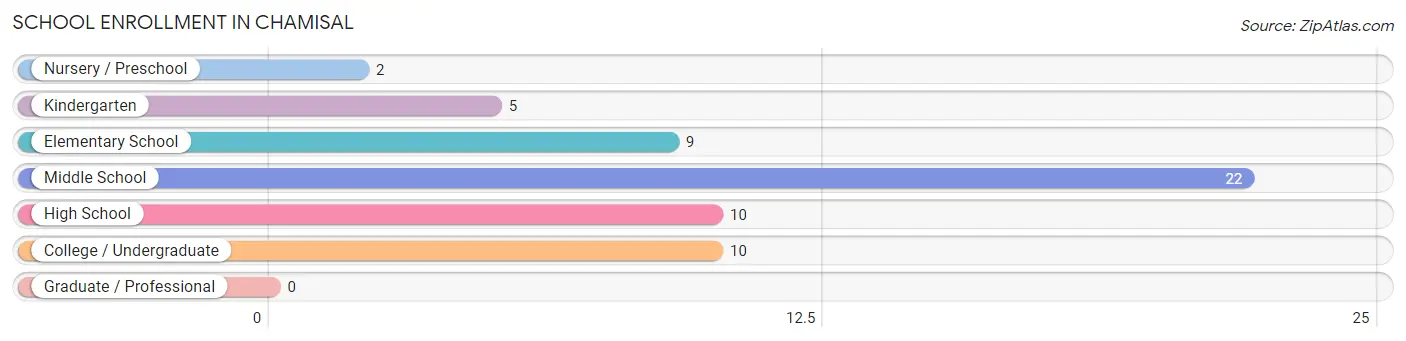
| School Level | # Students | % Students |
| Nursery / Preschool | 2 | 3.5% |
| Kindergarten | 5 | 8.6% |
| Elementary School | 9 | 15.5% |
| Middle School | 22 | 37.9% |
| High School | 10 | 17.2% |
| College / Undergraduate | 10 | 17.2% |
| Graduate / Professional | 0 | 0.0% |
| Total | 58 | 100.0% |
School Enrollment by Age by Funding Source in Chamisal
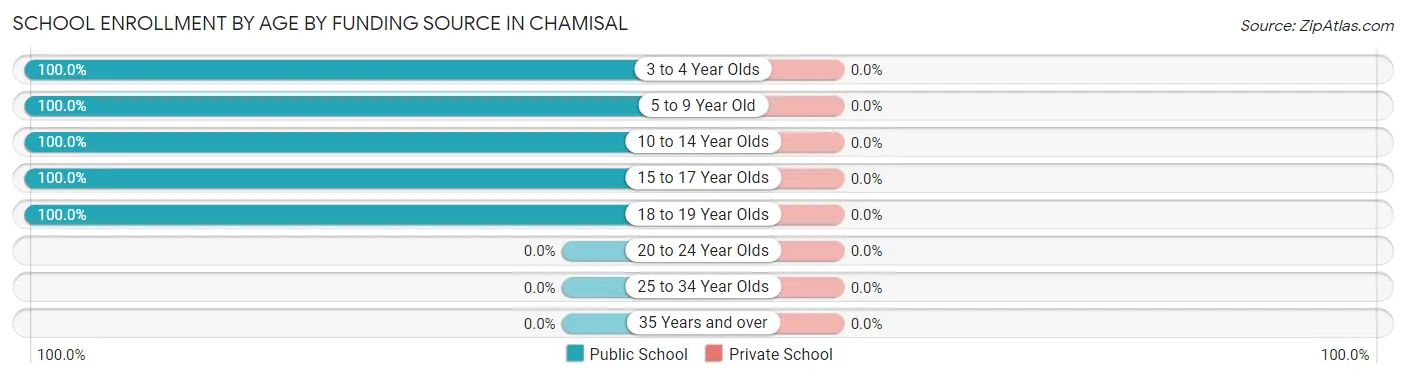
| Age Bracket | Public School | Private School |
| 3 to 4 Year Olds | 2 (100.0%) | 0 (0.0%) |
| 5 to 9 Year Old | 14 (100.0%) | 0 (0.0%) |
| 10 to 14 Year Olds | 22 (100.0%) | 0 (0.0%) |
| 15 to 17 Year Olds | 10 (100.0%) | 0 (0.0%) |
| 18 to 19 Year Olds | 10 (100.0%) | 0 (0.0%) |
| 20 to 24 Year Olds | 0 (0.0%) | 0 (0.0%) |
| 25 to 34 Year Olds | 0 (0.0%) | 0 (0.0%) |
| 35 Years and over | 0 (0.0%) | 0 (0.0%) |
| Total | 58 (100.0%) | 0 (0.0%) |
Educational Attainment by Field of Study in Chamisal
Education (20 | 37.0%), business (9 | 16.7%), computers & mathematics (6 | 11.1%), psychology (5 | 9.3%), and science & technology (4 | 7.4%) are the most common fields of study among 54 individuals in Chamisal who have obtained a bachelor's degree or higher.
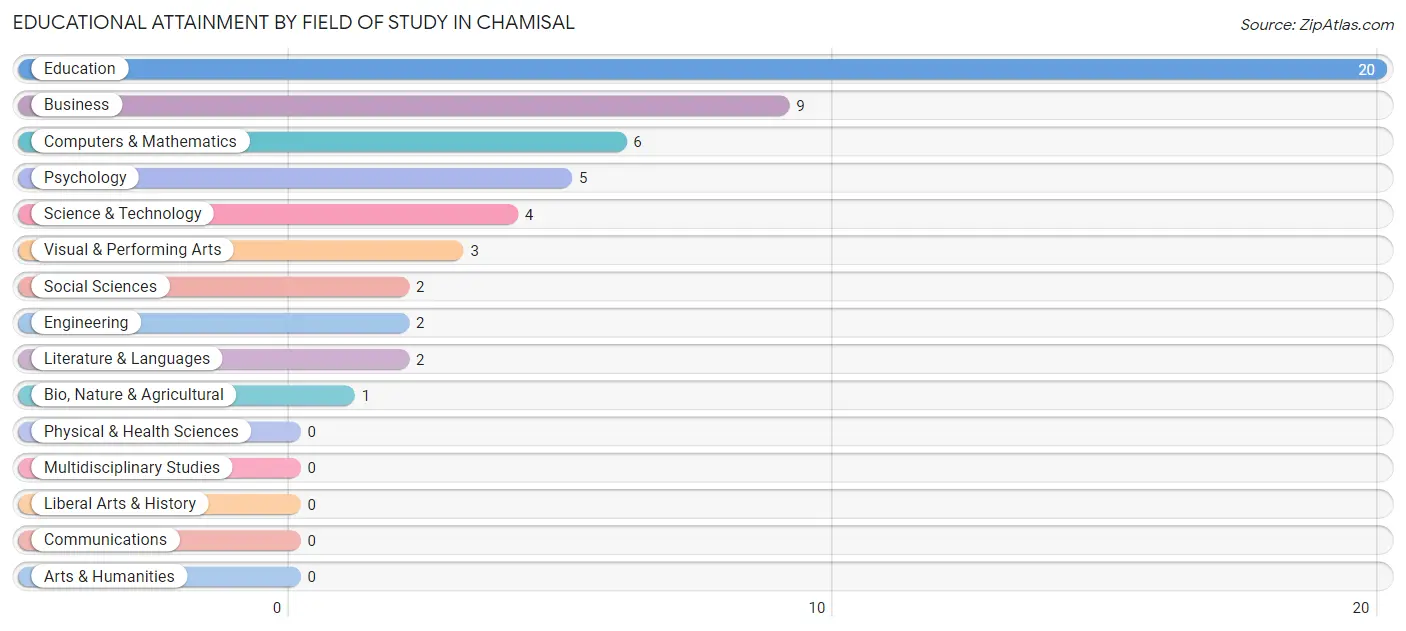
| Field of Study | # Graduates | % Graduates |
| Computers & Mathematics | 6 | 11.1% |
| Bio, Nature & Agricultural | 1 | 1.8% |
| Physical & Health Sciences | 0 | 0.0% |
| Psychology | 5 | 9.3% |
| Social Sciences | 2 | 3.7% |
| Engineering | 2 | 3.7% |
| Multidisciplinary Studies | 0 | 0.0% |
| Science & Technology | 4 | 7.4% |
| Business | 9 | 16.7% |
| Education | 20 | 37.0% |
| Literature & Languages | 2 | 3.7% |
| Liberal Arts & History | 0 | 0.0% |
| Visual & Performing Arts | 3 | 5.6% |
| Communications | 0 | 0.0% |
| Arts & Humanities | 0 | 0.0% |
| Total | 54 | 100.0% |
Transportation & Commute in Chamisal
Vehicle Availability by Sex in Chamisal
The most prevalent vehicle ownership categories in Chamisal are males with 5 or more vehicles (46, accounting for 47.4%) and females with 5 or more vehicles (14, making up 86.8%).
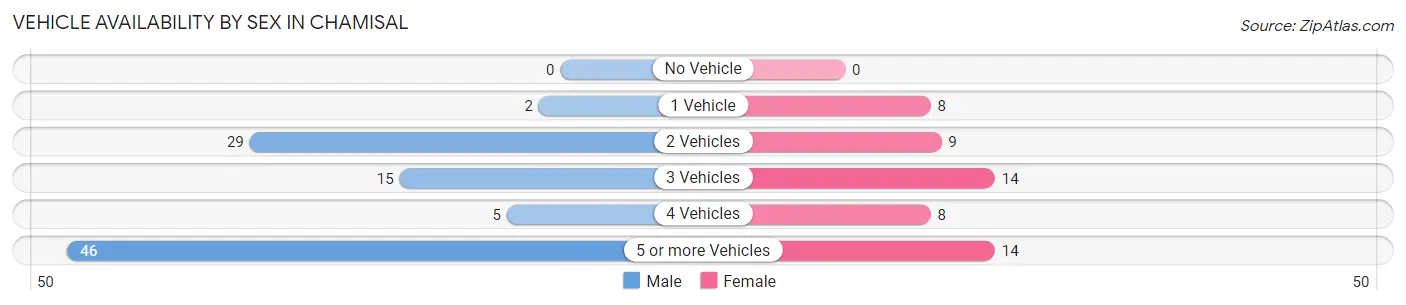
| Vehicles Available | Male | Female |
| No Vehicle | 0 (0.0%) | 0 (0.0%) |
| 1 Vehicle | 2 (2.1%) | 8 (15.1%) |
| 2 Vehicles | 29 (29.9%) | 9 (17.0%) |
| 3 Vehicles | 15 (15.5%) | 14 (26.4%) |
| 4 Vehicles | 5 (5.1%) | 8 (15.1%) |
| 5 or more Vehicles | 46 (47.4%) | 14 (26.4%) |
| Total | 97 (100.0%) | 53 (100.0%) |
Commute Time in Chamisal
The most frequently occuring commute durations in Chamisal are 5 to 9 minutes (28 commuters, 21.5%), 10 to 14 minutes (23 commuters, 17.7%), and 60 to 89 minutes (21 commuters, 16.2%).
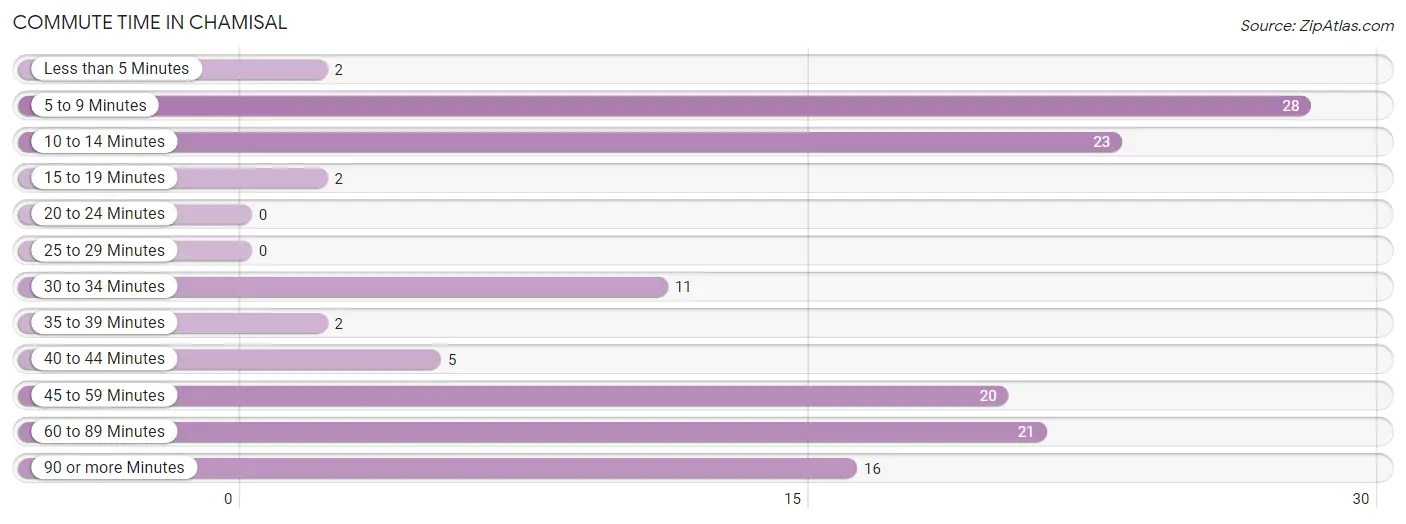
| Commute Time | # Commuters | % Commuters |
| Less than 5 Minutes | 2 | 1.5% |
| 5 to 9 Minutes | 28 | 21.5% |
| 10 to 14 Minutes | 23 | 17.7% |
| 15 to 19 Minutes | 2 | 1.5% |
| 20 to 24 Minutes | 0 | 0.0% |
| 25 to 29 Minutes | 0 | 0.0% |
| 30 to 34 Minutes | 11 | 8.5% |
| 35 to 39 Minutes | 2 | 1.5% |
| 40 to 44 Minutes | 5 | 3.8% |
| 45 to 59 Minutes | 20 | 15.4% |
| 60 to 89 Minutes | 21 | 16.2% |
| 90 or more Minutes | 16 | 12.3% |
Commute Time by Sex in Chamisal
The most common commute times in Chamisal are 5 to 9 minutes (26 commuters, 31.3%) for males and 10 to 14 minutes (15 commuters, 31.9%) for females.
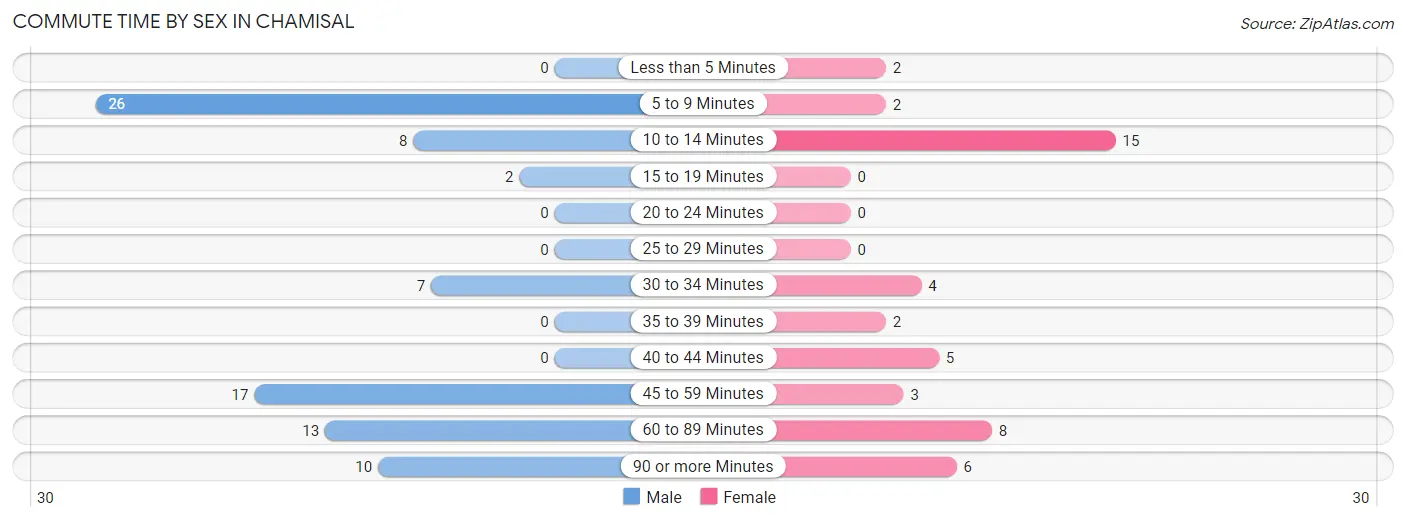
| Commute Time | Male | Female |
| Less than 5 Minutes | 0 (0.0%) | 2 (4.3%) |
| 5 to 9 Minutes | 26 (31.3%) | 2 (4.3%) |
| 10 to 14 Minutes | 8 (9.6%) | 15 (31.9%) |
| 15 to 19 Minutes | 2 (2.4%) | 0 (0.0%) |
| 20 to 24 Minutes | 0 (0.0%) | 0 (0.0%) |
| 25 to 29 Minutes | 0 (0.0%) | 0 (0.0%) |
| 30 to 34 Minutes | 7 (8.4%) | 4 (8.5%) |
| 35 to 39 Minutes | 0 (0.0%) | 2 (4.3%) |
| 40 to 44 Minutes | 0 (0.0%) | 5 (10.6%) |
| 45 to 59 Minutes | 17 (20.5%) | 3 (6.4%) |
| 60 to 89 Minutes | 13 (15.7%) | 8 (17.0%) |
| 90 or more Minutes | 10 (12.0%) | 6 (12.8%) |
Time of Departure to Work by Sex in Chamisal
The most frequent times of departure to work in Chamisal are 7:30 AM to 7:59 AM (32, 38.6%) for males and 7:30 AM to 7:59 AM (15, 31.9%) for females.
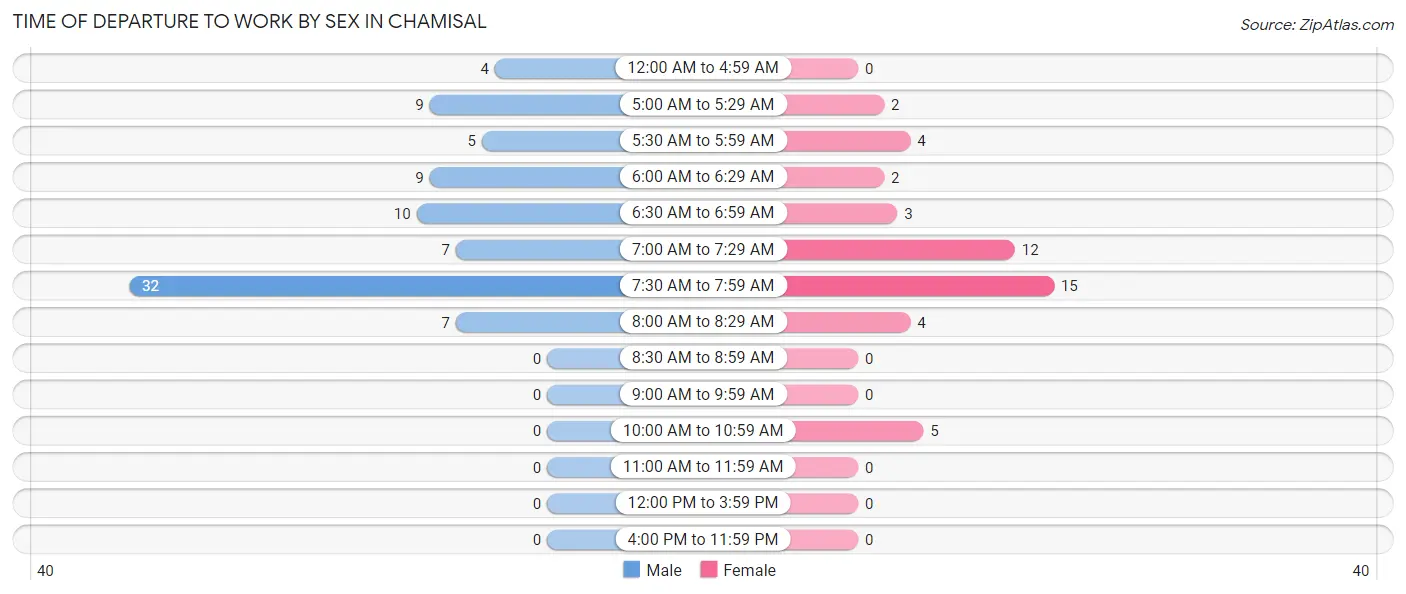
| Time of Departure | Male | Female |
| 12:00 AM to 4:59 AM | 4 (4.8%) | 0 (0.0%) |
| 5:00 AM to 5:29 AM | 9 (10.8%) | 2 (4.3%) |
| 5:30 AM to 5:59 AM | 5 (6.0%) | 4 (8.5%) |
| 6:00 AM to 6:29 AM | 9 (10.8%) | 2 (4.3%) |
| 6:30 AM to 6:59 AM | 10 (12.0%) | 3 (6.4%) |
| 7:00 AM to 7:29 AM | 7 (8.4%) | 12 (25.5%) |
| 7:30 AM to 7:59 AM | 32 (38.6%) | 15 (31.9%) |
| 8:00 AM to 8:29 AM | 7 (8.4%) | 4 (8.5%) |
| 8:30 AM to 8:59 AM | 0 (0.0%) | 0 (0.0%) |
| 9:00 AM to 9:59 AM | 0 (0.0%) | 0 (0.0%) |
| 10:00 AM to 10:59 AM | 0 (0.0%) | 5 (10.6%) |
| 11:00 AM to 11:59 AM | 0 (0.0%) | 0 (0.0%) |
| 12:00 PM to 3:59 PM | 0 (0.0%) | 0 (0.0%) |
| 4:00 PM to 11:59 PM | 0 (0.0%) | 0 (0.0%) |
| Total | 83 (100.0%) | 47 (100.0%) |
Housing Occupancy in Chamisal
Occupancy by Ownership in Chamisal
Of the total 125 dwellings in Chamisal, owner-occupied units account for 105 (84.0%), while renter-occupied units make up 20 (16.0%).
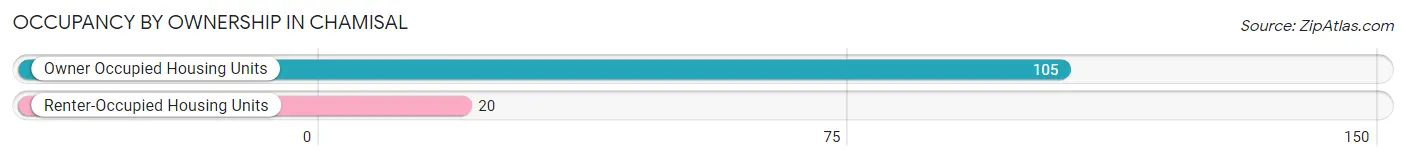
| Occupancy | # Housing Units | % Housing Units |
| Owner Occupied Housing Units | 105 | 84.0% |
| Renter-Occupied Housing Units | 20 | 16.0% |
| Total Occupied Housing Units | 125 | 100.0% |
Occupancy by Household Size in Chamisal
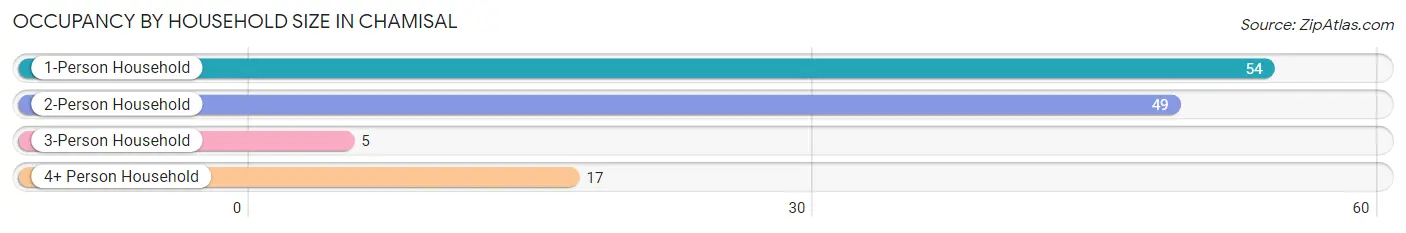
| Household Size | # Housing Units | % Housing Units |
| 1-Person Household | 54 | 43.2% |
| 2-Person Household | 49 | 39.2% |
| 3-Person Household | 5 | 4.0% |
| 4+ Person Household | 17 | 13.6% |
| Total Housing Units | 125 | 100.0% |
Occupancy by Ownership by Household Size in Chamisal
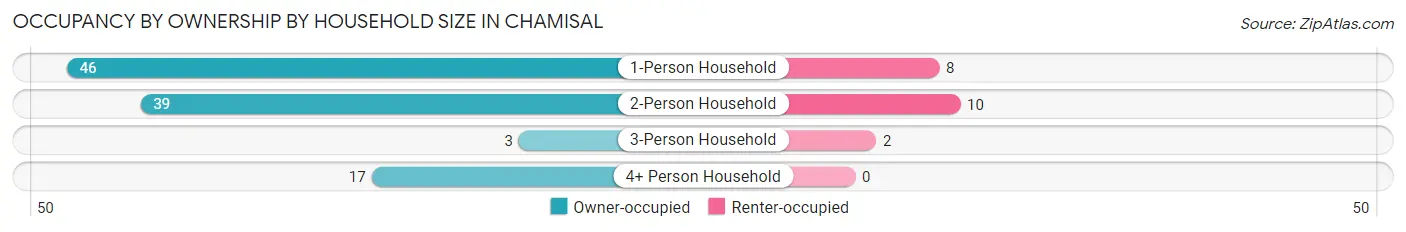
| Household Size | Owner-occupied | Renter-occupied |
| 1-Person Household | 46 (85.2%) | 8 (14.8%) |
| 2-Person Household | 39 (79.6%) | 10 (20.4%) |
| 3-Person Household | 3 (60.0%) | 2 (40.0%) |
| 4+ Person Household | 17 (100.0%) | 0 (0.0%) |
| Total Housing Units | 105 (84.0%) | 20 (16.0%) |
Occupancy by Educational Attainment in Chamisal
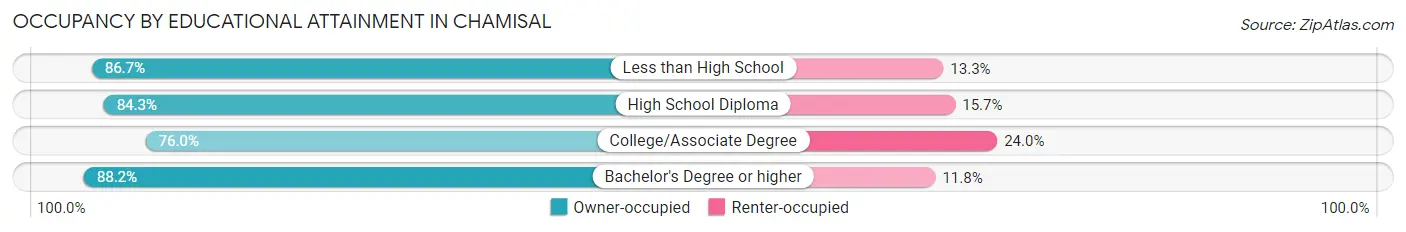
| Household Size | Owner-occupied | Renter-occupied |
| Less than High School | 13 (86.7%) | 2 (13.3%) |
| High School Diploma | 43 (84.3%) | 8 (15.7%) |
| College/Associate Degree | 19 (76.0%) | 6 (24.0%) |
| Bachelor's Degree or higher | 30 (88.2%) | 4 (11.8%) |
Occupancy by Age of Householder in Chamisal
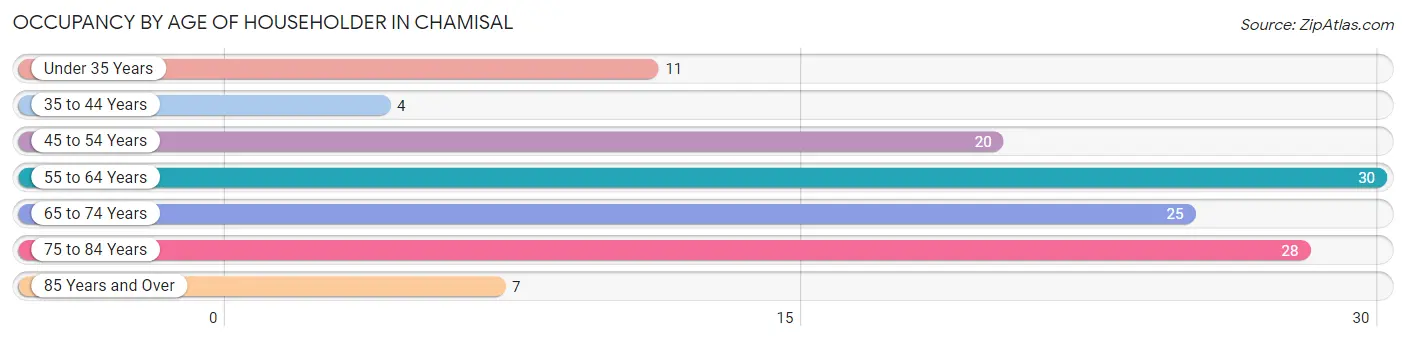
| Age Bracket | # Households | % Households |
| Under 35 Years | 11 | 8.8% |
| 35 to 44 Years | 4 | 3.2% |
| 45 to 54 Years | 20 | 16.0% |
| 55 to 64 Years | 30 | 24.0% |
| 65 to 74 Years | 25 | 20.0% |
| 75 to 84 Years | 28 | 22.4% |
| 85 Years and Over | 7 | 5.6% |
| Total | 125 | 100.0% |
Housing Finances in Chamisal
Median Income by Occupancy in Chamisal
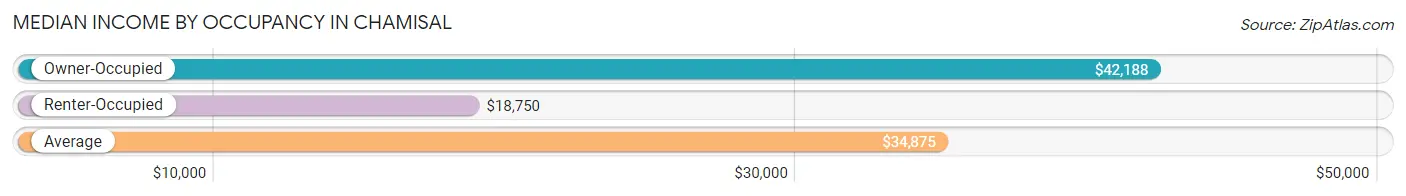
| Occupancy Type | # Households | Median Income |
| Owner-Occupied | 105 (84.0%) | $42,188 |
| Renter-Occupied | 20 (16.0%) | $18,750 |
| Average | 125 (100.0%) | $34,875 |
Occupancy by Householder Income Bracket in Chamisal
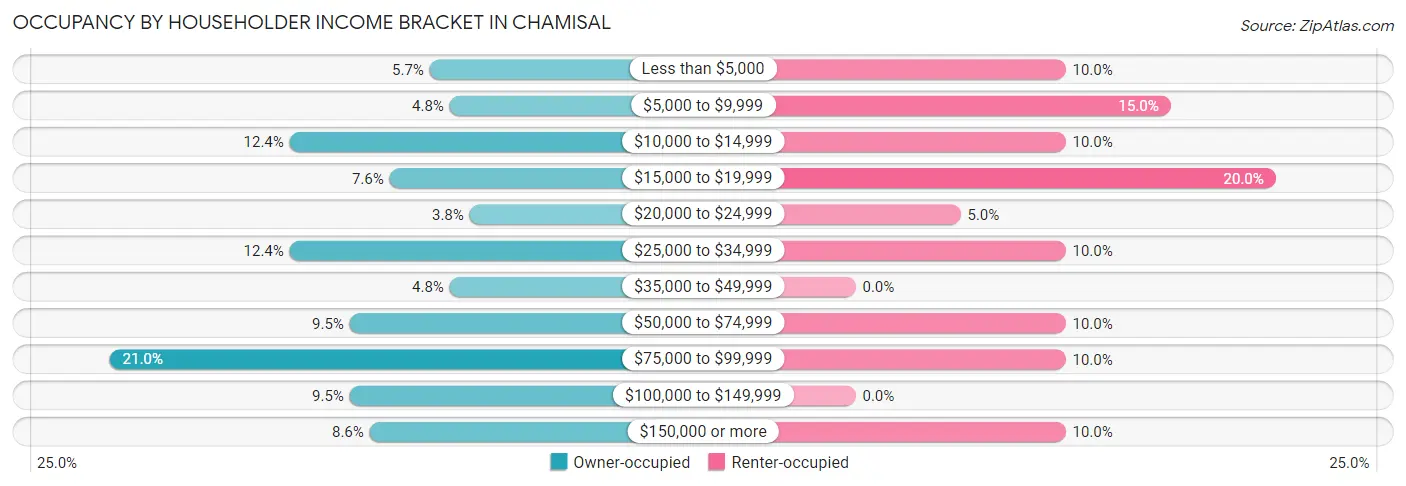
| Income Bracket | Owner-occupied | Renter-occupied |
| Less than $5,000 | 6 (5.7%) | 2 (10.0%) |
| $5,000 to $9,999 | 5 (4.8%) | 3 (15.0%) |
| $10,000 to $14,999 | 13 (12.4%) | 2 (10.0%) |
| $15,000 to $19,999 | 8 (7.6%) | 4 (20.0%) |
| $20,000 to $24,999 | 4 (3.8%) | 1 (5.0%) |
| $25,000 to $34,999 | 13 (12.4%) | 2 (10.0%) |
| $35,000 to $49,999 | 5 (4.8%) | 0 (0.0%) |
| $50,000 to $74,999 | 10 (9.5%) | 2 (10.0%) |
| $75,000 to $99,999 | 22 (20.9%) | 2 (10.0%) |
| $100,000 to $149,999 | 10 (9.5%) | 0 (0.0%) |
| $150,000 or more | 9 (8.6%) | 2 (10.0%) |
| Total | 105 (100.0%) | 20 (100.0%) |
Monthly Housing Cost Tiers in Chamisal
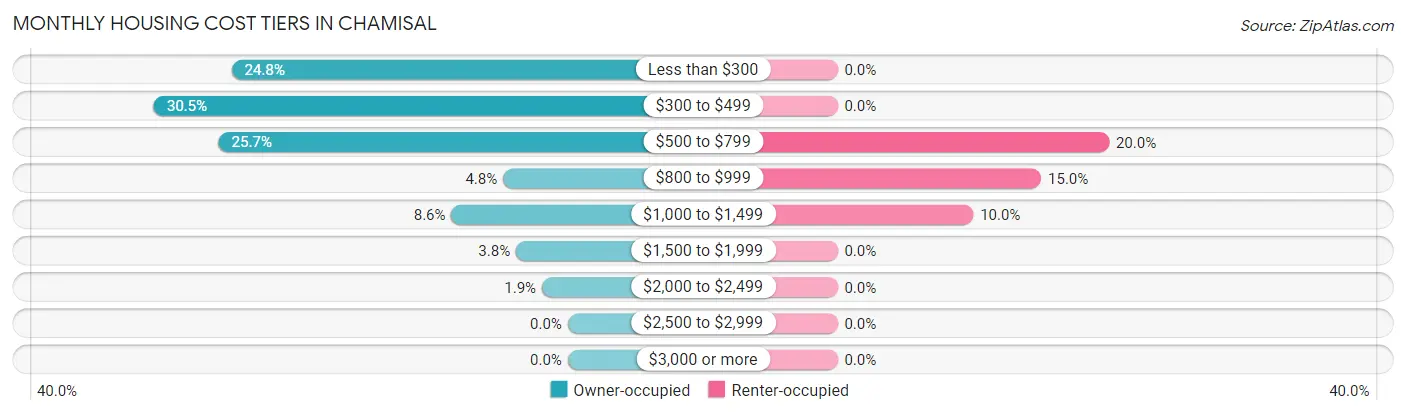
| Monthly Cost | Owner-occupied | Renter-occupied |
| Less than $300 | 26 (24.8%) | 0 (0.0%) |
| $300 to $499 | 32 (30.5%) | 0 (0.0%) |
| $500 to $799 | 27 (25.7%) | 4 (20.0%) |
| $800 to $999 | 5 (4.8%) | 3 (15.0%) |
| $1,000 to $1,499 | 9 (8.6%) | 2 (10.0%) |
| $1,500 to $1,999 | 4 (3.8%) | 0 (0.0%) |
| $2,000 to $2,499 | 2 (1.9%) | 0 (0.0%) |
| $2,500 to $2,999 | 0 (0.0%) | 0 (0.0%) |
| $3,000 or more | 0 (0.0%) | 0 (0.0%) |
| Total | 105 (100.0%) | 20 (100.0%) |
Physical Housing Characteristics in Chamisal
Housing Structures in Chamisal
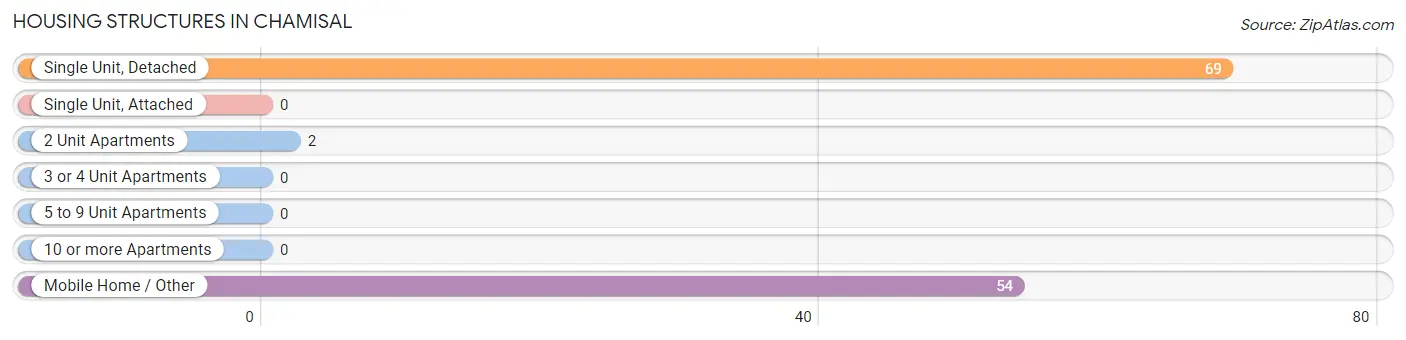
| Structure Type | # Housing Units | % Housing Units |
| Single Unit, Detached | 69 | 55.2% |
| Single Unit, Attached | 0 | 0.0% |
| 2 Unit Apartments | 2 | 1.6% |
| 3 or 4 Unit Apartments | 0 | 0.0% |
| 5 to 9 Unit Apartments | 0 | 0.0% |
| 10 or more Apartments | 0 | 0.0% |
| Mobile Home / Other | 54 | 43.2% |
| Total | 125 | 100.0% |
Housing Structures by Occupancy in Chamisal
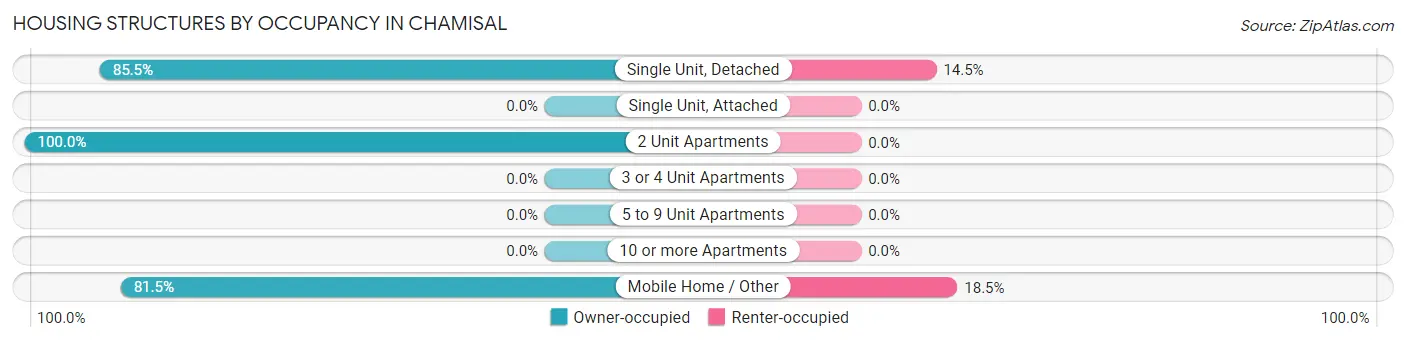
| Structure Type | Owner-occupied | Renter-occupied |
| Single Unit, Detached | 59 (85.5%) | 10 (14.5%) |
| Single Unit, Attached | 0 (0.0%) | 0 (0.0%) |
| 2 Unit Apartments | 2 (100.0%) | 0 (0.0%) |
| 3 or 4 Unit Apartments | 0 (0.0%) | 0 (0.0%) |
| 5 to 9 Unit Apartments | 0 (0.0%) | 0 (0.0%) |
| 10 or more Apartments | 0 (0.0%) | 0 (0.0%) |
| Mobile Home / Other | 44 (81.5%) | 10 (18.5%) |
| Total | 105 (84.0%) | 20 (16.0%) |
Housing Structures by Number of Rooms in Chamisal
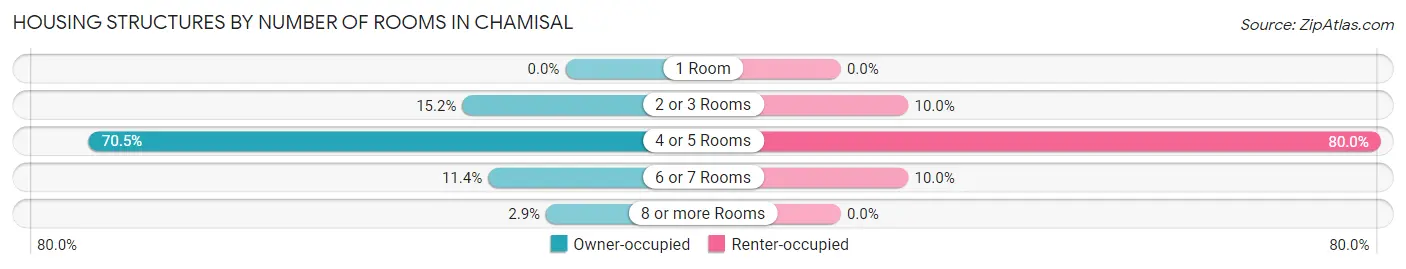
| Number of Rooms | Owner-occupied | Renter-occupied |
| 1 Room | 0 (0.0%) | 0 (0.0%) |
| 2 or 3 Rooms | 16 (15.2%) | 2 (10.0%) |
| 4 or 5 Rooms | 74 (70.5%) | 16 (80.0%) |
| 6 or 7 Rooms | 12 (11.4%) | 2 (10.0%) |
| 8 or more Rooms | 3 (2.9%) | 0 (0.0%) |
| Total | 105 (100.0%) | 20 (100.0%) |
Housing Structure by Heating Type in Chamisal
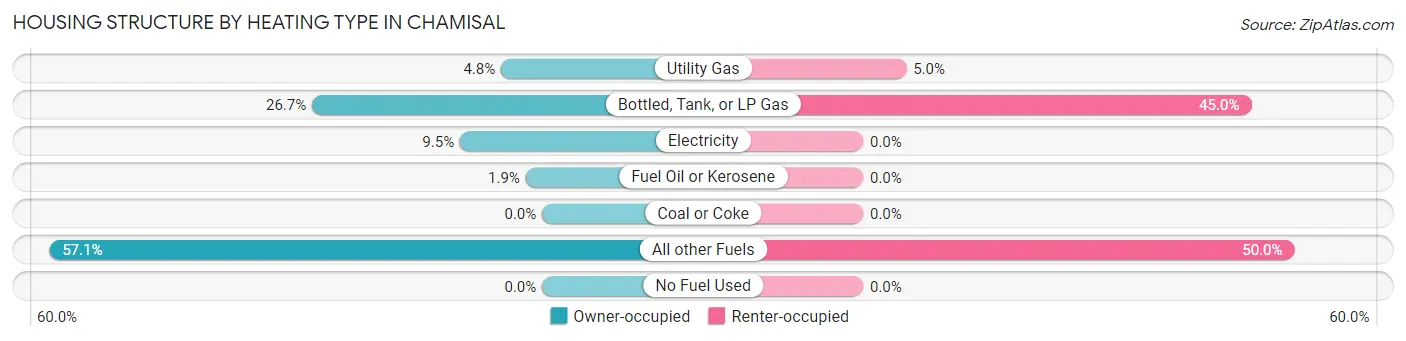
| Heating Type | Owner-occupied | Renter-occupied |
| Utility Gas | 5 (4.8%) | 1 (5.0%) |
| Bottled, Tank, or LP Gas | 28 (26.7%) | 9 (45.0%) |
| Electricity | 10 (9.5%) | 0 (0.0%) |
| Fuel Oil or Kerosene | 2 (1.9%) | 0 (0.0%) |
| Coal or Coke | 0 (0.0%) | 0 (0.0%) |
| All other Fuels | 60 (57.1%) | 10 (50.0%) |
| No Fuel Used | 0 (0.0%) | 0 (0.0%) |
| Total | 105 (100.0%) | 20 (100.0%) |
Household Vehicle Usage in Chamisal
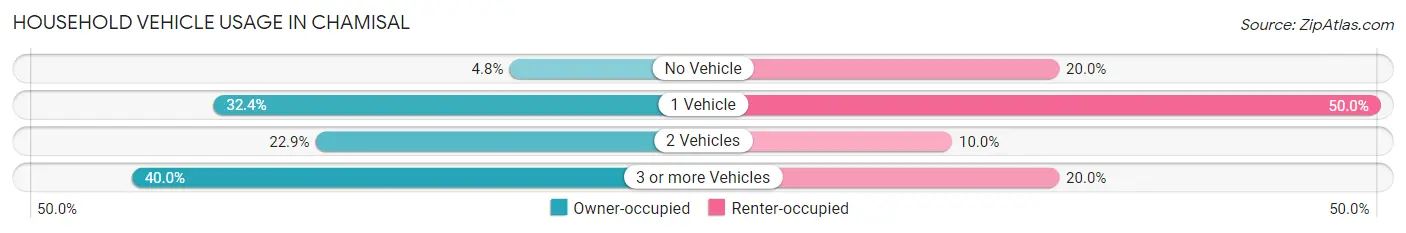
| Vehicles per Household | Owner-occupied | Renter-occupied |
| No Vehicle | 5 (4.8%) | 4 (20.0%) |
| 1 Vehicle | 34 (32.4%) | 10 (50.0%) |
| 2 Vehicles | 24 (22.9%) | 2 (10.0%) |
| 3 or more Vehicles | 42 (40.0%) | 4 (20.0%) |
| Total | 105 (100.0%) | 20 (100.0%) |
Real Estate & Mortgages in Chamisal
Real Estate and Mortgage Overview in Chamisal
| Characteristic | Without Mortgage | With Mortgage |
| Housing Units | 87 | 18 |
| Median Property Value | $185,200 | $158,300 |
| Median Household Income | $34,875 | $1 |
| Monthly Housing Costs | $389 | $0 |
| Real Estate Taxes | $470 | $0 |
Property Value by Mortgage Status in Chamisal
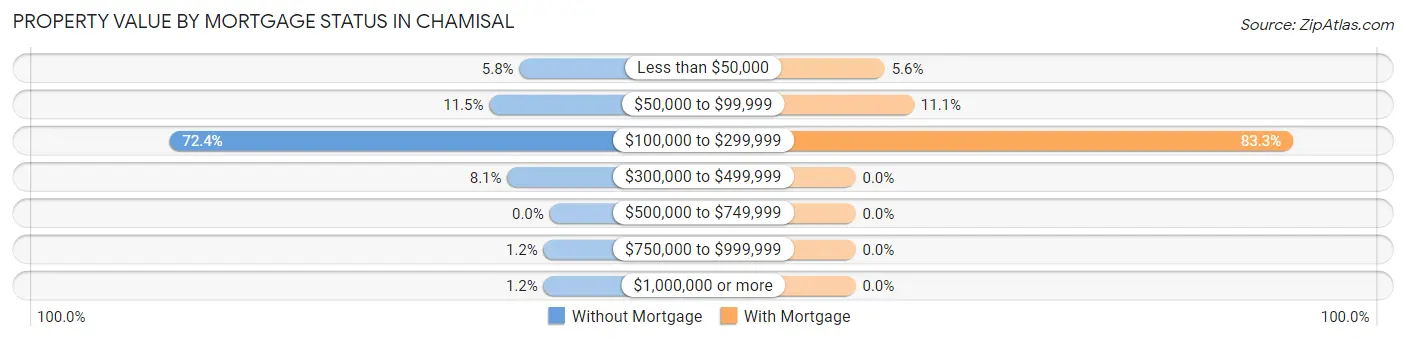
| Property Value | Without Mortgage | With Mortgage |
| Less than $50,000 | 5 (5.8%) | 1 (5.6%) |
| $50,000 to $99,999 | 10 (11.5%) | 2 (11.1%) |
| $100,000 to $299,999 | 63 (72.4%) | 15 (83.3%) |
| $300,000 to $499,999 | 7 (8.1%) | 0 (0.0%) |
| $500,000 to $749,999 | 0 (0.0%) | 0 (0.0%) |
| $750,000 to $999,999 | 1 (1.1%) | 0 (0.0%) |
| $1,000,000 or more | 1 (1.1%) | 0 (0.0%) |
| Total | 87 (100.0%) | 18 (100.0%) |
Household Income by Mortgage Status in Chamisal
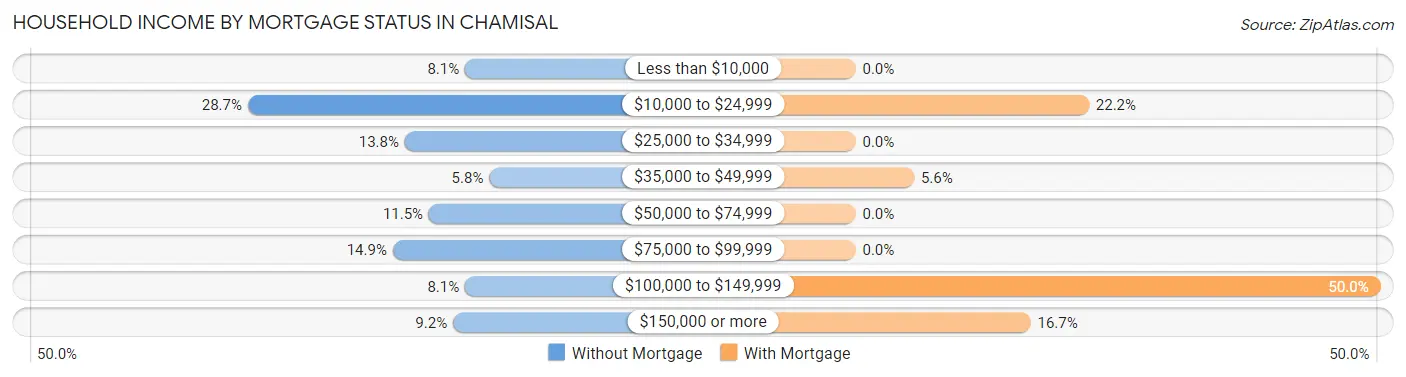
| Household Income | Without Mortgage | With Mortgage |
| Less than $10,000 | 7 (8.1%) | 0 (0.0%) |
| $10,000 to $24,999 | 25 (28.7%) | 4 (22.2%) |
| $25,000 to $34,999 | 12 (13.8%) | 0 (0.0%) |
| $35,000 to $49,999 | 5 (5.8%) | 1 (5.6%) |
| $50,000 to $74,999 | 10 (11.5%) | 0 (0.0%) |
| $75,000 to $99,999 | 13 (14.9%) | 0 (0.0%) |
| $100,000 to $149,999 | 7 (8.1%) | 9 (50.0%) |
| $150,000 or more | 8 (9.2%) | 3 (16.7%) |
| Total | 87 (100.0%) | 18 (100.0%) |
Property Value to Household Income Ratio in Chamisal
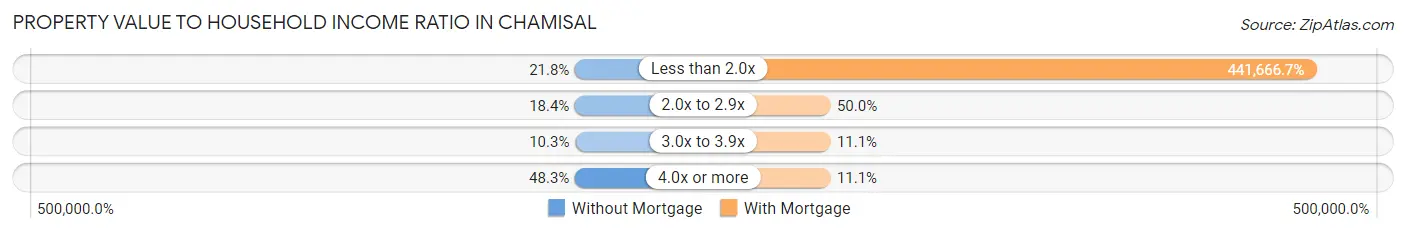
| Value-to-Income Ratio | Without Mortgage | With Mortgage |
| Less than 2.0x | 19 (21.8%) | 79,500 (441,666.7%) |
| 2.0x to 2.9x | 16 (18.4%) | 9 (50.0%) |
| 3.0x to 3.9x | 9 (10.3%) | 2 (11.1%) |
| 4.0x or more | 42 (48.3%) | 2 (11.1%) |
| Total | 87 (100.0%) | 18 (100.0%) |
Real Estate Taxes by Mortgage Status in Chamisal
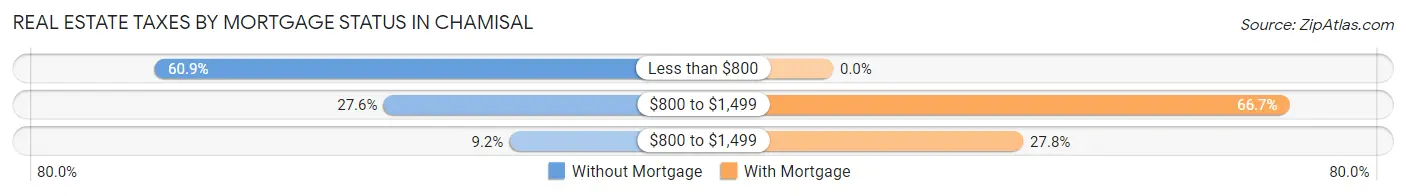
| Property Taxes | Without Mortgage | With Mortgage |
| Less than $800 | 53 (60.9%) | 0 (0.0%) |
| $800 to $1,499 | 24 (27.6%) | 12 (66.7%) |
| $800 to $1,499 | 8 (9.2%) | 5 (27.8%) |
| Total | 87 (100.0%) | 18 (100.0%) |
Health & Disability in Chamisal
Health Insurance Coverage by Age in Chamisal
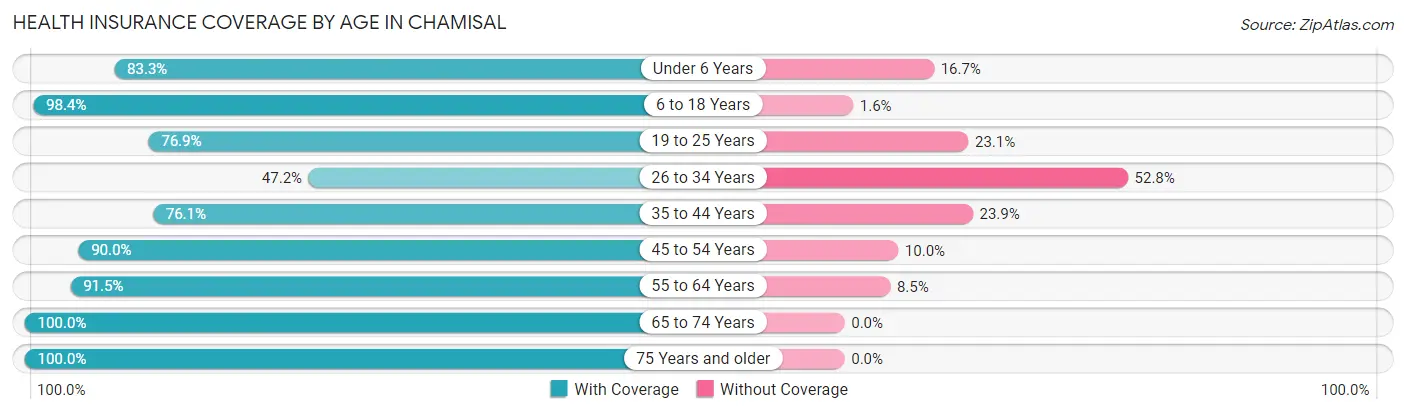
| Age Bracket | With Coverage | Without Coverage |
| Under 6 Years | 10 (83.3%) | 2 (16.7%) |
| 6 to 18 Years | 62 (98.4%) | 1 (1.6%) |
| 19 to 25 Years | 10 (76.9%) | 3 (23.1%) |
| 26 to 34 Years | 25 (47.2%) | 28 (52.8%) |
| 35 to 44 Years | 35 (76.1%) | 11 (23.9%) |
| 45 to 54 Years | 36 (90.0%) | 4 (10.0%) |
| 55 to 64 Years | 43 (91.5%) | 4 (8.5%) |
| 65 to 74 Years | 37 (100.0%) | 0 (0.0%) |
| 75 Years and older | 47 (100.0%) | 0 (0.0%) |
| Total | 305 (85.2%) | 53 (14.8%) |
Health Insurance Coverage by Citizenship Status in Chamisal
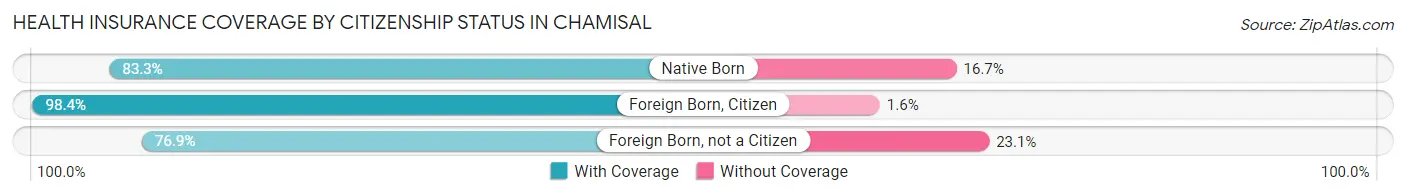
| Citizenship Status | With Coverage | Without Coverage |
| Native Born | 10 (83.3%) | 2 (16.7%) |
| Foreign Born, Citizen | 62 (98.4%) | 1 (1.6%) |
| Foreign Born, not a Citizen | 10 (76.9%) | 3 (23.1%) |
Health Insurance Coverage by Household Income in Chamisal
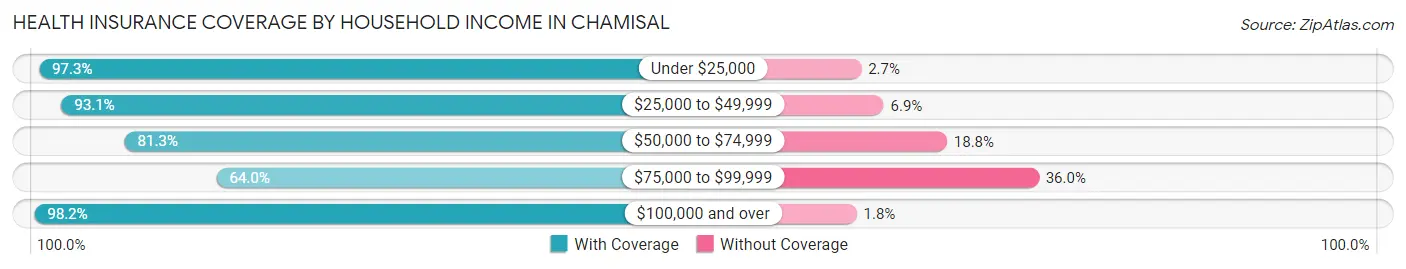
| Household Income | With Coverage | Without Coverage |
| Under $25,000 | 72 (97.3%) | 2 (2.7%) |
| $25,000 to $49,999 | 27 (93.1%) | 2 (6.9%) |
| $50,000 to $74,999 | 26 (81.2%) | 6 (18.8%) |
| $75,000 to $99,999 | 73 (64.0%) | 41 (36.0%) |
| $100,000 and over | 107 (98.2%) | 2 (1.8%) |
Public vs Private Health Insurance Coverage by Age in Chamisal
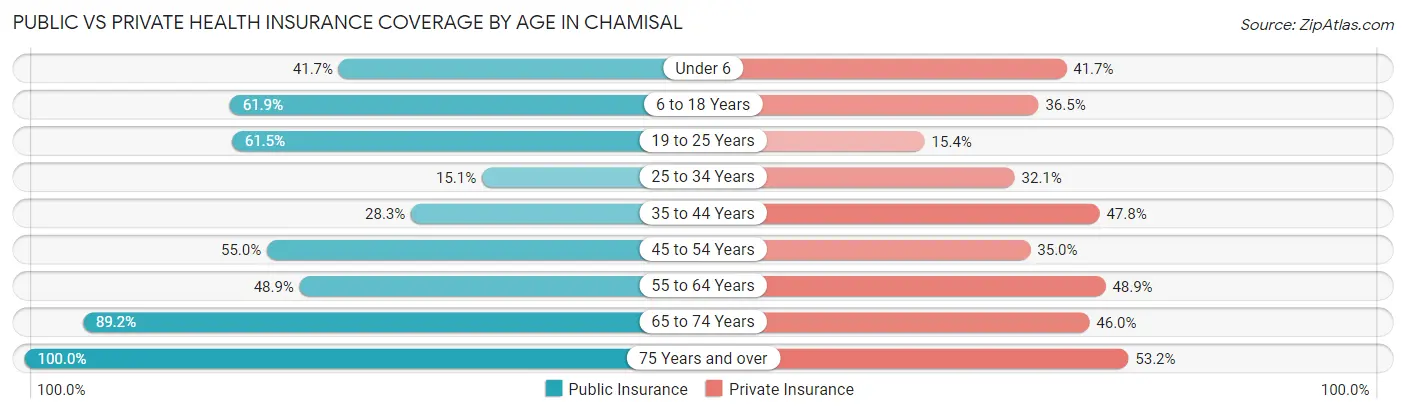
| Age Bracket | Public Insurance | Private Insurance |
| Under 6 | 5 (41.7%) | 5 (41.7%) |
| 6 to 18 Years | 39 (61.9%) | 23 (36.5%) |
| 19 to 25 Years | 8 (61.5%) | 2 (15.4%) |
| 25 to 34 Years | 8 (15.1%) | 17 (32.1%) |
| 35 to 44 Years | 13 (28.3%) | 22 (47.8%) |
| 45 to 54 Years | 22 (55.0%) | 14 (35.0%) |
| 55 to 64 Years | 23 (48.9%) | 23 (48.9%) |
| 65 to 74 Years | 33 (89.2%) | 17 (46.0%) |
| 75 Years and over | 47 (100.0%) | 25 (53.2%) |
| Total | 198 (55.3%) | 148 (41.3%) |
Disability Status by Sex by Age in Chamisal
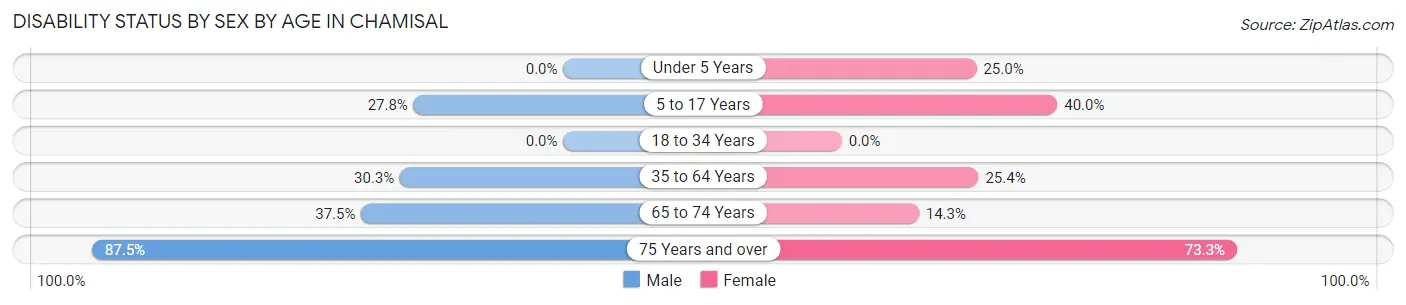
| Age Bracket | Male | Female |
| Under 5 Years | 0 (0.0%) | 2 (25.0%) |
| 5 to 17 Years | 10 (27.8%) | 4 (40.0%) |
| 18 to 34 Years | 0 (0.0%) | 0 (0.0%) |
| 35 to 64 Years | 20 (30.3%) | 17 (25.4%) |
| 65 to 74 Years | 6 (37.5%) | 3 (14.3%) |
| 75 Years and over | 28 (87.5%) | 11 (73.3%) |
Disability Class by Sex by Age in Chamisal
Disability Class: Hearing Difficulty
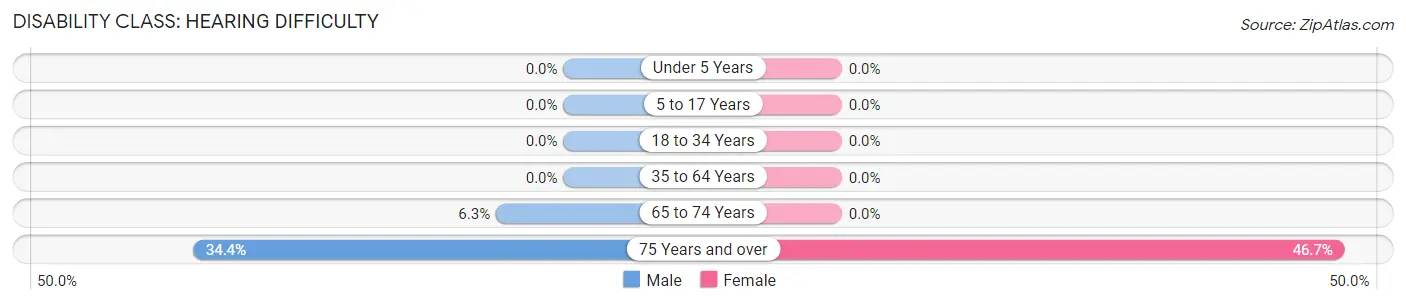
| Age Bracket | Male | Female |
| Under 5 Years | 0 (0.0%) | 0 (0.0%) |
| 5 to 17 Years | 0 (0.0%) | 0 (0.0%) |
| 18 to 34 Years | 0 (0.0%) | 0 (0.0%) |
| 35 to 64 Years | 0 (0.0%) | 0 (0.0%) |
| 65 to 74 Years | 1 (6.2%) | 0 (0.0%) |
| 75 Years and over | 11 (34.4%) | 7 (46.7%) |
Disability Class: Vision Difficulty
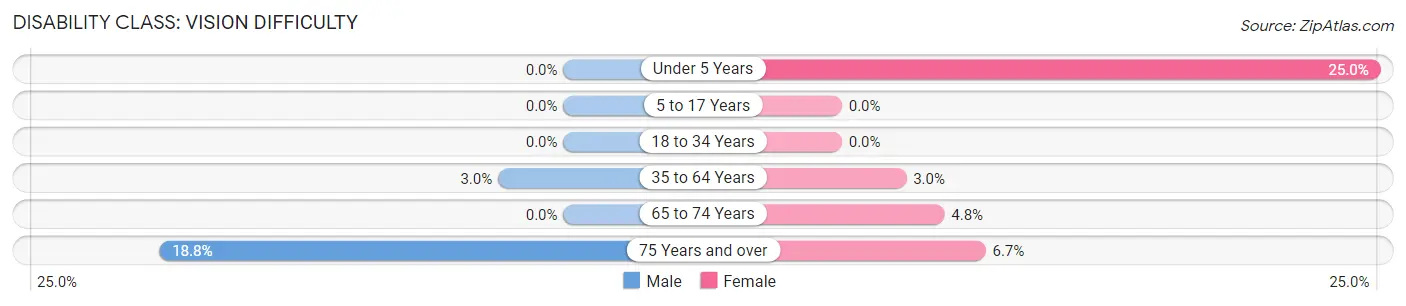
| Age Bracket | Male | Female |
| Under 5 Years | 0 (0.0%) | 2 (25.0%) |
| 5 to 17 Years | 0 (0.0%) | 0 (0.0%) |
| 18 to 34 Years | 0 (0.0%) | 0 (0.0%) |
| 35 to 64 Years | 2 (3.0%) | 2 (3.0%) |
| 65 to 74 Years | 0 (0.0%) | 1 (4.8%) |
| 75 Years and over | 6 (18.8%) | 1 (6.7%) |
Disability Class: Cognitive Difficulty
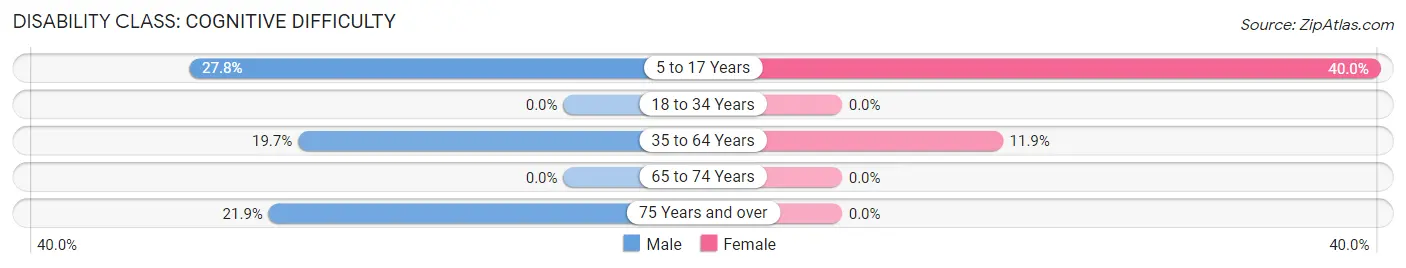
| Age Bracket | Male | Female |
| 5 to 17 Years | 10 (27.8%) | 4 (40.0%) |
| 18 to 34 Years | 0 (0.0%) | 0 (0.0%) |
| 35 to 64 Years | 13 (19.7%) | 8 (11.9%) |
| 65 to 74 Years | 0 (0.0%) | 0 (0.0%) |
| 75 Years and over | 7 (21.9%) | 0 (0.0%) |
Disability Class: Ambulatory Difficulty
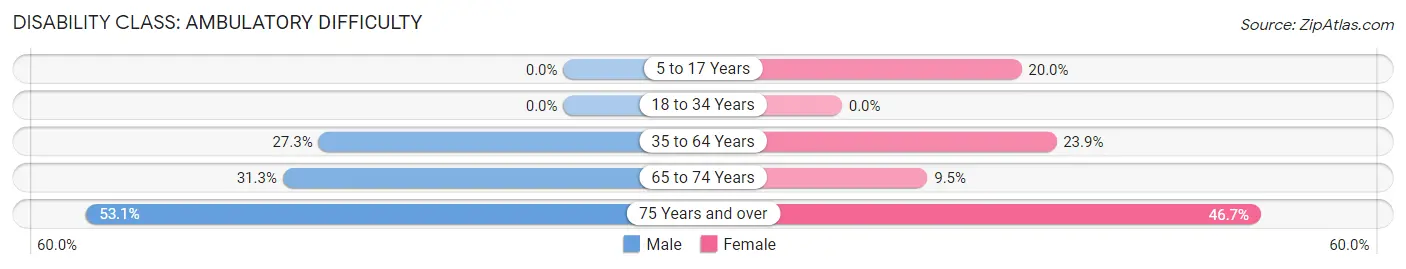
| Age Bracket | Male | Female |
| 5 to 17 Years | 0 (0.0%) | 2 (20.0%) |
| 18 to 34 Years | 0 (0.0%) | 0 (0.0%) |
| 35 to 64 Years | 18 (27.3%) | 16 (23.9%) |
| 65 to 74 Years | 5 (31.2%) | 2 (9.5%) |
| 75 Years and over | 17 (53.1%) | 7 (46.7%) |
Disability Class: Self-Care Difficulty
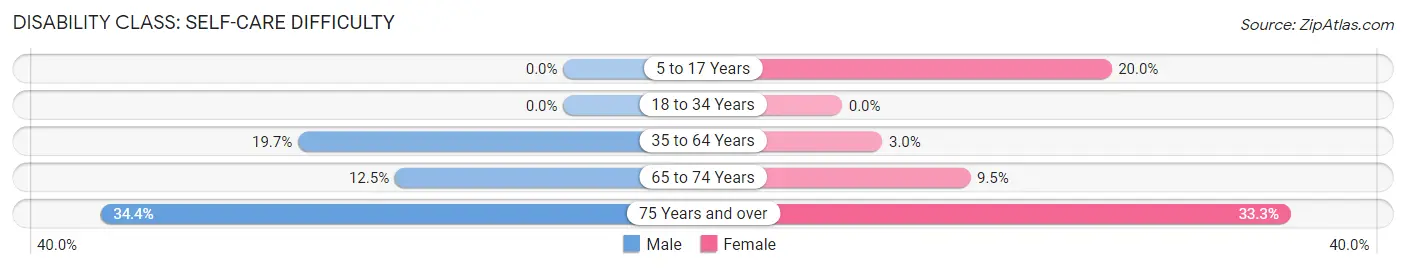
| Age Bracket | Male | Female |
| 5 to 17 Years | 0 (0.0%) | 2 (20.0%) |
| 18 to 34 Years | 0 (0.0%) | 0 (0.0%) |
| 35 to 64 Years | 13 (19.7%) | 2 (3.0%) |
| 65 to 74 Years | 2 (12.5%) | 2 (9.5%) |
| 75 Years and over | 11 (34.4%) | 5 (33.3%) |
Technology Access in Chamisal
Computing Device Access in Chamisal
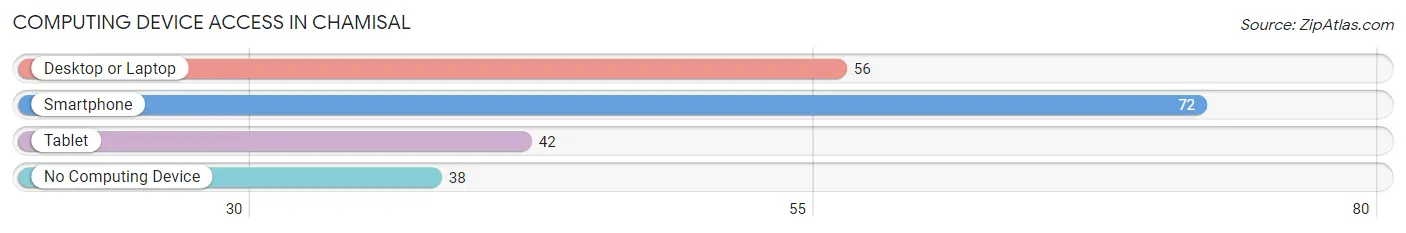
| Device Type | # Households | % Households |
| Desktop or Laptop | 56 | 44.8% |
| Smartphone | 72 | 57.6% |
| Tablet | 42 | 33.6% |
| No Computing Device | 38 | 30.4% |
| Total | 125 | 100.0% |
Internet Access in Chamisal
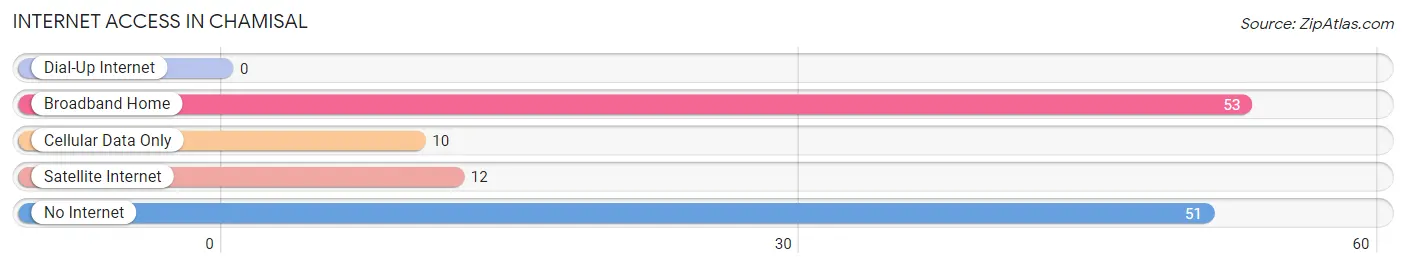
| Internet Type | # Households | % Households |
| Dial-Up Internet | 0 | 0.0% |
| Broadband Home | 53 | 42.4% |
| Cellular Data Only | 10 | 8.0% |
| Satellite Internet | 12 | 9.6% |
| No Internet | 51 | 40.8% |
| Total | 125 | 100.0% |
Chamisal Summary
Chamisal is a small unincorporated community located in Taos County, New Mexico. It is situated in the Sangre de Cristo Mountains, approximately 10 miles south of Taos. The community is located on the east side of the Rio Grande Gorge, and is surrounded by the Carson National Forest.
History
Chamisal was first settled in the late 1800s by Spanish settlers. The area was originally known as El Chamisal, which translates to “the place of the chamisa” in Spanish. The name was derived from the chamisa shrub, which is native to the area. The community was originally a small farming and ranching settlement, and the local economy was largely based on the production of wool and other livestock.
In the early 1900s, the community began to grow as more settlers moved to the area. The population peaked in the 1940s, when the population was estimated to be around 500 people. The population began to decline in the 1950s, as many of the residents moved away in search of better economic opportunities. By the 2000 census, the population had dropped to just over 200 people.
Geography
Chamisal is located in the Sangre de Cristo Mountains, at an elevation of 7,000 feet. The area is characterized by rolling hills, deep canyons, and lush forests. The Rio Grande Gorge is located just to the east of the community, and the Carson National Forest is located to the north and west. The climate in the area is semi-arid, with hot summers and cold winters.
Economy
The economy of Chamisal is largely based on tourism and agriculture. The area is popular with tourists, who come to enjoy the scenic beauty of the mountains and the Rio Grande Gorge. The local economy is also supported by the production of wool and other livestock. There are also several small businesses in the area, including a few restaurants, a gas station, and a few small shops.
Demographics
As of the 2000 census, the population of Chamisal was estimated to be 206 people. The racial makeup of the community was 94.2% White, 0.5% African American, 0.5% Native American, 0.5% Asian, and 4.3% from other races. The median household income was $25,000, and the median family income was $30,000. The per capita income was $14,000.
Conclusion
Chamisal is a small unincorporated community located in Taos County, New Mexico. It is situated in the Sangre de Cristo Mountains, and is surrounded by the Carson National Forest. The economy of the area is largely based on tourism and agriculture, and the population is estimated to be around 206 people. The area is popular with tourists, who come to enjoy the scenic beauty of the mountains and the Rio Grande Gorge.
Common Questions
What is Per Capita Income in Chamisal?
Per Capita income in Chamisal is $32,066.
What is the Median Family Income in Chamisal?
Median Family Income in Chamisal is $71,250.
What is the Median Household income in Chamisal?
Median Household Income in Chamisal is $34,875.
What is Income or Wage Gap in Chamisal?
Income or Wage Gap in Chamisal is 18.6%.
Women in Chamisal earn 81.4 cents for every dollar earned by a man.
What is Inequality or Gini Index in Chamisal?
Inequality or Gini Index in Chamisal is 0.48.
What is the Total Population of Chamisal?
Total Population of Chamisal is 358.
What is the Total Male Population of Chamisal?
Total Male Population of Chamisal is 222.
What is the Total Female Population of Chamisal?
Total Female Population of Chamisal is 136.
What is the Ratio of Males per 100 Females in Chamisal?
There are 163.24 Males per 100 Females in Chamisal.
What is the Ratio of Females per 100 Males in Chamisal?
There are 61.26 Females per 100 Males in Chamisal.
What is the Median Population Age in Chamisal?
Median Population Age in Chamisal is 40.9 Years.
What is the Average Family Size in Chamisal
Average Family Size in Chamisal is 4.1 People.
What is the Average Household Size in Chamisal
Average Household Size in Chamisal is 2.9 People.
How Large is the Labor Force in Chamisal?
There are 159 People in the Labor Forcein in Chamisal.
What is the Percentage of People in the Labor Force in Chamisal?
51.6% of People are in the Labor Force in Chamisal.
What is the Unemployment Rate in Chamisal?
Unemployment Rate in Chamisal is 1.3%.